 Open Access Article
Comparative study on the electronic structures and redox reactions in LiCrX2 and NaCrX2 (X = O and S)
Yuewen Hea,
Xiaohong Shia,
Meiying Zhenga,
Shunqing Wu *a,
Yong Yangb and
Zizhong Zhu
 *ac
*ac
aDepartment of Physics, Collaborative Innovation Center for Optoelectronic Semiconductors and Efficient Devices, Jiujiang Research Institute, Xiamen University, Xiamen 361005, China. E-mail: zzhu@xmu.edu.cn; wsq@xmu.edu.cn
bState Key Lab for Physical Chemistry of Solid Surfaces, Xiamen University, Xiamen 361005, China
cFujian Provincial Key Laboratory of Theoretical and Computational Chemistry, Xiamen University, Xiamen 361005, China
First published on 13th November 2019
Abstract
LiCrO2 and NaCrO2 have been well-studied as cathode materials in lithium and sodium ion batteries, while the studies on LiCrS2 and NaCrS2 are relatively rare. In this work, a comparative study on the electronic structures and redox reactions in oxides (LiCrO2, NaCrO2) and sulfides (LiCrS2, NaCrS2) is performed. A first-principles method has been used to calculate the Bader charge transfer, the electronic structures and the magnetic moments during the entire delithiation or desodiation process. The Bader charge analysis suggests that all the S, O and Cr ions in LiCrX2 and NaCrX2 participate in the redox reactions, where the loss of electrons of S ions is clearly larger than that of O ions. Besides, the redox processes of Cr ions are of much less significance. It is noted that, in the sulfides, Cr ions even gain a small portion of electrons rather than losing electrons during the extraction of Li/Na ions. All the charge transfer happens between the S-3p/O-2p and the Cr-3d bands. The redox reactions of O or S ions originate from the energy levels of O/S being pushed towards/across the Fermi surface due to the strong p–d hybridization.
1. Introduction
Lithium-ion batteries (LIBs) have been widely used in portable energy storage devices and consumer electronics, such as cellphones, laptops and even electric vehicles. Though LIBs have dominated the rechargeable battery market due to their excellent performances, lithium resources may not be sufficient to meet the increasing global demand for batteries. Compared with LIBs, sodium-ion batteries (SIBs) not only have similar electrochemical mechanisms, but there are also abundant sodium resources on the earth. No matter what type the battery is, capacity is one of the most important parameters. Over the past decades, a great deal of effort has been made to improve the capacity of cathode materials. The anionic redox may increase the capacity of cathode materials, therefore, extensive studies have been made on the anionic redox reactions from both the experimental and theoretical sides.1–4 Based on the first-principles calculations, Ceder et al.5 found that oxygen participated in the redox reactions when LixCoO2 was at a high potential. The change of the electronic structure of O in LixCoO2 was experimentally observed by O K-edge X-ray absorption spectroscopy (XAS) and X-ray photoelectron spectroscopy (XPS).6,7 Furthermore, Ceder and co-workers uncovered that the structural origin of the oxygen redox reaction came from Li–O–Li configurations for lithium excess materials or Li/M disordered oxides.8 Moreover, sulfur ions also participate in the redox reactions, which will be discussed in detail in this work. Nowadays, the redox reaction processes are considered as an important issue in further developing the high-capacity electrodes.Generally speaking, redox centers were regarded as metals for most of the cathode materials. However, in the study of NaCrS2 by Shadike et al.,9 Cr3+ was found not to participate in the redox reactions while only the S2− underwent oxidation/reduction during the charging/discharging processes. This phenomenon provokes us to study comparatively the redox reaction processes between the LiCrX2 and NaCrX2 (X = O and S). LiCrO2 was thought to possess poor electrochemical properties. However, by tailoring the size of LiCrO2, the poor electrochemical performances in the LiCrO2 can be dramatically enhanced.10 Compared with the unremarkable properties of layered LiCrO2 in LIBs, layered NaCrO2 is a promising cathode material in SIBs. NaCrO2 is also considered to be a safe electrode material since it is stable staying with the electrolyte of NaPF6, as compared with the delithiated Li0.5CoO2.11 In a word, LiCrX2 and NaCrX2 (X = O and S) show different properties in LIBs and SIBs.9–12 Hence, there is of significance to have a comparative study of the different electrochemical properties in Li and Na cells for LiCrX2 and NaCrX2 (X = O and S).
In this study, we focus on the redox reactions in the layered LiCrX2 and NaCrX2 (X = O and S) during the delithiation and desodiation processes. Based on the first-principles calculations, the charge transfer and the Bader charges are analyzed in order to understand the redox reaction processes in both LiCrX2 and NaCrX2 (X = O and S). We discover that all the Cr, O and S ions engage in the redox reactions in the four materials studied, where the loss of electrons by S ions are maximal. It is also found that, in the sulfides, Cr ions even gain a small portion of electrons rather than losing electrons during the extraction of Li/Na ions. The redox reaction processes are understood by the electronic structures and magnetization calculations during the charging/discharging processes.
2. Computational method
First-principles calculations were performed by using the projector augmented wave (PAW) scheme13 within the density functional theory (DFT) as implemented in the Vienna Ab initio Simulation Package (VASP).14,15 Exchange correlation energies were treated with the generalized gradient approximation (GGA) in the form proposed by Perdew, Burke, and Ernzerhof (PBE).16 To take into account the strong correlation effect of the transition metal Cr, we considered a Hubbard-like correction (GGA+U), with an effective interaction parameter Ueff = U − J employed in the calculations. In order to ensure the correctness of the U value, we have calculated Bader charge differences between x = 6 and x = 0 states as a function of U values (U = 1, 2, 3, 3.5, 4, 5). From the calculation results in Table 1, we found that Bader charge differences for different U values fluctuate inconspicuously. We therefore employ the U value of 3.5 eV.17 The wavefunctions of the system were expanded by plane waves, and the cutoff of the plane wave kinetic energies for the LiCrO2/NaCrO2 and LiCrS2/NaCrS2 systems were 600 eV and 500 eV, respectively. Brillouin-zone integrations were approximated by using special k-point sampling of the Monkhorst–Pack scheme18 with a 12 × 12 × 2 grid for the primitive unit cell and a 6 × 6 × 2 grid for the 2 × 2 × 1 supercell.| U value | 1 | 2 | 3 | 3.5 | 4 | 5 |
|---|---|---|---|---|---|---|
| ΔQ(Cr) | −0.10 | −0.07 | −0.09 | −0.12 | −0.07 | −0.09 |
| ΔQ(O) | −0.17 | −0.18 | −0.18 | −0.16 | −0.19 | −0.20 |
The lattice constants and the atomic positions were fully relaxed before the calculations of the electronic structures. The convergence thresholds for optimization were set to 10−5 eV per atom in energy and 0.01 eV Å−1 in force. Since the magnetic properties of Cr atoms might have important influences on the properties of the electronic structures of the materials, spin-polarized calculations were performed for all the systems. Moreover, a detailed exploration about charge transfer between atoms was made by the Bader charge analysis.19,20 The calculation of the redox reaction processes of the layered LiCrX2 and NaCrX2 (X = O and S) were carried out by a 2 × 2 × 1 supercell, which contained 12 formula units. It was then possible for us to deintercalate 1 to 12 lithium or sodium ions in the supercell. In this study, we chose to deintercalate 1, 3, 4, 6, 8, 11, and 12 lithium or sodium ions, respectively, to investigate the redox reaction processes in the four materials.
3. Results and discussion
3.1 Electronic structures of LiCrX2 and NaCrX2 (X = O and S)
Table 2 shows the structural parameters and the corresponding experimental values of the relaxed LiCrX2 and NaCrX2 (X = O and S). LiCrO2, NaCrO2 and NaCrS2 belong to R![[3 with combining macron]](https://www.rsc.org/images/entities/char_0033_0304.gif) m space group with layered rock-salt structure (α-NaFeO2),21,25,26 as shown in Fig. 1a, c and d. However, the space group of LiCrS2 is P
m space group with layered rock-salt structure (α-NaFeO2),21,25,26 as shown in Fig. 1a, c and d. However, the space group of LiCrS2 is P![[3 with combining macron]](https://www.rsc.org/images/entities/char_0033_0304.gif) m1, as shown in Fig. 1b.23 For LiCrO2, Li occupies 3a position, Cr occupies 3b position and O occupies 6c position, if represented by Wyckoff position. For NaCrO2 and NaCrS2, the 6c position is again occupied by O or S atoms, while the 3a and 3b positions are occupied by Cr and Na, respectively (here, the atomic occupation is opposite to those in LiCrO2). Besides, for LiCrS2, Li occupies 1b position, Cr occupies 1a position and S occupies 6i position.
m1, as shown in Fig. 1b.23 For LiCrO2, Li occupies 3a position, Cr occupies 3b position and O occupies 6c position, if represented by Wyckoff position. For NaCrO2 and NaCrS2, the 6c position is again occupied by O or S atoms, while the 3a and 3b positions are occupied by Cr and Na, respectively (here, the atomic occupation is opposite to those in LiCrO2). Besides, for LiCrS2, Li occupies 1b position, Cr occupies 1a position and S occupies 6i position.
| System | Space group | a (Å) | c (Å) | α (°) | γ (°) | V (Å3) | Ref. | |
|---|---|---|---|---|---|---|---|---|
| LiCrO2 | R![[3 with combining macron]](https://www.rsc.org/images/entities/char_0033_0304.gif) m m |
Ours | 2.97 | 14.49 | 90 | 120 | 110.54 | |
| Exp | 2.90 | 14.43 | 90 | 120 | 105.18 | 21 | ||
| Exp | 2.90 | 14.41 | 90 | 120 | 104.37 | 22 | ||
| LiCrS2 | P![[3 with combining macron]](https://www.rsc.org/images/entities/char_0033_0304.gif) m1 m1 |
Ours | 3.54 | 18.10 | 90 | 120 | 195.88 | |
| Exp | 3.45 | 18.064 | 90 | 120 | 186.36 | 23 | ||
| Exp | 3.46 | 18.06 | 90 | 120 | 186.81 | 24 | ||
| NaCrO2 | R![[3 with combining macron]](https://www.rsc.org/images/entities/char_0033_0304.gif) m m |
Ours | 3.04 | 15.90 | 90 | 120 | 127.05 | |
| Exp | 2.98 | 15.98 | 90 | 120 | 122.64 | 25 | ||
| NaCrS2 | R![[3 with combining macron]](https://www.rsc.org/images/entities/char_0033_0304.gif) m m |
Ours | 3.63 | 19.43 | 90 | 120 | 221.52 | |
| Exp | 3.56 | 19.37 | 90 | 120 | 212.08 | 26 | ||
| Exp | 3.53 | 19.49 | 90 | 120 | 210.80 | 27 |
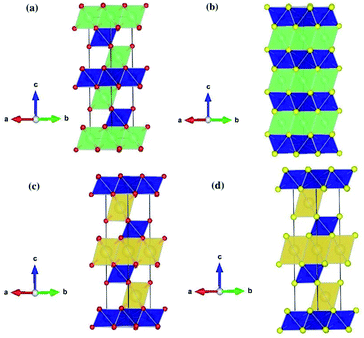 | ||
| Fig. 1 Schematic crystal structures of LiCrX2 and NaCrX2 (X = O and S) for (a) LiCrO2; (b) LiCrS2; (c) NaCrO2; (d) NaCrS2. | ||
All the four systems studied, i.e., LiCrX2 and NaCrX2 (X = O and S), are layered materials. These layered structures are composed of sheets of edge-sharing MO6 octahedra (M = Li, Na, Cr), with M atoms occupy the center of the octahedra. The diversity of the layered materials is reflected by different orientations of sheets of edge-sharing MO6 octahedra stacked along the c-axis direction. According to Delmas et al.,28 the layered oxide with general formula AxMO2 can be classified into three groups, i.e., O type (octahedral), T type (tetrahedral) and P type (prismatic). The classification is based on the coordination polyhedron formed by A ions. As shown in Fig. 1, the coordination polyhedra formed by the alkali metal ions in the materials are all octahedrons. Except that LiCrS2 is O2 type, all the other three structures are O3 type, here the number 2 or 3 represents the packing number of layers of the least repeating unit of oxygen or sulfur atoms in the unit cell. In the O type material, lithium/sodium ions should pass through the tetrahedra between octahedra during their diffusion, while in the P type material, lithium or sodium ions can directly diffuse between prisms, so that ions migration rate of P type material is usually higher than that of O type material.29
In order to understand the electronic properties of LiCrX2 and NaCrX2 (X = O and S), we have calculated the spin-polarized band structures of these materials. It is shown that the electronic structures of NaCrX2 are similar to those of LiCrX2, so we will not go into the details of NaCrX2 hereinafter. It can be seen from Fig. 2 that LiCrO2 is an indirect bandgap semiconductor, with the conduction band minimum (CBM) of the spin-up band very much close to the M point, and the valence band maximum (VBM) near the L point along the A–L direction. The bandgap of the spin-up dispersion is 2.90 eV. On the other hand, the CBM of the spin-down band is located at the Γ point, the VBM is near the middle of the K and Γ points, and the bandgap of the spin-down bands is 4.25 eV. According to our calculation results, LiCrS2 is also an indirect bandgap semiconductor. The spin-up bandgap is 1.16 eV. On the other hand, the spin-down bandgap is 2.18 eV. The bandgaps of LiCrS2 are much smaller than those of LiCrO2, since the electronegativity of S is smaller than that of O. From Fig. 2, the spin-up bands exhibit significant differences from the spin-down ones, indicating that LiCrO2 is magnetic semiconductor with obvious spin polarization. Obviously, the electronic conductivity of these materials should be small when lithium or sodium ions are not extracted, due to the relatively large values of bandgaps. The conductivity of the materials could be improved by lithium/sodium deintercalations, carbon coating and doping.30
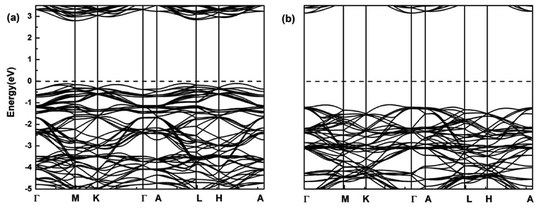 | ||
| Fig. 2 Spin-polarized band structures of LiCrO2 for (a) spin-up; (b) spin-down. The dashed lines show the Fermi level. | ||
For further understanding the bonding properties of the materials, we have calculated the deformation charge densities, shown by contour plots on two characteristic planes. Here, the deformation charge density is defined as the difference between the self-consistent charge density of the system and the superposition of the individual atomic charge densities, i.e.,  where
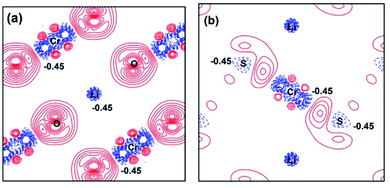
where  are the atomic positions.31 Fig. 3a and b present the contour plots of the deformation charge density on (110) of the LiCrO2 and LiCrS2, respectively. It can be seen from Fig. 3a that charge accumulates around O, while charge reduces significantly around Cr, suggesting that Cr–O bonding is mainly ionic (also mixed with some covalent). However, in Fig. 3b, the plots indicate a strong covalent bonding between Cr and S atoms (also mixed with ionic character), compared with strong ionic character in Cr–O bond. In one word, comparing Fig. 3a with Fig. 3b, bonding characteristics between O–Cr–O are mainly ionic in LiCrO2, while those between S–Cr–S are mainly covalent in LiCrS2. We also discover that a significant number of electrons are transferred to O ions in LiCrO2, compared with only a portion of electrons are moved to S ions in LiCrS2. Such a feature is consistent with the fact that the electronegativity of O is larger than that of S.
The population analysis is helpful for understanding the gain/loss of charges, where the detailed contributions from each atom and each atomic orbital to the electronic states (wavefunction) can be obtained. That is,
The coefficients  could help analyze the hybridizations of atomic orbitals and the populations as well. Here, as an example, the electronic state (wavefunction) at the valence band maximum (VBM) is found to be contributed mainly by the dx2–y2, dxy, dyz states of Cr atoms.
3.2 The Bader charges and redox reaction processes
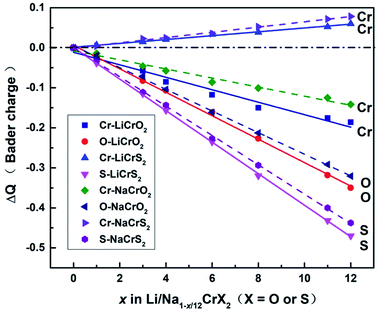
Upon charging, lithium or sodium ions deintercalate gradually from the cathode material under electric field. In order to calculate the Bader charges, the delithiation or desodiation processes should be determined. Here, we choose to deintercalate 1, 3, 4, 6, 8, 11 and 12 lithium or sodium ions in the supercell, respectively. Since there are numerous configurations have to be calculated during the charging processes, here, we describe an approximate scheme to obtain the minimum energy structure (MES) for Li1−x/12CrX2 and Na1−x/12CrX2 (X = O or S) at various lithium/sodium compositions. When only one lithium or sodium ion is to be deintercalated, we can easily consider all the non-equivalent lithium or sodium sites, since the number of equivalent sites is limited. When two lithium/sodium ions are deintercalated, the structures with nearest and farthest lithium/sodium ions are first calculated. Some other structures of the lithium/sodium ion pairs (not in the nearest or farthest) are carefully chosen, only these structures, but not all, are calculated to help judge the MES. When three lithium/sodium ions are to be extracted, all the possible structures where three lithium/sodium ions are in the nearest or farthest positions are first considered (including the structures where two lithium/sodium ions are in the nearest/farthest while one lithium/sodium ion is in the farthest/nearest). In addition, we calculate part of the structures beyond the cases mentioned above, in order to help determine the MES. For more than three lithium or sodium ions are to be deintercalated, the same philosophy discussed above are applied. In fact, when x = 12, we have a definite structure to calculate, with all Li/Na ions extracted. When x = 11, the way for determining the lithium or sodium sites is equivalent to those of x = 1. Similarly, if x = 10, the situation is the same as x = 2, and so on.To explore the redox reactions during the charging/discharging processes, we have calculated the Bader charges of the Li1−x/12CrX2 and Na1−x/12CrX2 (X = O or S, x = 0, 1, 3, 4, 6, 8, 11, 12). Fig. 4 shows the Bader charge loss/gain relative to the fully lithiated/sodiated phases (x = 0) for each x composition, based on the first-principles calculations. As shown in Fig. 4, both the oxygen and sulfur ions lose electrons apparently (relative to O and S ions at x = 0) in either case, during the entire intercalation/deintercalation processes. However, it can be seen from Fig. 4 that Cr ions lose electrons in the oxides while gain electrons in the sulfides (relative to x = 0). It is noted that the gain/loss of charges of Cr ions are relatively less conspicuous as compared with those of O and S ions, among x = 0 to x = 12. For example, for the chromium in sulfides, Cr ions gain only a small number of electrons (less than 0.1 e) in the redox reactions. Moreover, the loss/gain of electrons by the Cr, O and S ions increase linearly as the extraction of lithium or sodium ions increase.
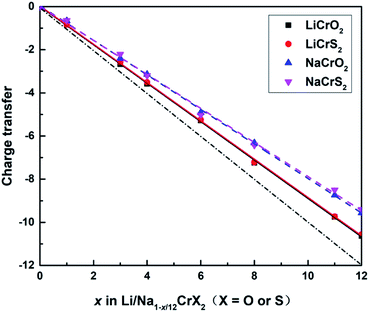
The sum of the Bader charges from Cr and O/S ions, relative to the fully lithiated/sodiated states, during the redox processes are shown in Fig. 5. Once a lithium or sodium ion is deintercalated, the remaining ions (i.e., Cr, O and S ions) have to compensate one electron. The dot-dashed line in Fig. 5 represents the number of electrons required to compensate for the charge loss due to delithiation/desodiation. The deviation from the dot-dashed line for the curves of the calculated Bader charges indicates the error of the Bader charge calculation method in this paper. It can be seen from Fig. 5 that the error of the calculated Bader charges increase gradually as the extraction of lithium or sodium ions increases.
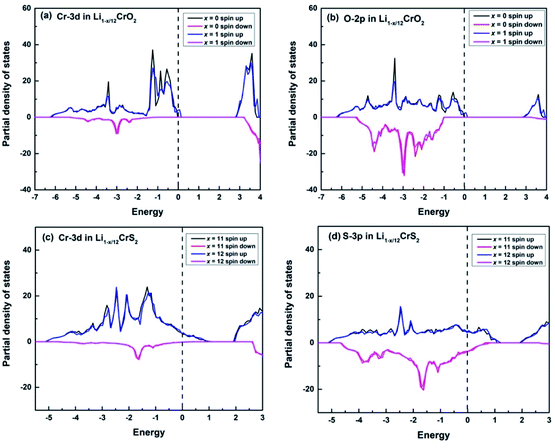
For the majority of delithiation or desodiation processes, transition metal ions are traditionally thought to be the major active composition in the redox reaction processes. However, the present results show that redox reactions are always dominated by oxygen or sulfur ions in both the LiCrX2 and NaCrX2 (X = O and S) systems. For understanding the redox processes in Fig. 4, the spin-polarized partial density of states (PDOS) of Cr-3d and O-2p states for Li1−x/12CrO2 (with x = 0 and x = 1) are presented in Fig. 6a and b. It can be seen that LiCrO2 (x = 0) is a semiconductor, with all the electronic states of Cr and O ions occupied at the Fermi surface. However, for x = 1, some part of the Cr-3d and O-2p electrons are lost, some of the Cr-3d and O-2p states cross the Fermi surface which indicates the electron loss (electrons near the Fermi surface will be lost at first, but lost electrons are not limited only to those around the Fermi level). On the other hand, for Li1−x/12CrS2 (with x = 11 and x = 12) where PDOS are shown in Fig. 6c and d, results shows that the shifts of Fermi levels are very small for Li1−x/12CrS2, with x = 12 compared with x = 11. The loss of electrons in the Li1−x/12CrS2 systems are embodied in the whole energy region in the PDOS plot (see Fig. 6c). It should be mentioned that PDOS values in Fig. 6 are large, since they are contributed from all the atoms in the unit cell. Fig. 4 also indicates that charge transfer can happen from sulfur to chromium. Such “anomalously” charge transfer from anions to cations (O to Ru ions) have also been found in the first-principles calculations by Tarascon et al.,32 where the authors proposed a reductive coupling mechanism to explain the charge transfer from oxygen to metal ions. Summarizing, during the delithiation/desodiation processes, chromium ions lose electrons in oxides while gain electrons in sulfides, resulting from the weaker electronegativity of sulfur compared with oxygen.
From our electronic structure calculations, the Cr-3d and O-2p/S-3p states show significant overlaps, indicating that Cr and O/S orbitals possess strong hybridization. The redox processes can be understood through the energy levels of O/S (as well as Cr ions in the oxides) being pushed towards/cross the Fermi surface under strong p–d hybridization, leading to remarkably electron loss from the O/S energy levels. Such a picture explains the redox phenomenon in the LiCrX2 and NaCrX2 (X = O and S) systems. In addition, the coordination number around O/S ions decreases as the number of deintercalated lithium/sodium ions increases. More electrons might become unconstrained, resulting in larger DOS on the Fermi surface which might also be a reason to explain roughly the redox processes (Fig. 4) in the systems.
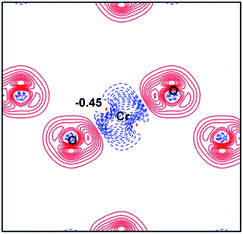
Here, the spin-polarized band structures of the fully delithiated/desodiated phase CrO2 (x = 12) are presented in Fig. 7. Comparing Fig. 7 with Fig. 2, we discover that when lithium ions are fully deintercalated, CrO2 (x = 12) become a half-metal while LiCrO2 (x = 0) is a semiconductor. From Fig. 2, it can be expected that, for the spin-up component, more and more bands around the Fermi level should become unoccupied due to the delithiation/desodiation, leading to half-metallic characteristics. Such a half-metallic character of CrO2 has been well-studied in the literature.33 Comparison of charge densities for the Cr–O bond in LiCrO2 and CrO2 are also presented in Fig. 3a and 8. Fig. 8 reveals that the ionicity of the Cr–O bond for the fully delithiated phase is remarkably stronger than that of the fully lithiated phase. That is to say, the contours plots indicate that more significant loss of charges in CrO2 can be found as compared with those in LiCrO2, which is consistent with the analysis of Bader charges.
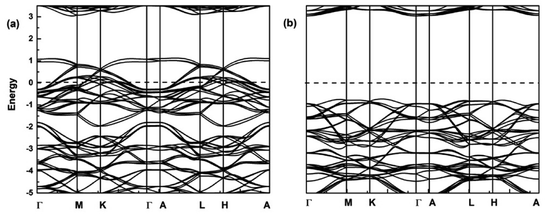 | ||
| Fig. 7 Spin-polarized band structures of CrO2 (x = 12) for (a) spin-up; (b) spin-down. The dashed lines show the Fermi level. | ||
3.3 Magnetization
The magnetic moments could also help understand the redox reaction processes in these materials during the delithiation or desodiation processes. The calculated magnetic moments of Li1−x/12CrX2 and Na1−x/12CrX2 (X = O and S) at different lithium/sodium compositions are listed in Table 3. According to the crystal field theory, for a given octahedral MO6 polyhedron, the five d-orbitals of Cr split into two sets with eg and t2g symmetries. The energy levels in t2g symmetry are comparatively lower than those in eg symmetry. The electronic configuration of Cr atom is 3d54s1. Chromium atoms will lose their one 4s electron and two 3d electrons in the processes of forming the LiCrX2 and NaCrX2 (X = O and S), leading to the Cr3+ and the electronic configuration of 3d3 (resulting in an atomic magnetic moment of 3 μB of Cr3+). Since all the Cr3+, O2− and S2− have been shown to participate in the redox processes when lithium or sodium ions are gradually deintercalated, the magnetization of the systems might happen, at least at low temperatures. The total magnetic moments of the systems (per formula unit), magnetic moments of the chromium ions together with the absolute values of the total magnetic moments minus the magnetic moments of chromium ions (designated as |Δ|) are listed in Table 3. In this paper, we take |Δ|/2 as the magnetic moment per oxygen/sulfur ion (there are two O/S ions per formula unit). From Table 3, we can notice that the changes of magnetic moments for oxides are quite different from those of sulfides, we therefore discuss them separately.| Molecular formula | Magnetic moments (μB) | ||||||||
|---|---|---|---|---|---|---|---|---|---|
| x in Li/Na1−x/12CrX2 | 0 | 1 | 3 | 4 | 6 | 8 | 11 | 12 | |
| LiCrO2 | Total | 2.94 | 2.86 | 2.71 | 2.63 | 2.48 | 2.32 | 2.1 | 2.02 |
| Cr | 2.99 | 2.95 | 2.85 | 2.76 | 2.68 | 2.54 | 2.52 | 2.44 | |
| |Δ| | 0.05 | 0.09 | 0.14 | 0.13 | 0.2 | 0.18 | 0.42 | 0.42 | |
| NaCrO2 | Total | 2.96 | 2.88 | 2.73 | 2.66 | 2.5 | 2.35 | 2.12 | 2.04 |
| Cr | 3.06 | 3.02 | 2.91 | 2.90 | 2.78 | 2.74 | 2.59 | 2.57 | |
| |Δ| | 0.1 | 0.14 | 0.18 | 0.24 | 0.28 | 0.39 | 0.47 | 0.53 | |
| LiCrS2 | Total | 2.94 | 2.89 | 2.78 | 2.74 | 2.65 | 2.57 | 2.51 | 2.48 |
| Cr | 3.19 | 3.19 | 3.18 | 3.18 | 3.15 | 3.13 | 3.08 | 3.07 | |
| |Δ| | 0.25 | 0.3 | 0.4 | 0.44 | 0.5 | 0.56 | 0.57 | 0.59 | |
| NaCrS2 | Total | 3.02 | 2.96 | 2.85 | 2.83 | 2.69 | 2.68 | 2.56 | 2.51 |
| Cr | 3.32 | 3.32 | 3.29 | 3.29 | 3.26 | 3.24 | 3.15 | 3.14 | |
| |Δ| | 0.3 | 0.36 | 0.44 | 0.46 | 0.57 | 0.56 | 0.59 | 0.63 | |
At first, during the delithiation or desodiation of oxides Li1−x/12CrO2 or Na1−x/12CrO2 (in the processes of redox reaction x = 1, 3, 4, …, 12), the total magnetic moments per formula unit change from about 3 μB (x = 0) to about 2 μB (x = 12). We might expect that Cr ions (with local magnetic moment of 3 μB) compensate one electron (for extraction of one Li/Na) to become a Cr ion with magnetic moment of 2 μB, but this is not the case. Both the chromium and oxygen ions play important roles in the compensation processes during the extraction of lithium/sodium ions. For Cr ions, magnetic moments vary from about 3 μB (x = 0) to about 2.5 μB (x = 12), for O ions, on the other hand, magnetic moments vary from 0 μB (x = 0) to about 0.5 μB (x = 12), as shown in Table 3. The magnetic moments of Cr ions decrease almost linearly with the composition x, while those of O increase linearly with x, resulting in a total magnetic moment of 2.0 μB (x = 12) per formula unit, supposing that the directions of Magnetic moments of Cr and O are in opposite.
On the other hand, during the delithiation or desodiation of sulfides Li1−x/12CrS2 or Na1−x/12CrS2, (in the processes of redox reactions x = 1, 3, 4, …, 12), the total magnetic moments of the systems and magnetic moments of Cr, S ions are also presented in Table 3. The results show that sulfur plays a major role in the compensation processes during the extraction of lithium or sodium ions. The magnetic moment of S (two S ions per formula unit) changes from about 0.3 μB (x = 0) to about 0.6 μB (x = 12). Moreover, the variation of the magnetic moment of Cr is less than 0.2 μB throughout the entire redox processes. The magnitudes of the magnetic moments of Cr ions are all larger than 3 μB, which suggests that Cr ions should gain charges rather than loss of electrons during the extraction of Li/Na ions. Compared with the delithiation/desodiation processes in sulfides, the magnetic moments of Cr ions in the oxides are always less than 3 μB, indicating the loss of electrons by Cr during the redox processes. These discussions are in very good agreements with our Bader charge analysis. The magnetic moments of S increase almost linearly with the composition x, while those of Cr almost keep unchanged, resulting in a total magnetic moment of 2.5 μB (x = 12) per formula unit, considering that the directions of magnetic moments of Cr and S are in opposite.
4. Conclusions
In summary, we have employed the first-principles methods within the density functional theory to study the Bader charge transfer, the structural properties, electronic structures and the magnetizations during the entire delithiation or desodiation processes. The calculation results indicate that both the anions and cations participate in the redox reactions when the lithium or sodium ions are extracted from LiCrX2 or NaCrX2 (X = O and S). Compared with cations, the anions play prominent roles in the charge compensation processes. Moreover, the loss of electrons of S ions are visibly larger than those of O ions, which is consistent with their electronegativities. Besides, for sulfides (LiCrS2 and NaCrS2), chromium ions even gain a small portion of electrons instead of losing electrons, where the electrons gained by chromium ions are originated from the S-3p band. For the redox reactions involved, they can be understood through the energy levels of oxygen/sulfur ions (as well as chromium ions in the oxides) being pushed towards/cross the Fermi surface due to the strong p–d hybridization. The present work should help understand the cationic and anionic redox processes in these systems.Conflicts of interest
There are no conflicts to declare.Acknowledgements
This work was supported by the National Key R&D Program of China (No. 2016YFA0202601, No. 2016YFB0901502) and the National Natural Science Foundation of China (No. 21761132030, 11874307).References
- P. Moreau, G. Ouvrard, P. Gressier, P. Ganal and J. Rouxel, J. Phys. Chem. Solids, 1996, 57, 1117 CrossRef CAS.
- Z. Wu, G. Ouvrard, S. Lemaux, P. Moreau, P. Gressier, F. Lemoigno and J. Rouxel, Phys. Rev. Lett., 1996, 77, 2101 CrossRef CAS PubMed.
- M. Aydinol, A. Kohan, G. Ceder, K. Cho and J. Joannopoulos, Phys. Rev. B: Condens. Matter Mater. Phys., 1997, 56, 1354 CrossRef CAS.
- J. Tarascon, G. Vaughan, Y. Chabre, L. Seguin, M. Anne, P. Strobel and G. Amatucci, J. Solid State Chem., 1999, 147, 410 CrossRef CAS.
- G. Ceder, Y. M. Chiang, D. Sadoway, M. Aydinol, Y. I. Jang and B. Huang, Nature, 1998, 392, 694 CrossRef CAS.
- W. S. Yoon, K. B. Kim, M. G. Kim, M. K. Lee, H. J. Shin, J. M. Lee, J. S. Lee and C. H. Yo, J. Phys. Chem. B, 2002, 106, 2526 CrossRef CAS.
- L. Dahéron, R. Dedryvere, H. Martinez, M. Ménétrier, C. Denage, C. Delmas and D. Gonbeau, Chem. Mater., 2007, 20, 583 CrossRef.
- D. H. Seo, J. Lee, A. Urban, R. Malik, S. Kang and G. Ceder, Nat. Chem., 2016, 8, 692 CrossRef CAS PubMed.
- Z. Shadike, Y. N. Zhou, L. L. Chen, Q. Wu, J. L. Yue, N. Zhang, X. Q. Yang, L. Gu, X. S. Liu, S. Q. Shi and Z. W. Fu, Nat. Commun., 2017, 8, 566 CrossRef.
- G. X. Feng, L. F. Li, J. Y. Liu, N. Liu, H. Li, X. Q. Yang, X. J. Huang, L. Q. Chen, K. W. Nam and W. S. Yoon, J. Mater. Chem., 2009, 19, 2993 RSC.
- X. Xia and J. R. Dahn, Electrochem. Solid-State Lett., 2012, 15, A1 CrossRef CAS.
- Z. M. Xu, S. H. Bo and H. Zhu, ACS Appl. Mater. Interfaces, 2018, 10, 36941 CrossRef CAS PubMed.
- G. Kresse and D. Joubert, Phys. Rev. B: Condens. Matter Mater. Phys., 1999, 59, 1758 CrossRef CAS.
- G. Kresse and J. Furthmüller, Comput. Mater. Sci., 1996, 6, 15 CrossRef CAS.
- G. Kresse and J. Furthmüller, Phys. Rev. B: Condens. Matter Mater. Phys., 1996, 54, 11169 CrossRef CAS PubMed.
- J. P. Perdew, K. Burke and M. Ernzerhof, Phys. Rev. Lett., 1996, 77, 3865 CrossRef CAS PubMed.
- A. Jain, G. Hautier, S. P. Ong, C. J. Moore, C. C. Fischer, K. A. Persson and G. Ceder, Phys. Rev. B: Condens. Matter Mater. Phys., 2011, 84, 045115 CrossRef.
- H. J. Monkhorst and J. D. Pack, Phys. Rev. B: Solid State, 1976, 13, 5188 CrossRef.
- R. Bader, A Quantum Theory, Clarendon Press, Oxford, 1990 Search PubMed.
- G. Henkelman, A. Arnaldsson and H. Jónsson, Comput. Mater. Sci., 2006, 36, 354 CrossRef.
- Z. Lu and J. R. Dahn, J. Electrochem. Soc., 2002, 149, A1454 CrossRef CAS.
- J. Soubeyroux, D. Fruchart, J. Marmeggi, W. Fitzgerald, C. Delmas and G. Le Flem, Phys. Status Solidi A, 1981, 67, 633 CrossRef CAS.
- B. Van Laar and D. Ijdo, J. Solid State Chem., 1971, 3, 590 CrossRef CAS.
- J. G. White and H. Pinch, Inorg. Chem., 1970, 9, 2581 CrossRef CAS.
- Y. Tsuchiya, K. Takanashi, T. Nishinobo, A. Hokura, M. Yonemura, T. Matsukawa, T. Ishigaki, K. Yamanaka, T. Ohta and N. Yabuuchi, Chem. Mater., 2016, 28, 7006 CrossRef CAS.
- F. Engelsman, G. Wiegers, F. Jellinek and B. Van Laar, J. Solid State Chem., 1973, 6, 574 CrossRef CAS.
- P. Brüesch and C. Schüler, J. Phys. Chem. Solids, 1971, 32, 1025 CrossRef.
- C. Delmas, C. Fouassier and P. Hagenmuller, Physica B+C, 1980, 99, 81 CrossRef CAS.
- M. Chen, Q. Liu, S. W. Wang, E. Wang, X. Guo and S. L. Chou, Adv. Energy Mater., 2019, 9, 1803609 CrossRef.
- F. Badway, N. Pereira, F. Cosandey and G. Amatucci, J. Electrochem. Soc., 2003, 150, A1209 CrossRef CAS.
- S. Q. Wu, N. L. Cai, Z. Z. Zhu and Y. Yang, Electrochim. Acta, 2008, 53, 7915 CrossRef CAS.
- M. Saubanère, E. McCalla, J. M. Tarascon and M. L. Doublet, Energy Environ. Sci., 2016, 9, 984 RSC.
- I. Solovyev, I. Kashin and V. Mazurenko, Phys. Rev. B: Condens. Matter Mater. Phys., 2015, 92, 144407 CrossRef.
| This journal is © The Royal Society of Chemistry 2019 |

