 Open Access Article
Photoresponsive behavior of hydrophilic/hydrophobic-based novel azobenzene mesogens: synthesis, characterization and their application in optical storage devices†
Sunil B. N.ab,
Wan Sinn Yam*c and
Gurumurthy Hegde *a
*a
aCentre for Nano-materials and Displays, B.M.S. College of Engineering, Bull Temple Road, Bengaluru 560019, India. E-mail: murthyhegde@gmail.com
bDepartment of Chemistry, B.M.S. College of Engineering, Bangalore, India 560019
cSchool of Chemical Sciences, Universiti Sains Malaysia, 11800 USM Penang, Malaysia. E-mail: wansinn@usm,my
First published on 6th December 2019
Abstract
Three series of alkoxy chain-bearing azobenzene-derived quaternary ammonium iodides with an alkoxy chain at one end, namely N,N-diethanol-6-(4-((4′-alkyloxyphenyl)diazenyl)phenoxy)hexan-1-ammonium iodides, N-ethyl-N-ethanol-6-(4-((4′-alkyloxyphenyl)diazenyl)phenoxy)hexan-1-ammonium iodides and N,N-diethyl-6-(4-((4′-alkyloxyphenyl)diazenyl)phenoxy)hexan-1-ammonium iodides were synthesized and characterized. Their mesomorphic and photoswitching properties were examined via polarising optical microscopy (POM), differential scanning calorimetry (DSC) and UV-vis spectrophotometry. The liquid crystalline tilted schlieren texture of smectic C, non-tilted natural focal conic texture of smectic A and smectic B phases were observed in the N,N-diethanol- and N-ethyl-N-ethanol-bearing ammonium group substituted at the terminal via the alkoxy chain of the azo moiety. In these azo moieties, the equilibrium time for trans–cis isomerization was about 1 min and cis–trans isomerization occurred at around 590 min, which had the highest alkoxy chain and no hydroxyl group on their head group. The absence of a hydroxyl group on the terminal head group resulted in slow thermal back relaxation, whereas the hydroxyl group-bearing head group showed fast thermal back relaxation. These results suggest that the influence of the substituent on the cationic ammonium head group and alkoxy chain length on the photoisomerization of the azo compounds is vital for optical storage devices. Furthermore, the device fabricated using these materials demonstrated that they are excellent candidates for optical image storage applications.
1 Introduction
Optical storage devices have attracted increasing attention in the field of information technology over the last few years.1–5 Organic photochromic compounds are used to evaluate the photoinduced behaviour of optical storage devices.6,7 This process arises from the reversible photoinduced isomerization of a photochromic group such as azobenzene. The azobenzene chromophore is a good candidate for storing data optically due to its photosensitivity and good photoisomerization properties.8–11 Upon UV illumination (∼365 nm related to the π–π* transition), its thermodynamically more stable rod-like molecular form of E or trans isomer is converted into the bent Z or cis isomer. Reverse cis–trans isomerization can be achieved via illumination under visible light (∼400–500 nm, related to the n–π* transition). This reverse transformation can also occur in the “dark” via a process known as thermal back relaxation.12,13 The decoration of different functional groups on the azobenzene chromophore has been studied to enhance its optical storage properties.14–21Ionic liquids have been developed in the past two decades because of their unique physicochemical properties and highly tunable features with chemical modification.22–25 Thus, it is possible to design functionalized azobenzene-based ionic liquids by introducing quaternary ammonium salts into the photoresponsive unit of azobenzene.26,27 In this context, some azobenzene-based ionic liquids have been designed and used in many applications such as catalysis,28 sensors,29 drug delivery30 and coatings.31 Based on a recent literature survey,32–34 azobenzene-based ionic liquids are rarely used in the field of optical storage devices. In recent years,35–37 some photoresponsive ionic liquids have been reported. The azobenzene-based ionic liquid 4-butylazobenzene-40-hexyloxytrimethyl-ammonium trifluoro-acetate ([C4AzoC6TMA] [TfO]) with an azobenzene unit bridged between the alkyl chain has been synthesized and its reversible micelle-vesicle transformation under UV-vis illumination studied.38 Similarly, the synthesis and reversible transformation of the photoresponsive ionic liquid 1-(4-methyl azobenzene)-3-tetradecylimidazolium bromide ([C14mimAzo] Br) with an azobenzene group were investigated.39 However, to understand the photoresponsive behavior of azobenzene-based ionic liquids, a detailed investigation of this class of azobenzenes with quaternary ammonium salts in other positions of the different functional groups is necessary.
In this work, we designed, synthesized and characterized 3 types of photoresponsive compounds, N,N-diethanol-6-(4-((4′-alkyloxyphenyl)diazenyl)phenoxy)hexan-1-ammonium iodides (hereafter named as compounds 22–24), N-ethyl-N-ethanol-6-(4-((4′-alkyloxyphenyl)diazenyl)phenoxy)hexan-1-ammonium iodides (hereafter named as compounds 25–27) and N,N-diethyl-6-(4-((4′-alkyloxyphenyl)diazenyl)phenoxy)hexan-1-ammonium iodides (hereafter named as compounds 28–30). In the ammonium salts of these ionic liquids, the alkoxy chain is at one end of the azobenzene group (i.e. the azobenzene and head group are bridged by the alkoxy chain, as shown in Fig. 1) and other end has different alkoxy chain lengths. The mesomorphic and photoisomerization behavior modulation of these ionic liquids in solution and in solid through UV light irradiation were investigated via UV-vis spectroscopy. The parameters of the liquid crystalline phase, phase transition temperature, photoisomerization efficiency and thermal back relaxation were determined.
This study provides useful information for creating optical storage devices by understanding the structure–property relationship of azobenzene-based ionic liquids. The photoisomerization and liquid crystalline properties of the intermediates were also studied for a better understanding between them.
2 Results and discussion
2.1 Synthesis
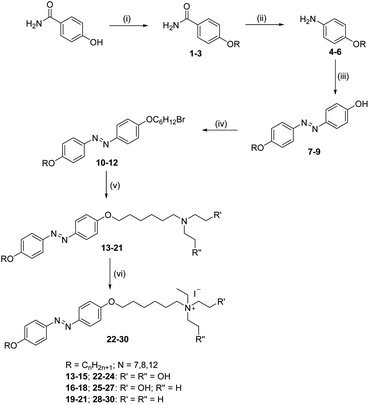
The new azobenzene-based ammonium salts discussed herein were prepared following the procedure in Scheme 1.4-Acetamidophenol was O-alkylated using 1-bromoalkanes to produce 4-acetamidophenoxyalkanes (1–3) and further refluxed with alcoholic sodium hydroxide to give 4-alkyloxyanilines (4–6). The 4-alkyloxyanilines were diazotized with sodium nitrite and conc. HCl at 0 °C and the diazonium solution was treated with phenol in the presence of sodium carbonate to obtain the coupled products 7–9. Compounds 7–9 were treated with 1,6-dibromohexane, and refluxed overnight under a nitrogen atmosphere to obtain compounds 10–12, and then reacted with substituted amines to produce 13–21. Compounds 22–30 were obtained upon treatment with ethyl iodide. The crude product was recrystalized from a mixture of ethanol/n-hexane and characterized using 1H-NMR, 13C-NMR, HRMS and elemental analyses.
2.2 Azobenzene mesogen bearing terminal bromo group via alkoxy chain
The bromo group was substituted at the terminal end (via the alkoxy chain) of azobenzene derivatives 7–8 bearing different alkoxy chain lengths on the other end of the phenyl ring. The bromo group was fixed at one end and the alkoxy chain varied at the other end of compounds 10–12. The push–pull type effect was observed in these types of molecules due to the presence of the bromo group, which acts as an electron withdrawing group, whereas, the alkoxy chain acts as an electron donating group. The influence of the alkoxy chain and bromo group on the mesomorphic and photoswitching properties of the azobenzene chromophore were studied in detail.| Compound code | n | Phase transitions T/°C [ΔH/kJ mol−1] |
|---|---|---|
| a Transition temperatures and enthalpy values were taken from the DSC heating (H) scans at 5 °C min−1; abbreviations: Cr = crystalline solid; SmA = smectic phase A phase; SmB = smectic B phase; SmC = smectic C phase; and Iso = isotropic liquid. | ||
| 10 | 7 | H: Cr 103.80 [54.46] SmA 111.77 [0.92] Iso |
| 11 | 7 | H: Cr 95.69 [50.96] SmC 109.67 (1.90) SmA 113.54 [1.14] Iso |
| 12 | 12 | H: Cr 100.03 [77.0] SmA 112.29 (9.73) Iso |
Fig. 2 shows the natural focal conic texture, which is typical of the SmA phase, exhibited by compounds 10–12 at the respective temperatures. The phase transition temperature and enthalpy changes were determined via differential scanning calorimetry (DSC) upon heating at 5 °C min−1. A summary of the phase transition temperatures, mesophase types and transition enthalpies is given in Table 1. The DSC thermograms are presented in the ESI.†
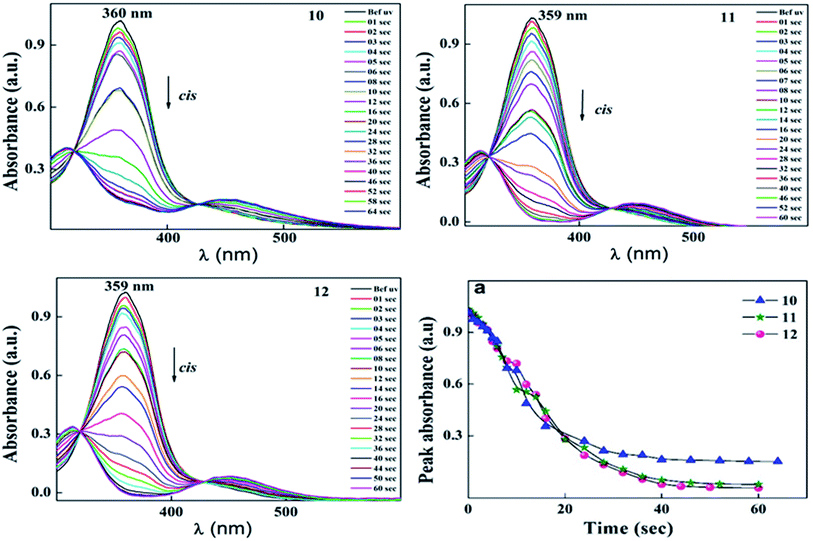
During UV illumination, the typical maximum absorption wavelength at 359 nm disappeared, while a peak appeared at ∼450 nm due to an increase in the content of cis isomer. The isomerisation process of 10 was recorded as a function of UV irradiation time. Compounds 10–12 took around 44 s to reach the photoequilibrium state and upon further continuous irradiation of UV light up to 60 s, there were no changes in their absorption spectra. This suggests the trans isomer reached its equilibrium state of isomerization reaction. After reaching the photostationary state, the thermal back relaxation of the cis–trans isomerization was examined by keeping the samples in the dark. Among them, compound 11 showed a good thermal back relaxation time of about 590 min, whereas, 10 showed a fast back relaxation time of ∼100 min. The normalized absorption spectra upon UV illumination and thermal back relaxation of 10–12 are shown in Fig. 3 and 4, respectively. The peak absorbance graph was plotted as a function of time by extracting data from the absorption spectra of compounds 10–12. Graphs (a and b) (in Fig. 3 and 4, respectively) show the peak absorbance graph of UV illumination and thermal back relaxation of compounds 10–12 with respect to irradiation time and recovery time, respectively.
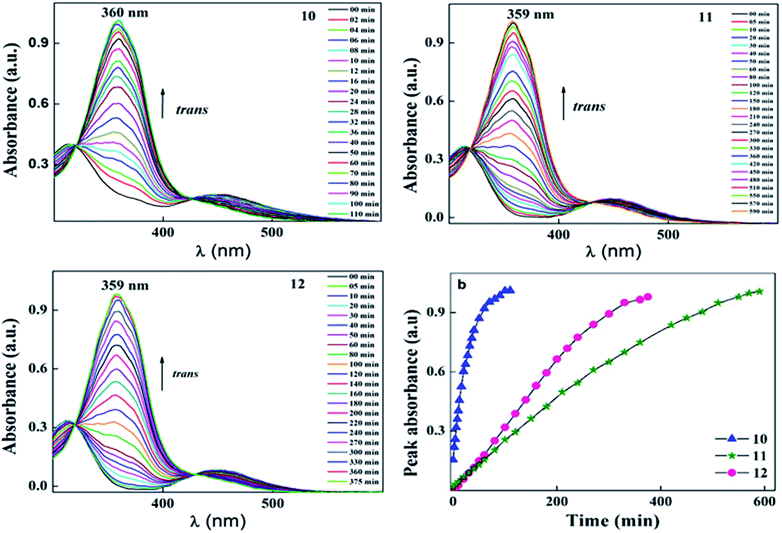 | ||
| Fig. 4 Normalized absorption spectra of compounds 10–12 as a function of recovery time during thermal back relaxation and graph (b) represents the peak absorbance plot for cis–trans isomerization, which was extracted from the absorption spectra (Fig. 4) of 10–12. | ||
For trans–cis isomerization of 10–12, the equilibrium state of the E/Z isomer ratio was dependent on the wavelength. After exposure to a wavelength of 365 nm, conversion efficiency of the trans isomer was around 90%. Considering the case of sample 12, the conversion efficiency of trans–cis isomerization was 99%, whereas, 10 showed 85%. After 40 s UV irradiation, the conversion efficiency of these compounds remained the same. The photoconversion efficiency of the trans–cis isomerisation was determined using eqn (1).40
 | (1) |
| Compound code | trans–cis isomerization in s | Thermal back relaxation in min | CE % |
|---|---|---|---|
| 10 | 44 | 100 | 85.67 |
| 11 | 44 | 590 | 98.25 |
| 12 | 44 | 375 | 99.20 |
2.3 Azobenzene-mesogen bearing a terminal tertiary amine group
The bromo group was replaced by N,N-diethanol, N-ethyl-N-ethanol, and N,N-diethyl containing an amine group at the terminal with the same alkoxy chain length of intermediates 10–12 at one end, and the other end of the azo ring bearing different alkoxy chain lengths. The mesomorphic and photoswitching properties of intermediates 13–21 were investigated here. These types of compounds exhibited a push–push type effect due to the electron donating nature of both groups present in the side chain. The influence of the hydrophobic and hydrophilic nature of the substituted tertiary amine on the mesomorphism and photoisomerization properties were extensively studied.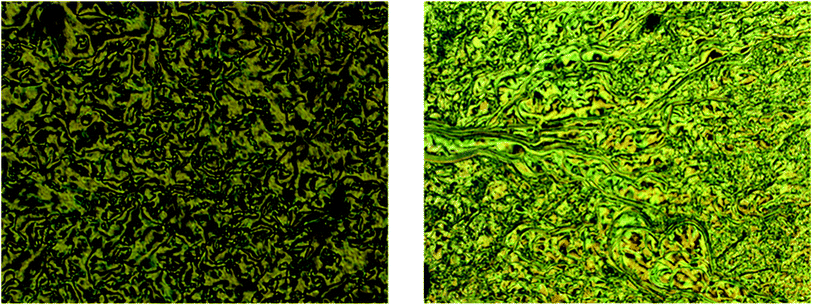 | ||
| Fig. 5 Schlieren texture of SmC phase observed in compound 18 (left) and SmB phase for compound 15 (right) magnification 10×. | ||
A summary of the phase transition temperature and transition enthalpies are given in Table 3. The DSC thermograms for all the compounds are given in the ESI.†
| Compound code | n | R′ | R′′ | Phase transitions T/°C [ΔH/kJ mol−1] |
|---|---|---|---|---|
| a Abbreviations see Table 1. | ||||
| 13 | 7 | –OH | –OH | H: Cr 106.37 [24.18] Iso |
| 14 | 8 | –OH | –OH | H: Cr 107.31 [27.29] Iso |
| 15 | 12 | –OH | –OH | H: Cr 82.92 [21.49] SmC 99.26 [13.82] SmB 115.08 [13.04] Iso |
| 16 | 7 | –OH | –H | H: Cr 73.28 [18.76] Iso |
| 17 | 8 | –OH | –H | H: Cr 74.51 [19.97] Iso |
| 18 | 12 | –OH | –H | H: Cr 87.79 [37.55] SmC 104.46 [4.81] SmA 115.52 [2.72] Iso |
| 19 | 7 | –H | –H | H: Cr 81.72 [16.15] Iso |
| 20 | 8 | –H | –H | H: Cr 79.55 [13.91] Iso |
| 21 | 12 | –H | –H | H: Cr 79.76 [44.32] Iso |
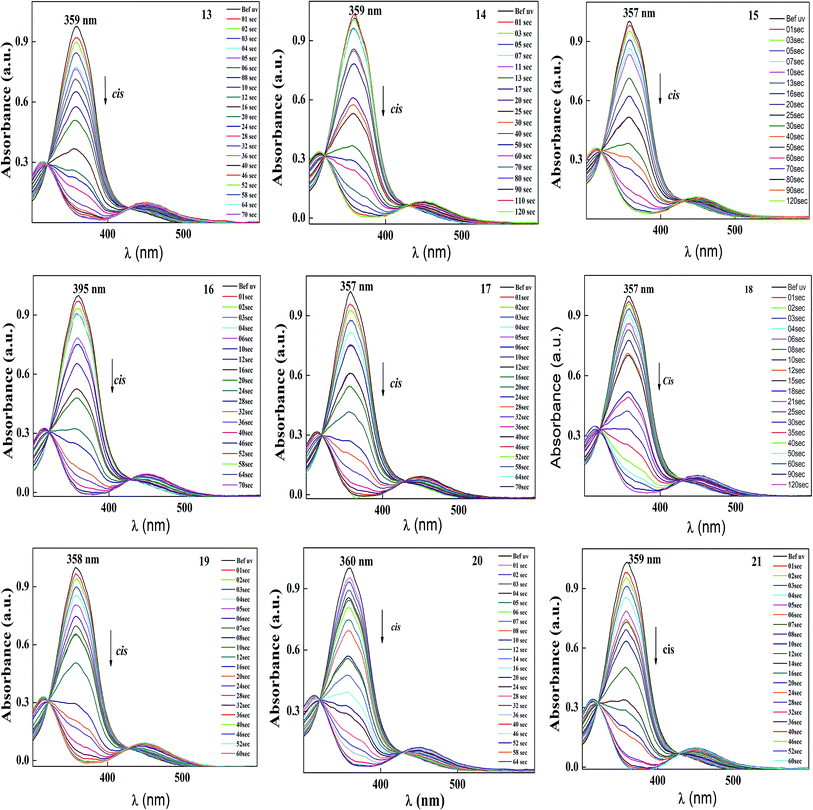 | ||
| Fig. 6 Normalized absorption spectra of compound 13–21 as a function of UV irradiation time. Intensity of the UV illumination is 1 mW cm−2. | ||
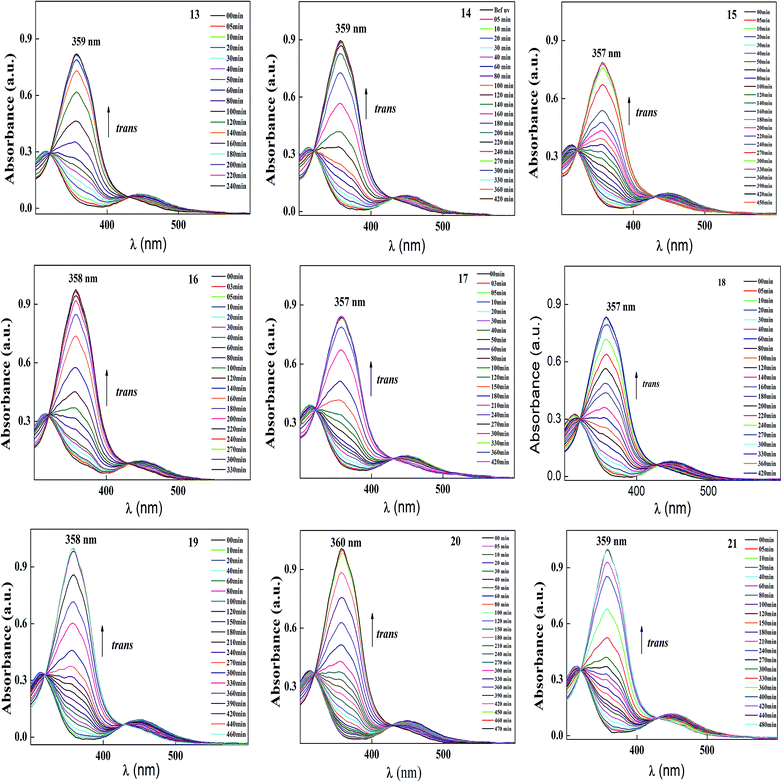 | ||
| Fig. 7 Normalized absorption spectra of compounds 13–21 as a function of recovery time during thermal back relaxation. | ||
 | ||
| Fig. 8 Peak absorbance with respect to time graph (c) peak absorbance plot for trans–cis isomerization, with the data extracted from the absorption spectra (Fig. 6) of 13–21 during UV illumination and graph (d) peak absorbance plot for cis–trans isomerization, with the data extracted from the absorption spectra (Fig. 7) of 13–21 during thermal back relaxation. | ||
| Compound code | E/Z isomerization in s | Thermal back relaxation in min | CE % |
|---|---|---|---|
| 13 | 70 | 180 | 96.00 |
| 14 | 80 | 240 | 96.77 |
| 15 | 85 | 330 | 94.47 |
| 16 | 90 | 240 | 99.49 |
| 17 | 85 | 270 | 98.92 |
| 18 | 56 | 320 | 94.47 |
| 19 | 40 | 440 | 99.82 |
| 20 | 46 | 460 | 95.20 |
| 21 | 52 | 440 | 94.96 |
The photoconversion efficiency of E/Z isomerisation was determined using eqn (1). The photoconversion efficiency of intermediates 13–21 was more than 90%, indicating that the thermally stable trans isomer was converted to the unstable cis isomer to a great extent. In the case of compounds 13–18, conversion of the trans isomer to the cis isomer took more time compared to that for 19–21 due to the presence of a hydroxyl group on the amine group. The intermolecular hydrogen bonding effect of the hydroxyl group increased the equilibrium time for the isomerization reaction.
2.4 Azobenzene mesogen bearing a terminal quaternary ammonium group
Azobenzene is the most efficient and extensively studied chromophore, where azobenzene derivatives with the trans isomer are thermodynamically more stable than that with the cis isomer. In this section, we present the mesomorphic and photoswitching properties of the quaternary ammonium salt bearing alkoxy azobenzene. Generally quaternary ammonium salts are called cationic surfactants, which are prepared by adding an ethyl group to the nitrogen atom of a tertiary amine. Similarly, the quaternary ammonium group-based azobenzene derivatives were prepared by adding an ethyl group to the terminal tertiary amine of intermediates 13–21. The mesomorphic properties and photo-induced isomerization of the azobenzene-based mesogen-bearing cationic surfactants (22–30) were examined in detail.The natural focal conic texture exhibiting the SmA phase of compound 26 and the SmC phase of compound 27 are shown in Fig. 9b and c, respectively. The N,N-diethyl quaternary ammonium salt-based azobenzenes are non-liquid crystalline in nature due to the absence of a hydroxyl group on their head group. Hence, the mesophases changes in their properties may be due to the polar group present in the quaternary ammonium salt. The phase transition temperature and transition enthalpies were determined via DSC and the summarized data given in Table 5.
| Compound code | n | R′ | R′′ | Phase transitions T/°C [ΔH/kJ mol−1] |
|---|---|---|---|---|
| a Abbreviations: see Table 1. | ||||
| 22 | 7 | –OH | –OH | H: Cr 143.04 [38.48] SmA 222.92 [3.57] Iso |
| 23 | 8 | –OH | –OH | H: Cr 141.0 [13.80] SmA 220.92 [2.22] Iso |
| 24 | 12 | –OH | –OH | H: Cr 135.98 [45.11] SmC 132.15 [1.66] SmA 194.17 [3.32] Iso |
| 25 | 7 | –OH | –H | H: Cr 158.09 [42.26] SmA 185.98 [0.91] Iso |
| 26 | 8 | –OH | –H | H: Cr 148.91 [32.42] SmA 199.56 [0.89] Iso |
| 27 | 12 | –OH | –H | H: Cr 52.81 [11.23] SmC 111.71 [6.64] Iso |
| 28 | 7 | –H | –H | H: Cr 81.72 [21.53] Iso |
| 29 | 8 | –H | –H | H: Cr 142.92 [11.98] Iso |
| 30 | 12 | –H | –H | H: Cr 174.19 [29.18] Iso |
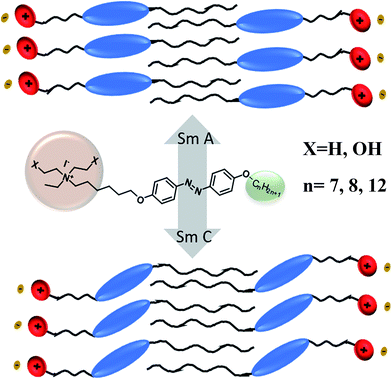
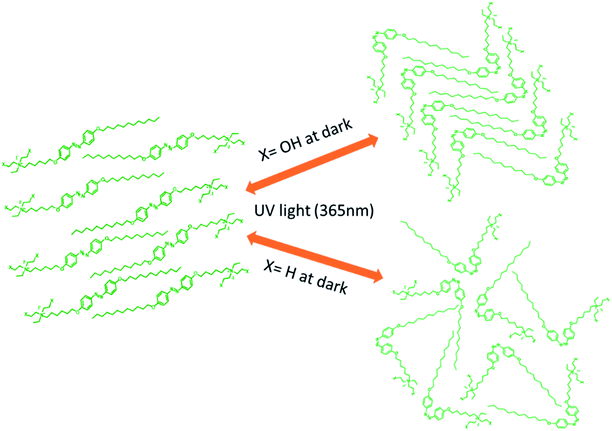
To better understand the mesophases, the proposed model, as shown in Fig. 10 shows the formation of non-tilted smectic A and tilted smectic C phases. The smectic A mesophase was observed in all the compounds bearing a hydroxyl group on their terminal head group. The influence of the terminal alkoxy chain (n > 10) length on the formation of ionic liquid crystals with the smectic C phase was previously reported.41 According to the zigzag model by Wulf,42 the appearance of the smectic C phase occurs by increasing the length of the terminal chain. For compounds 24 and 27, which have the highest chain length at the terminal end (n = 12), evidence was observed for the formation of the smectic C phase and also similar results were observed in the case of compounds 15 and 18. In the case of the substituent X = H on the head group, no liquid crystalline properties were observed because the hydroxyl group plays a major role in the mesomorphism.
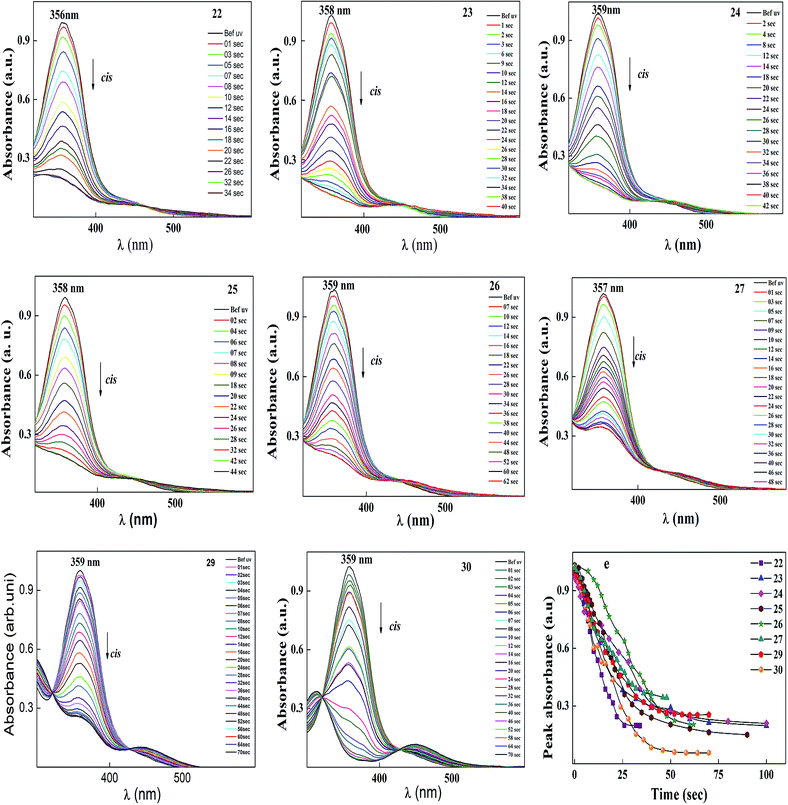
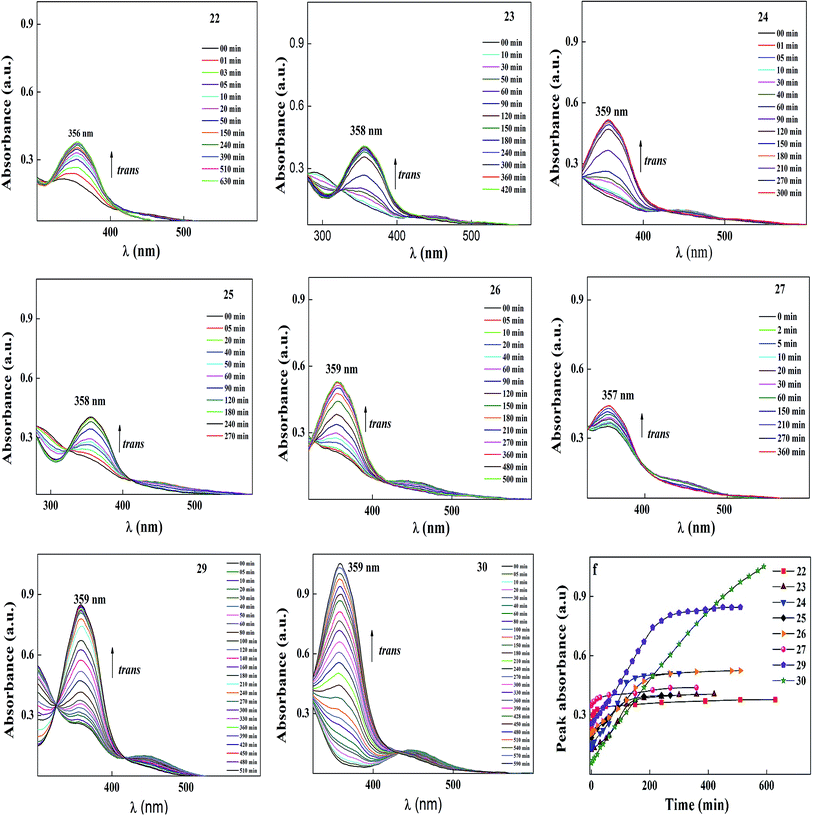
After reaching the photosaturation state, the reverse transformation of the cis isomer occurred in the dark and the thermal back relaxation was recorded with respect to the recovery time of the trans isomer. Similar results were also observed to that of the other compounds, and the normalized absorption spectra of compounds 22–30 are given in Fig. 11. The peak absorbance versus time was plotted by extracting data from the absorption spectra of compounds 22–30 upon UV illumination as shown in graph (e) (see Fig. 11). The photoconversion efficiency for trans–cis isomerization of the azobenzene-based ionic liquids was determined using eqn (1). All the compounds showed good conversion efficiency, suggesting the ionic liquids exhibit quick photoresponsive behaviour in solution. In the case of compound 30, the conversion efficiency was about 94%, whereas, compound 27 showed 66%. The presence of a hydroxyl group on the head group reduced the cis isomer ratio in the photoequilibrium state during photoisomerization. Therefore, the presence of a hydroxyl group and the alkoxy chain length play a significant role in photoisomerization. A summary of the photoconversion efficiency data for the trans–cis isomerization is shown in Table 6.
| Compound code | E/Z isomerization in s | Thermal back relaxation in min | CE % |
|---|---|---|---|
| 22 | 25 | 60 | 80.20 |
| 23 | 32 | 160 | 80.64 |
| 24 | 46 | 210 | 77.42 |
| 25 | 32 | 140 | 85.43 |
| 26 | 48 | 240 | 80.33 |
| 27 | 36 | 270 | 66.18 |
| 29 | 44 | 390 | 74.55 |
| 30 | 46 | 590 | 94.43 |
Among all the compounds, 30 showed the best thermal back relaxation time of about 590 min, whereas, the cis isomer of compound 22 was not fully transformed into the trans isomer. The terminal head group of the azobenzene unit acts as an electron withdrawing group, which can reduce the isomerization energy barrier and accelerate the isomerization of azobenzene. However, in the case of 22, the presence of a hydroxyl group reduced the electron withdrawing character of the head group. As a result, the cis isomer was not fully converted into its original state and also could be phase involved during thermal back relaxation due to the molecules being arranged in an ordered layer structure (smectic phase). Furthermore, the normalized absorption spectra for the thermal back relaxation of the azobenzene-based ionic liquids were investigated in detail (Fig. 12). According to Fig. 12, after the photoequilibrium state, the cis isomer of 22–27 did not fully transform back to its original state due to the formation of intermolecular hydrogen bonding in the hydroxyl group present on its head group.
A schematic diagram of the light-induced photoisomerization of the azo compounds is shown in Fig. 13. The polar substituent (X = OH) on the head group of the azo compounds of the cis isomer could not achieve its original state due to the layered arrangement of molecules (smectic A phase) restricting the free rotation of the molecule during thermal back relaxation. In the case of 29 and 30, they possess random arrangements due to the absence of a hydroxyl group on their head group and they exhibited long thermal back relaxation.
2.5 Kinetic studies
For azo compounds 10–30, it is necessary to study the kinetics of their cis–trans isomerisation, which was carried out thermally using UV-vis spectroscopy.43 The experiment was carried out in the dark at room temperature of 27 °C and chloroform was used as the solvent. The unimolecular thermal cis–trans isomerisation in the dark obeys eqn (2).
 | (2) |
 | ||
| Fig. 14 First-order plot for the thermal back relaxation of compounds 10–30 measured at room temperature. | ||
In the case of compounds 22–30, most of the reaction is first order except for compound 30, which exhibited a push–pull-type effect due to the head group of the ionic liquid acting as an electron withdrawing group. In the case of 22–27, the reaction was first order due to the presence of a hydroxyl group exhibiting the pull–pull-type effect, which could not reduce the isomerization energy barrier and the acceleration of the isomerization of azobenzene was negligible.
2.6 Optical storage device
Spectral investigation on a real device was also conducted to determine the potential of the materials. Fabrication of the cell involved ITO coated, polyimide rubbed sandwiched glass plates with the desired thickness of around ∼5 μm. The guest–host mixture was prepared, where azobenzene molecules acted as the guest and the room temperature liquid crystal acted as the host material.As a representative compound, we took compound 30 as our guest light sensitive molecules since it showed the best properties during the photoisomerization studies. The mixture consisted of 5% of compound 30 (which is a light-sensitive molecule but non-liquid crystalline in nature) mixed with 95% MLC-6873-100 (room temperature commercial liquid crystal). This mixture exhibited a room temperature nematic mesophase. The prepared mixture was capillary filled in a cell, which was previously fabricated.
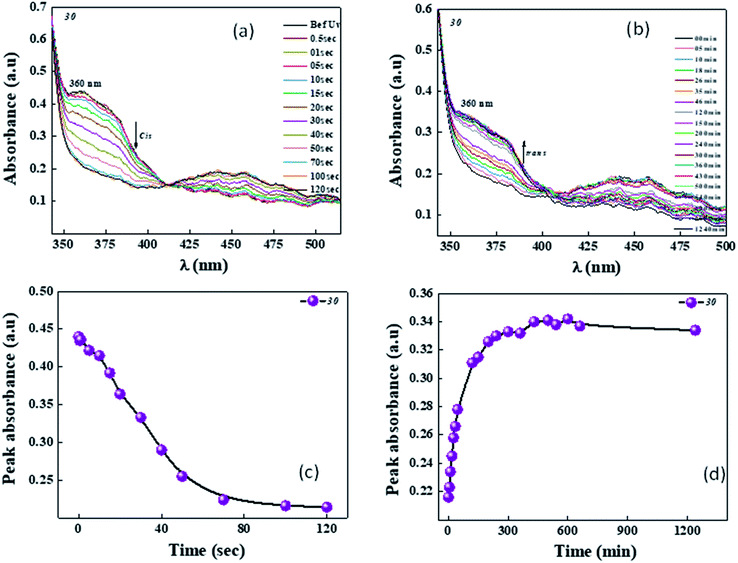
The E/Z and Z/E photoisomerization behaviour of the solid cell is depicted in Fig. 15. The intensity used for achieving photosaturation was around 1.2 mW cm−2 and it took ∼80 s to reach the photosaturation state (Fig. 15a and b). In contrast, back relaxation, which occurred in the absence of light, took around ∼400 min to reach the original position (Fig. 15c and d).
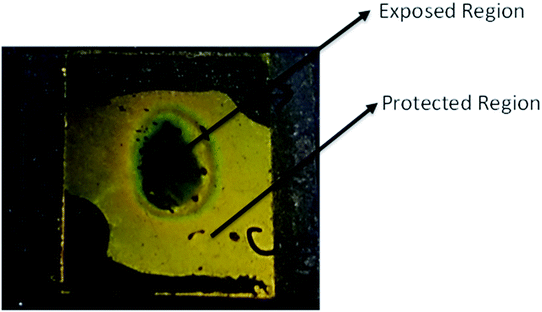
To see the effect of thermal back relaxation, we fabricated an optical storage device with the above mixture. Previously prepared ITO coated, unidirectionally rubbed polyimide layers were sandwiched between two glass plates with a uniform thickness of ∼5 μm. The device, as depicted in Fig. 16, showed bright and dark regions after illumination with UV light of intensity 1.2 mW cm−2 for 10 min using suitable masks. As can be seen from the figure, the exposed region where UV light is illuminated transforms from an ordered nematic state to a disordered isotropic state (black region), whereas the masked region remains in the nematic phase (bright region). To transfer back to the original nematic phase from the isotropic phase, the device took around 250 min, showing the potential of the optical rewriting capabilities of the materials.
2.7 Proposed model for guest–host effect
When UV light of 365 nm was illuminated on the composite mixture of azobenzene and liquid crystal molecules, the energetically stable trans isomer (order state) transformed to the cis-isomer (disorder state). The guest-host effect of azobenzene and liquid crystal molecules is schematically depicted Fig. 17, which shows that the reverse transformation of the cis isomer is not easy to reach its original state due to the presence of hydrophobic and hydrophilic head groups on the azo molecules.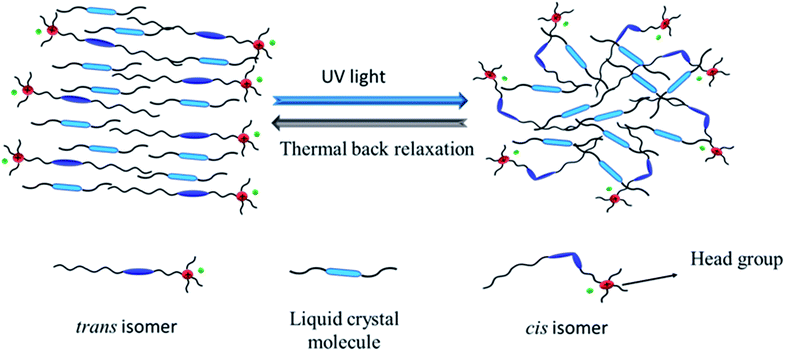 | ||
| Fig. 17 Schematic diagram of the guest–host effect of the azobenzene-based ionic liquid and liquid crystal molecules. | ||
3 Experimental
3.1 Materials and methods
N,N-Dimethylethanolamine (99%), ethanol (99.9%), ethyl iodide (98%), 2-propanol (99%), HCl conc. (35%), NaNO2 (99%), phenol (98%) K2CO3 (99.5%), Na2CO3 (99.5%), NaOH (98%), 1-bromododecane (99%), 1-bromoheptane (99%), 1-bromooctane (99%) and 1,6-dibromohexane (99%) were purchased from Acros Organics and used without further purification. Petroleum ether (b.p. 60–90 °C), acetonitrile (99.9%), dichloromethane (99.9%), acetone (99%) and ethyl acetate (99%) were commercial products obtained from Acros Organics. 1H NMR (400 MHz) and 13C NMR (100 MHz) were recorded on a Bruker 400 MHz Ultrashield™ spectrometer. Elemental analysis was performed using a CHN elemental analyser.![[thin space (1/6-em)]](https://www.rsc.org/images/entities/char_2009.gif) :
:![[thin space (1/6-em)]](https://www.rsc.org/images/entities/char_2009.gif) 70) to yield compounds 1–3.
70) to yield compounds 1–3.(1) (n = 7) yield: 71.5%. 1H NMR (400 MHz, CDCl3) δ/ppm 7.38–7.32 (m, 2H), 7.13 (s, 1H), 6.88–6.80 (m, 2H), 3.96–3.88 (m, 2H), 2.14 (s, 3H), 1.80–1.69 (m, 2H), 1.43 (dt, J = 15.1, 6.6 Hz, 2H), 1.33 (ddd, J = 15.0, 8.6, 4.6 Hz, 6H), 0.88 (t, J = 6.9 Hz, 3H).
(2) (n = 8) yield: 68.82%. 1H NMR (400 MHz, CDCl3) δ/ppm 7.39–7.33 (m, 2H), 6.89–6.78 (m, 2H), 3.97–3.84 (m, 2H), 1.81–1.68 (m, 2H), 1.49–1.37 (m, 2H), 1.37–1.20 (m, 8H), 0.87 (t, J = 6.9 Hz, 3H).
(3) (n = 12) yield: 83.5% 1H NMR (400 MHz, CDCl3) δ/ppm 7.37–7.31 (m, 2H), 7.12 (s, 1H), 6.86–6.82 (m, 2H), 3.98–3.88 (m, 2H), 2.14 (s, 3H), 1.81–1.67 (m, 2H), 1.49–1.38 (m, 2H), 1.38–1.22 (m, 17H), 0.87 (t, J = 6.9 Hz, 3H).
(4) (n = 7) yield: 1H NMR (400 MHz, CDCl3) δ/ppm 6.76–6.69 (m, 2H), 6.66–6.58 (m, 2H), 4.06 (t, J = 6.6 Hz, 2H), 1.73 (m, 2H), 1.45–1.36 (m, 2H), 1.36–1.22 (m, 6H), 0.88 (t, J = 6.9 Hz, 3H).
(5) (n = 8) yield: 80%. 1H NMR (400 MHz, CDCl3) δ/ppm 6.76–6.70 (m, 2H), 6.65–6.60 (m, 2H), 4.04 (t, J = 6.6 Hz, 2H), 1.74 (m, 2H), 1.43 (m, 2H), 1.30–1.26 (m, 8H), 0.87 (t, J = 6.9 Hz, 3H).
(6) (n = 12) yield: 70%.1H NMR (400 MHz, CDCl3) δ/ppm 6.76–6.70 (m, 2H), 6.65–6.59 (m, 2H), 4.06 (t, J = 6.6 Hz, 2H), 1.74 (m, 2H), 1.43 (m, 2H), 1.29–1.26 (m, 16H), 0.87 (t, J = 6.9 Hz, 3H).
(7) (n = 7) yield: 1H NMR (400 MHz, CDCl3) δ/ppm 7.87–7.77 (m, 4H), 7.01–6.85 (m, 4H), 4.02 (t, J = 6.6 Hz, 2H), 1.87–1.75 (m, 2H), 1.47 (dt, J = 14.6, 6.7 Hz, 2H), 1.40–1.23 (m, 6H), 0.89 (t, J = 6.9 Hz, 3H).
(8) (n = 8) yield: 47%. 1H NMR (400 MHz, CDCl3) δ/ppm 7.88–7.78 (m, 4H), 7.01–6.95 (m, 2H), 6.95–6.88 (m, 2H), 5.04 (s, 1H), 4.02 (t, J = 6.6 Hz, 2H), 1.86–1.74 (m, 2H), 1.51–1.41 (m, 2H), 1.41–1.22 (m, 8H), 0.88 (t, J = 6.9 Hz, 3H).
(9) (n = 12) yield: 73.5%. 400 MHz, CDCl3) δ/ppm 7.87–7.79 (m, 2H), 7.00–6.96 (m, 1H), 6.95–6.91 (m, 1H), 4.02 (t, J = 6.6 Hz, 1H), 1.85–1.76 (m, 1H), 1.46 (dd, J = 15.4, 7.0 Hz, 1H), 1.26 (s, 9H), 0.87 (t, J = 6.9 Hz, 2H).
(10) (n = 7) yield: 1H NMR (400 MHz, CDCl3) δ/ppm 7.89–7.81 (m, 4H), 7.01–6.94 (m, 4H), 4.03 (td, J = 6.5, 3.9 Hz, 4H), 3.43 (t, J = 6.8 Hz, 2H), 1.95–1.85 (m, 3H), 1.86–1.75 (m, 4H), 1.50–1.41 (m, 2H), 1.33 (ddd, J = 11.3, 10.4, 5.2 Hz, 6H), 0.89 (dd, J = 9.0, 4.8 Hz, 3H).
(11) (n = 8) yield: 77.5%. 1H NMR (400 MHz, CDCl3) δ/ppm 7.88–7.82 (m, 4H), 6.98 (dd, J = 9.0, 1.0 Hz, 4H), 4.02 (td, J = 6.5, 4.5 Hz, 4H), 3.42 (q, J = 6.4 Hz, 2H), 1.90 (dd, J = 13.9, 7.0 Hz, 2H), 1.86–1.71 (m, 4H), 1.51 (dd, J = 9.8, 6.2 Hz, 3H), 1.48–1.40 (m, 2H), 1.26 (s, 16H), 0.87 (t, J = 6.8 Hz, 3H).
(12) (n = 12) yield: 50%. 1H NMR (400 MHz, CDCl3) δ/ppm 7.88–7.82 (m, 4H), 6.98 (dd, J = 9.0, 1.0 Hz, 4H), 4.02 (td, J = 6.5, 4.5 Hz, 4H), 3.42 (q, J = 6.4 Hz, 2H), 1.90 (dd, J = 13.9, 7.0 Hz, 2H), 1.86–1.71 (m, 4H), 1.51 (dd, J = 9.8, 6.2 Hz, 3H), 1.48–1.40 (m, 2H), 1.26 (s, 16H), 0.87 (t, J = 6.8 Hz, 3H).
(13) (n = 7) yield: 73.02%. 1H NMR (400 MHz, CDCl3) δ/ppm 7.87–7.81 (m, 4H), 6.98 (t, J = 5.9 Hz, 4H), 4.05–3.98 (m, 4H), 3.66–3.57 (m, 4H), 2.66 (t, J = 5.4 Hz, 4H), 2.57–2.50 (m, 2H), 1.86–1.74 (m, 6H), 1.56–1.42 (m, 6H), 1.42–1.20 (m, 9H), 0.88 (q, J = 7.0 Hz, 3H).
(14) (n = 8) yield: 73.8%. 1H NMR (400 MHz, CDCl3) δ/ppm 7.88–7.81 (m, 4H), 6.98 (t, J = 6.0 Hz, 4H), 4.05–3.99 (m, 4H), 3.62 (t, J = 5.4 Hz, 4H), 2.67 (t, J = 5.4 Hz, 4H), 2.54 (d, J = 7.5 Hz, 2H), 1.80 (dt, J = 14.6, 5.2 Hz, 5H), 1.49 (dd, J = 13.5, 6.4 Hz, 6H), 1.41–1.23 (m, 11H), 0.88 (t, J = 6.9 Hz, 3H).
(15) (n = 12) yield: 52.6%. 1H NMR (400 MHz, CDCl3) δ/ppm 7.87–7.82 (m, 4H), 6.98 (d, J = 9.0 Hz, 4H), 4.02 (td, J = 6.5, 1.9 Hz, 4H), 3.62 (td, J = 5.4, 2.9 Hz, 4H), 2.66 (dd, J = 9.8, 4.5 Hz, 4H), 2.57–2.51 (m, 2H), 1.80 (dd, J = 16.8, 9.0 Hz, 7H), 1.55–1.41 (m, 7H), 1.36 (dd, J = 20.2, 11.4 Hz, 5H), 1.26 (s, 15H), 0.86 (d, J = 7.0 Hz, 3H).
(16) (n = 7) yield: 64.6%.1H NMR (400 MHz, CDCl3) δ/ppm 7.86–7.81 (m, 4H), 6.98 (dd, J = 6.9, 5.0 Hz, 4H), 4.02 (t, J = 6.6 Hz, 4H), 3.55–3.51 (m, 2H), 2.60–2.52 (m, 4H), 2.49–2.44 (m, 2H), 1.85–1.77 (m, 4H), 1.53–1.41 (m, 7H), 1.42–1.25 (m, 10H), 1.04–0.99 (m, 3H), 0.90–0.85 (m, 3H).
(17) (n = 8) yield: 52.9%. 1H NMR (400 MHz, CDCl3) δ/ppm 7.84 (t, J = 9.0 Hz, 4H), 6.96 (t, J = 9.0 Hz, 4H), 4.02 (t, J = 6.2 Hz, 4H), 3.53 (t, J = 5.4 Hz, 2H), 2.61–2.51 (m, 4H), 2.49–2.43 (m, 2H), 1.86–1.76 (m, 4H), 1.54–1.42 (m, 6H), 1.41–1.23 (m, 10H), 1.01 (t, J = 7.1 Hz, 3H), 0.88 (t, J = 6.8 Hz, 3H).
(18) (n = 9) yield: 61.3%. 1H NMR (400 MHz, CHLOROFORM-D) δ 7.88–7.82 (m, 15H), 7.01–6.95 (m, 15H), 4.06–3.99 (m, 15H), 3.53 (t, J = 5.4 Hz, 8H), 2.60–2.52 (m, 17H), 2.49–2.44 (m, 8H), 1.81 (dd, J = 13.2, 6.1 Hz, 16H), 1.53–1.42 (m, 26H), 1.42–1.33 (m, 17H), 1.26 (s, 52H), 1.05–0.98 (m, 11H), 0.87 (t, J = 6.9 Hz, 11H).
(19) (n = 7) yield: 60%. 1H NMR (400 MHz, CDCl3) δ/ppm 7.88–7.82 (m, 4H), 7.00–6.95 (m, 4H), 4.02 (t, J = 6.5 Hz, 4H), 2.53 (q, J = 7.1 Hz, 4H), 2.46–2.40 (m, 2H), 1.80 (dt, J = 14.9, 5.5 Hz, 4H), 1.49 (dd, J = 12.9, 5.5 Hz, 7H), 1.41–1.27 (m, 9H), 1.02 (t, J = 7.2 Hz, 6H), 0.89 (t, J = 6.9 Hz, 3H).
(20) (n = 8) yield: 93.5%. 7.86–7.82 (m, 4H), 7.00–6.93 (m, 4H), 4.01 (t, J = 6.5 Hz, 4H), 2.52 (q, J = 7.1 Hz, 4H), 2.44–2.40 (m, 2H), 1.78 (dt, J = 14.9, 5.5 Hz, 4H), 1.47 (dd, J = 12.9, 5.5 Hz, 10H), 1.41–1.27 (m, 10H), 1.02 (t, J = 7.2 Hz, 6H), 0.89 (t, J = 6.9 Hz, 3H).
(21) (n = 12) yield: 85.71%. 1H NMR (400 MHz, CDCl3) δ/ppm 7.85 (d, J = 8.9 Hz, 4H), 6.97 (d, J = 9.1 Hz, 4H), 4.02 (t, J = 5.9 Hz, 4H), 2.52 (dd, J = 14.4, 7.2 Hz, 4H), 2.45–2.39 (m, 2H), 1.81 (dd, J = 13.6, 7.0 Hz, 5H), 1.53–1.43 (m, 7H), 1.31 (d, J = 40.8 Hz, 20H), 1.02 (t, J = 7.2 Hz, 6H), 0.87 (t, J = 6.7 Hz, 3H).
(22) (n = 7) yield: 30.8%. Elemental analysis: calculated for C31H50IN3O4: C = 56.79, H = 7.69, N = 6.41; found: C = 56.184, H = 7.601, N = 6.327. HRMS [C31H50N3O4]+ = 528.3802. 1H NMR (400 MHz, CDCl3) δ/ppm 7.86–7.81 (m, 16H), 6.97 (ddd, J = 6.9, 5.0, 2.6 Hz, 16H), 4.10 (s, 16H), 4.05–3.98 (m, 25H), 3.68–3.63 (m, 15H), 3.57 (q, J = 7.1 Hz, 8H), 3.48–3.41 (m, 8H), 1.80 (dt, J = 8.0, 6.5 Hz, 17H), 1.60–1.51 (m, 10H), 1.50–1.39 (m, 18H), 1.39–1.25 (m, 40H), 0.90–0.86 (m, 12H). 13C NMR (101 MHz, CDCl3) δ/ppm 161.34, 161.07, 146.94, 124.74 (d, J = 8.0 Hz), 124.41, 124.04, 123.71, 115.06–114.54, 114.40 (d, J = 8.1 Hz), 110.98 (d, J = 1.4 Hz), 103.65 (s), 89.59 (d, J = 3.2 Hz), 83.33 (d, J = 12.1 Hz), 82.92 (s), 82.53 (s), 82.15 (s), 82.03–81.83, 81.60, 81.37–81.16, 80.95 (dd, J = 14.1, 9.8 Hz), 80.71, 80.24 (d, J = 7.7 Hz), 79.85 (dd, J = 16.6, 7.4 Hz), 79.09 (s), 78.86–77.71 (m), 77.73–77.71 (m), 77.38 (d, J = 11.9 Hz), 77.12, 76.41 (d, J = 77.7 Hz), 75.09 (d, J = 17.3 Hz), 74.72, 74.61–74.09, 73.87–73.45, 73.30 (d, J = 6.8 Hz), 72.84 (s), 71.45 (s), 68.48 (d, J = 10.6 Hz), 67.97 (d, J = 13.3 Hz), 66.34 (s), 65.04 (d, J = 14.4 Hz), 60.69 (d, J = 7.2 Hz), 59.93 (s), 56.00 (s), 55.53 (d, J = 17.3 Hz), 53.69–53.28, 41.42 (d, J = 1.4 Hz), 40.45 (d, J = 5.3 Hz), 39.54–39.25, 32.31–31.75, 31.12 (d, J = 19.6 Hz), 29.75, 29.50–28.77, 26.37–25.47, 24.73, 22.85–22.45, 21.88 (d, J = 52.8 Hz), 14.56, 14.17, 8.41 (d, J = 11.6 Hz), 4.12 (dd, J = 28.5, 9.0 Hz), −20.92 to −21.26.
(23) (n = 8) yield: 40.0%. Elemental analysis: calculated for C32H52IN3O4: C = 57.39, H = 7.83, N = 6.27; found: C = 57.019, H = 7.707, N = 6.175. HRMS [C32H52N3O4]+ = 542.3959. 1H NMR (400 MHz, CDCl3) δ/ppm 7.84 (d, J = 8.9 Hz, 6H), 7.00–6.94 (m, 6H), 4.10 (s, 8H), 4.01 (q, J = 6.5 Hz, 6H), 3.66 (s, 6H), 3.57 (dd, J = 14.2, 6.9 Hz, 3H), 3.48–3.41 (m, 4H), 1.80 (dd, J = 14.2, 7.1 Hz, 6H), 1.76–1.70 (m, 4H), 1.55 (d, J = 7.2 Hz, 4H), 1.45 (d, J = 7.2 Hz, 7H), 1.32 (dd, J = 18.5, 11.3 Hz, 17H), 0.87 (dd, J = 9.2, 4.5 Hz, 4H). 13C NMR (101 MHz, CDCl3) δ/ppm 161.35 (s), 161.08 (s), 146.93 (d, J = 13.1 Hz), 124.42 (s), 114.82 (d, J = 11.1 Hz), 77.45 (s), 77.13 (s), 76.81 (s), 68.43 (s), 68.04 (s), 60.64 (s), 59.94 (s), 56.00 (s), 55.60 (s), 31.90 (s), 29.55–29.20 (m), 29.03 (s), 26.10 (s), 25.67 (s), 22.69 (d, J = 10.1 Hz), 22.15 (s), 14.20 (s), 8.49 (s).
(24) (n = 12) yield: 36.8%. Elemental analysis: calculated for C36H60IN3O4: C = 59.58, H = 8.33, N = 5.79; found: C = 59.39, H = 8.25, N = 5.709. HRMS [C36H60N3O4]+ = 598.4585. 1H NMR (400 MHz, CDCl3) δ/ppm 7.84 (dd, J = 9.0, 0.7 Hz, 16H), 7.00–6.94 (m, 16H), 4.11 (s, 16H), 4.01 (dd, J = 14.2, 6.5 Hz, 20H), 3.67 (d, J = 3.1 Hz, 15H), 3.58 (q, J = 7.2 Hz, 8H), 3.49–3.42 (m, 8H), 1.86–1.76 (m, 17H), 1.72 (dd, J = 16.3, 9.4 Hz, 10H), 1.45 (dt, J = 14.1, 7.2 Hz, 19H), 1.34 (t, J = 7.2 Hz, 25H), 1.27 (d, J = 13.8 Hz, 57H), 0.87 (t, J = 6.9 Hz, 12H). 13C NMR (101 MHz, CDCl3) δ/ppm 161.35, 161.05, 146.97 (d, J = 14.8 Hz), 124.4, 114.81 (d, J = 9.0 Hz), 77.43, 77.11, 76.79, 68.43, 67.98, 60.69, 59.96, 55.97, 55.68, 53.52, 32.00, 31.02, 29.86–29.17, 29.02, 26.11, 25.69, 22.77, 22.15, 14.21, 8.39.
(25) (n = 7) yield: 60.0%. Elemental analysis: calculated for C31H50IN3O3: C = 58.21, H = 7.88, N = 6.57; found: C = 57.724, H = 7.802, N = 6.302. HRMS [C31H50N3O3]+ = 512.3839. 1H NMR (400 MHz, CDCl3) δ/ppm 7.84 (dd, J = 9.0, 0.7 Hz, 4H), 7.01–6.94 (m, 4H), 4.36 (t, J = 6.0 Hz, 1H), 4.12 (s, 2H), 4.02 (dt, J = 9.4, 6.4 Hz, 4H), 3.58–3.47 (m, 6H), 3.43–3.36 (m, 2H), 1.88–1.70 (m, 6H), 1.63–1.53 (m, 4H), 1.47 (td, J = 14.3, 7.1 Hz, 4H), 1.36 (t, J = 7.1 Hz, 7H), 1.33–1.27 (m, 4H), 0.89 (t, J = 6.9 Hz, 3H). 13C NMR (101 MHz, CDCl3) δ/ppm 161.34, 161.06, 146.96 (d, J = 12.7 Hz), 124.40, 114.81 (d, J = 7.5 Hz), 100.00, 77.48, 77.16, 76.84, 75.37, 68.43, 67.97, 59.56, 58.88, 55.35, 54.80, 31.85, 29.15 (t, J = 13.9 Hz), 26.12 (d, J = 12.5 Hz), 25.70, 22.64 (d, J = 7.9 Hz), 22.21, 14.17, 8.37.
(26) (n = 8) yield: 62.5%. Elemental analysis: calculated for C31H50IN3O4: C = 58.80, H = 8.02, N = 6.43; found: C = 58.435, H = 7.919, N = 6.287. HRMS [C32H52N3O3]+ = 526.4027. Yield: 1H NMR (400 MHz, CDCl3) δ/ppm 7.84 (d, J = 8.7 Hz, 4H), 6.97 (dd, J = 9.0, 2.2 Hz, 4H), 4.36 (t, J = 6.0 Hz, 1H), 4.12 (s, 2H), 4.02 (dt, J = 9.6, 6.4 Hz, 4H), 3.55 (d, J = 8.7 Hz, 2H), 3.53–3.45 (m, 3H), 3.43–3.34 (m, 2H), 1.89–1.68 (m, 6H), 1.60–1.53 (m, 2H), 1.53–1.41 (m, 4H), 1.35 (t, J = 7.2 Hz, 7H), 1.29 (d, J = 9.4 Hz, 5H), 0.88 (t, J = 6.8 Hz, 3H). 13C NMR (101 MHz, CDCl3) δ/ppm 161.35 (d, J = 2.4 Hz), 161.07 (s), 146.92 (d, J = 11.9 Hz), 124.72–124.08, 122.78 (d, J = 14.1 Hz), 114.66 (dd, J = 29.2, 10.1 Hz), 77.47 (d, J = 11.1 Hz), 77.21, 76.89, 68.43, 68.00, 59.51, 58.85, 55.33, 54.81, 32.01–31.67, 29.55–29.18, 29.01, 26.35–25.94, 25.67, 22.87–22.57 (m), 22.19, 14.18, 8.41.
(27) (n = 12) yield: 20.8%. Elemental analysis: calculated for C36H60IN3O3: C = 60.92, H = 8.52, N = 5.92; found: C = 58.221, H = 8.095, N = 5.558. HRMS [C36H60N3O3]+ = 582.4630. 1H NMR (400 MHz, CDCl3) δ/ppm 7.84 (dd, J = 8.9, 0.7 Hz, 9H), 7.00–6.94 (m, 9H), 4.26 (t, J = 5.8 Hz, 2H), 4.14 (s, 4H), 4.03 (tt, J = 11.3, 5.9 Hz, 10H), 3.58–3.45 (m, 12H), 3.42–3.34 (m, 4H), 1.87–1.69 (m, 14H), 1.53–1.40 (m, 12H), 1.35 (t, J = 7.2 Hz, 17H), 1.32–1.19 (m, 36H), 0.86 (t, J = 6.8 Hz, 7H).
(28) (n = 7) yield: 15.0%. Elemental analysis: calculated for C31H50IN3O2: C = 59.70, H = 8.08, N = 6.74; found: C = 58.677, H = 7.889, N = 6.432. HRMS [C31H50N3O2]+ = 496.3918. 1H NMR (400 MHz, CDCl3) δ/ppm 7.85 (d, J = 8.8 Hz, 7H), 6.97 (d, J = 8.9 Hz, 7H), 4.08–3.99 (m, 7H), 3.45 (q, J = 7.3 Hz, 10H), 3.33–3.27 (m, 4H), 1.89–1.71 (m, 11H), 1.59 (s, 19H), 1.55–1.49 (m, 4H), 1.45 (dd, J = 15.3, 7.5 Hz, 4H), 1.39 (t, J = 7.2 Hz, 16H), 1.31 (s, 7H), 0.89 (t, J = 6.9 Hz, 5H). 13C NMR (101 MHz, CDCl3) δ/ppm 161.34 (s), 161.03 (s), 146.99 (d, J = 13.7 Hz), 124.41 (s), 114.80 (d, J = 5.7 Hz), 77.45 (s), 77.13 (s), 76.81 (s), 68.44 (s), 67.94 (s), 53.91 (s), 31.85 (s), 29.39–28.87 (m), 26.29 (s), 26.06 (s), 25.77 (s), 22.65 (d, J = 7.1 Hz), 22.31 (s), 14.18 (s), 8.44 (s).
(29) (n = 8) yield: 48.0%. Elemental analysis: calculated for C32H52IN3O2: C = 60.27, H = 8.22, N = 6.59; found: C = 59.338, H = 8.039, N = 6.273. HRMS [C32H52N3O2]+ = 510.4064. 1H NMR (400 MHz, CDCl3) δ/ppm 7.84 (d, J = 8.5 Hz, 8H), 6.97 (dd, J = 9.0, 1.3 Hz, 8H), 4.02 (dt, J = 13.0, 6.4 Hz, 8H), 3.44 (q, J = 7.3 Hz, 11H), 3.33–3.26 (m, 4H), 1.88–1.71 (m, 12H), 1.70–1.55 (m, 13H), 1.55–1.41 (m, 9H), 1.38 (t, J = 7.2 Hz, 17H), 1.30 (dt, J = 16.8, 10.5 Hz, 14H), 0.88 (dd, J = 8.6, 5.2 Hz, 6H). 13C NMR (101 MHz, CDCl3) δ/ppm 161.33, 161.03, 146.97 (d, J = 12.8 Hz), 124.39, 114.80 (d, J = 5.8 Hz), 77.47, 77.15, 76.83, 68.44, 67.95, 57.81, 53.88, 31.88, 29.37 (d, J = 12.8 Hz), 29.01, 26.19 (d, J = 17.3 Hz), 25.75, 22.73, 22.30, 14.19, 8.43.
(30) (n = 12) yield: 43.2%. Elemental analysis: calculated for C36H60IN3O2: C = 62.32, H = 8.72, N = 6.06; found: C = 61.73, H = 8.617, N = 5.913. HRMS [C36H60N3O2]+ = 566.4680. 1H NMR (400 MHz, CDCl3) δ/ppm 7.84 (d, J = 8.6 Hz, 4H), 6.97 (dd, J = 8.9, 1.5 Hz, 4H), 4.08–3.98 (m, 4H), 3.44 (q, J = 7.2 Hz, 6H), 3.33–3.26 (m, 2H), 1.89–1.71 (m, 6H), 1.57–1.49 (m, 3H), 1.49–1.43 (m, 2H), 1.38 (t, J = 7.1 Hz, 10H), 1.25 (s, 15H), 0.87 (t, J = 6.7 Hz, 3H). 13C NMR (101 MHz, CDCl3) δ/ppm 161.34, 161.04, 146.96 (d, J = 12.8 Hz), 124.39, 114.81 (d, J = 7.0 Hz), 77.48, 77.16, 76.84, 68.45, 67.98, 57.80, 53.88, 31.99, 30.02–29.18 (m), 29.02, 26.19 (d, J = 19.0 Hz), 25.76, 22.76, 22.28, 14.20, 8.43.
3.2 Mesomorphic studies
The thermal behaviour and liquid crystalline properties of all the synthesized compounds were studied via polarizing optical microscopy (POM) and differential scanning calorimetry (DSC). For polarizing microscopy, a Linkam hot stage and temperature observation under polarized light of an Olympus BX 51 polarizing optical microscope were used. The magnification used to capture the optical texture was 10× and 200 μm. DSC thermograms were recorded using a PerkinElmer DSC-7 with heating and cooling rates of 5 °C min−1.3.3 Photoswitching studies
The UV-vis spectra of the azobenzene-based ionic liquids and their intermediates were recorded using an Ocean Optics HR-2000+ UV-vis spectrophotometer setup. The photoisomerization of the azo compounds were recorded in a dark room in the wavelength range of 250 nm to 800 nm, and chloroform was used as the blank. At fixed concentration of ∼1.0 × 10⁻⁵ mol L−1 of solution was prepared in chloroform and irradiated with a UV light source (Omni cure series 2000). The irradiation wavelength was 360 nm and a heat filter was used to keep heat radiation away from the source. The intensity of the irradiation light was 1 mW cm−2, which was measured using a UV513AB UV meter. The absorption spectra of compounds 10–30 were recorded before illumination and after illumination. After reaching the photosaturation state, the thermal back relaxation was recorded by keeping the samples in the dark. For trans–cis–trans photoisomerization, the changes in absorption spectra upon UV illumination and thermal back relaxation were investigated with respect to time. For thermal back relaxation, first-order plots were plotted for cis (Z)- trans (E) isomerisation of all the compounds and measured at room temperature at ∼27 °C.4 Conclusions
In summary, the photoresponsive behaviour of N,N-diethanol-6-(4-((4′-alkyloxyphenyl)diazenyl)phenoxy)hexan-1-ammonium iodides, 22–24, N-ethyl-N-ethanol-6-(4-((4′-alkyloxyphenyl)diazenyl)phenoxy)hexan-1-ammonium iodides, 25–27 and N,N-diethyl-6-(4-((4′-alkyloxyphenyl)diazenyl)phenoxy)hexan-1-ammonium iodides, 28–30 and their intermediates 10–21 was characterized and their mesomorphic and photoswitching properties investigated. The schlieren texture of the smectic C (tilted) and smectic B phases was observed in case of the highest substituted carbon atom length in the alkoxy chain (n = 12) in the side chain of the azo moiety. The natural focal conic texture of the smectic A (non-tilted) phases was observed for all the compounds except the compound without a hydroxyl group in the terminal head group of its azo moieties. In the case of compound 30, after 45 s, the photoequilibrium state was achieved under UV irradiation and its photoisomerization efficiency was greater than 95%. Its thermal back relaxation time was about ∼590 min in solution at room temperature. The photoisomerization reaction rate was affected by the hydrophobic and hydrophilic head groups, and it also affected the equilibrium isomerization efficiency of the compounds. Thus, the azobenzene at the end of the head group bearing a hydroxyl group influences the thermal back relaxation. As a result, the presence of a hydroxyl group on the ammonium group decreases the thermal back relaxation time. In the case of the solid cell, the thermal back relaxation time achieved was ∼400 min. These results suggest that chemical modification of the photoresponsive behaviour of azobenzene derivatives can be useful for the design of molecular switches and optical storage devices.Conflicts of interest
There are no conflicts to declare.Acknowledgements
This research work was supported by DST-SERB (Department of Science and Technology-Science and Engineering Research Board) Govt of India under ECR grant (File No. ECR/2015/000190) and Universiti Sains Malaysia through the RUI research grant (Grant No. 1001/PKIMIA/8011094). We also thank Hima S Reddy for helping us to conduct the photoisomerization experiments.Notes and references
- G. Hegde, G. Shankar, S. M. Gan, A. R. Yuvaraj, S. Mahmood and U. K. Mandal, Liq. Cryst., 2016, 43(11), 1578–1588 CrossRef CAS.
- M. L. Rahman, M. M. Yusoff and S. Kumar, RSC Adv., 2014, 4(66), 35089–35098 RSC.
- M. L. Rahman, G. Hegde, M. Azazpour, M. M. Yusoff and S. Kumar, J. Fluorine Chem., 2013, 156, 230–235 CrossRef CAS.
- L. Rahman, S. Kumar, C. Tschierske, G. Israel, D. Ster and G. Hegde, Liq. Cryst., 2009, 36(4), 397–407 CrossRef CAS.
- M. R. Lutfor, G. Hegde, S. Kumar, C. Tschierske and V. G. Chigrinov, Opt. Mater., 2009, 32(1), 176–183 CrossRef CAS.
- S. K. Prasad, G. G. Nair and D. S. Rao, Liq. Cryst., 2009, 36(6–7), 705–716 CrossRef CAS.
- J. Sun and V. Chigrinov, Mol. Cryst. Liq. Cryst., 2012, 561(1), 1–7 CrossRef CAS.
- M. R. Lutfor, M. M. Yusoff, G. Hegde, M. N. Fazli, A. Malek, N. A. Samah and H. T. Srinivasa, Mol. Cryst. Liq. Cryst., 2013, 587, 41–53 CrossRef CAS.
- A. R. Yuvraj, W. S. Yam, T. N. Chan, Y. P. Goh and G. Hegde, Spectrochim. Acta, Part A, 2015, 135, 1115–1122 CrossRef PubMed.
- Y. Norikane, Y. Hirai and M. Yoshida, Chem. Commun., 2011, 47(6), 1770–1772 RSC.
- A. Ziegler, J. Stumpe, A. Toutianoush and B. Tieke, Colloids Surf., A, 2002, 198, 777–784 CrossRef.
- A. R. Yuvaraj, G. S. Mei, A. D. Kulkarni, M. Y. Mashitah and G. Hegde, RSC Adv., 2014, 4(92), 50811–50818 RSC.
- S. M. Gan, A. R. Yuvaraj, M. R. Lutfor, M. Y. Mashitah and H. Gurumurthy, RSC Adv., 2015, 5(9), 6279–6285 RSC.
- G. Hegde, V. M. Kozenkov, V. G. Chigrinov and H. S. Kwok, Mol. Cryst. Liq. Cryst., 2009, 507(1), 41–50 CrossRef CAS.
- V. Jayalakshmi, G. Hegde, G. G. Nair and S. K. Prasad, Phys. Chem. Chem. Phys., 2009, 11(30), 6450–6454 RSC.
- G. Hegde, A. R. Yuvaraj, W. Sinn-Yam and M. M. Yusoff, in Macromolecular Symposia, 2015, vol. 353, pp. 240–245 Search PubMed.
- M. Alaasar, M. Prehm, K. May, A. Eremin and C. Tschierske, Adv. Funct. Mater., 2014, 24(12), 1703–1717 CrossRef CAS.
- M. Alaasar, M. Prehm, M. Brautzsch and C. Tschierske, J. Mater. Chem. C, 2014, 2(28), 5487–5501 RSC.
- M. M. Naoum, A. A. Fahmi, N. H. Ahmed and G. R. Saad, Liq. Cryst., 2015, 42(9), 1298–1308 CrossRef CAS.
- M. M. Naoum, A. A. Fahmi, A. H. Abaza and G. R. Saad, Liq. Cryst., 2014, 41(11), 1559–1568 CrossRef CAS.
- M. Podruczna, A. Hofmańska, I. Niezgoda, D. Pociecha and Z. Galewski, Liq. Cryst., 2014, 41(1), 113–125 CrossRef CAS.
- Z. Li, H. Wang, M. Chu, P. Guan, Y. Zhao, Y. Zhao and J. Wang, RSC Adv., 2017, 7(71), 44688–44695 RSC.
- R. Hayes, G. G. Warr and R. Atkin, Chem. Rev., 2015, 115, 6357–6426 CrossRef CAS PubMed.
- J. E. S. J. Reid, F. Agapito, C. E. S. Bernardes, F. Martins, A. J. Walker, S. Shimizu and M. E. Minas da Piedade, Phys. Chem. Chem. Phys., 2017, 19, 19928–19936 RSC.
- O. Palumbo, F. Trequattrini, M. A. Navarra, J. B. Brubach, P. Roy and A. Paolone, Phys. Chem. Chem. Phys., 2017, 19, 8322–8329 RSC.
- K. Dong, X. Liu, H. Dong, X. Zhang and S. Zhang, Chem. Rev., 2017, 117, 6636–6695 CrossRef CAS PubMed.
- D. Andrienko, J. Mol. Liq., 2018, 267, 520–541 CrossRef CAS.
- D. D. Díaz, D. Kühbeck and R. J. Koopmans, Chem. Soc. Rev., 2011, 40(1), 427–448 RSC.
- M. Ikeda, R. Ochi and A. W. I. Hamachi, Chem. Sci., 2010, 1, 491–498 RSC.
- M. A. C. Stuart, W. T. Huck, J. Genzer, M. Müller, C. Ober, M. Stamm and F. Winnik, Nat. Mater., 2010, 9(2), 101 CrossRef PubMed.
- X. Chen, J. Gao, B. Song, M. Smet and X. Zhang, Langmuir, 2009, 26, 104–108 CrossRef PubMed.
- K. Stappert, J. Muthmann, E. T. Spielberg and A. V. Mudring, Cryst. Growth Des., 2015, 15(9), 4701–4712 CrossRef CAS.
- L. J. Yu, R. G. Peng, Y. Z. Wang and Y. K. Yang, Adv. Mater. Res., 2012, 534, 122–125 CAS.
- H. Tamura, Y. Shinohara and T. Arai, Chem. Lett., 2010, 39, 240–241 CrossRef CAS.
- S. Zhang, S. Liu, Q. Zhang and Y. Deng, Chem. Commun., 2011, 47, 6641–6643 RSC.
- J. Avó, L. Cunha-Silva, J. Lima and A. Jorge Parola, Org. Lett., 2014, 16, 2582–2585 CrossRef PubMed.
- J. Yang, H. Wang, J. Wang, Y. Zhang and Z. Guo, Chem. Commun., 2014, 50, 14979–14982 RSC.
- S. Shi, T. Yin, X. Tao and W. Shen, RSC Adv., 2015, 5, 75806–75809 RSC.
- A. Wu, F. Lu, P. Sun, X. Gao, L. Shi and L. Zheng, Langmuir, 2016, 32, 8163–8170 CrossRef CAS PubMed.
- E. Madiahlagan, B. N. Sunil, Z. Ngaini and G. Hegde, J. Mol. Liq., 2019, 292, 111328 CrossRef CAS.
- N. Trbojevic, J. C. Haenle, T. Wöhrle, J. Kirres and S. Laschat, Liq. Cryst., 2016, 43(8), 1135–1147 CrossRef CAS.
- W. J. Goodby, Handbook of Liquid Crystals Set, 1998, pp. 411–440 Search PubMed.
- M. L. Rahman, G. Hegde, M. M. Yusoff, M. N. F. A. Malek, H. T. Srinivasa and S. Kumar, New J. Chem., 2013, 37(8), 2460–2467 RSC.
Footnote |
| † Electronic supplementary information (ESI) available. See DOI: 10.1039/c9ra08211e |
| This journal is © The Royal Society of Chemistry 2019 |


