DOI:
10.1039/C9RA08149F
(Paper)
RSC Adv., 2019,
9, 39970-39975
Aggregation tailored emission of a benzothiazole based derivative: photostable turn on bioimaging†
Received
8th October 2019
, Accepted 18th November 2019
First published on 4th December 2019
Abstract
Herein, we report a benzothiazole based probe which exhibits aggregation induced emission in mixed solvents, v/v THF![[thin space (1/6-em)]](https://www.rsc.org/images/entities/char_2009.gif) :water system. The blue emission observed in the solution is ascribed to the enolic emission of the excited state intramolecular proton transfer (ESIPT) prone benzothiazole chromophore, as the aggregation induced by the protic solvent, water, is expected to restrict the phototautomerization of the probe to the keto form which generally emits in the red region. However, the green emission observed in the solid aggregated state is ascribed to its keto emission, as in the solid state the ESIPT process is activated owing to stable intramolecular hydrogen bonding, giving a keto-aggregation induced emission (AIE) coupled emission. The aggregation process is evident from the particle size and the change in morphology predicted by dynamic light scattering (DLS) and scanning electron microscopy (SEM) respectively, in the aggregated state. Interestingly, the emission in the solution, as well as the solid state, is convincingly mimicked in the fluorescence imaging of various live cancer cells and plant roots.
:water system. The blue emission observed in the solution is ascribed to the enolic emission of the excited state intramolecular proton transfer (ESIPT) prone benzothiazole chromophore, as the aggregation induced by the protic solvent, water, is expected to restrict the phototautomerization of the probe to the keto form which generally emits in the red region. However, the green emission observed in the solid aggregated state is ascribed to its keto emission, as in the solid state the ESIPT process is activated owing to stable intramolecular hydrogen bonding, giving a keto-aggregation induced emission (AIE) coupled emission. The aggregation process is evident from the particle size and the change in morphology predicted by dynamic light scattering (DLS) and scanning electron microscopy (SEM) respectively, in the aggregated state. Interestingly, the emission in the solution, as well as the solid state, is convincingly mimicked in the fluorescence imaging of various live cancer cells and plant roots.
Introduction
Luminescent materials are powerful tools for analytical sensing and optical imaging in which they are generally used in the gaseous, liquid and solid states. Their sensitivity and application potentials are subject to the brightness and contrast of their emission characteristics before and after analyte recognition. For the majority of practical applications, the fluorescent chromophores are used either as films or aggregates. For the optoelectronic applications, these are employed as thin solid films, whereas for chemical and biological assays, these are used in the solution and physiological environments. In most cases it has been observed that the emission of the chromophores is quenched at a high concentration or in the aggregate/solid state due to the aggregation caused quenching (ACQ) effect,1 which limits the scope of their practical application, especially in biological studies in which they act in the turn off mode. Tang et al. in 2001 were the first to overcome the ACQ problem by disclosing the contrasting phenomenon in which the fluorescent chromophores were induced to emit extensively by aggregate formation, and referred to it as the aggregation induced emission (AIE) process.2 This is expected to be achieved when the fluorescent organic chromophores are genuinely dissolved in a good solvent, such as THF, followed by addition of varying fractions of a poor solvent, such as water. The turn on emission of these AIE active chromophores at high concentrations makes them promising candidates for bioimaging applications.3
Excited state intramolecular proton transfer (ESIPT) is an extremely fast phototautomerization process at a subpicosecond time scale, provided that both the proton donor (–OH, NH2 etc.) and the acceptor (–C![[double bond, length as m-dash]](https://www.rsc.org/images/entities/char_e001.gif) O, –N etc.) units are in close proximity.4 This process is characterised by the formation of an intramolecular hydrogen bond and a large Stokes shift without self absorption, and thus has attracted wide interest in recent years.5–8 Although a large number of compounds exhibiting ESIPT properties have been employed for various practical applications such as laser dyes, photostabilisers, fluorescent materials and so forth,9–12 if these were to be integrated with AIE properties, this would definitely improve the potential of various probes for high tech applications. In recent years, inspired by literature reports on the influence of controlling the ratio of water in solution of aggregates on AIE, we reported a solvent controlled AIE enhancement of ESIPT chromophore benzothiazole based derivatives 1, 2 and 3 that modulated the emission characteristics, as well as naked eye fluorescence emission controlled by the extent of aggregation, as depicted in Fig. 1.13–15 Subsequently, these derivatives could be used as chemosensors and bioimaging agents. Interestingly derivative 2 turned out to be a multicolour emissive in a broad emission range from blue to red in its aggregated state and was suggested to be good candidate for possible application in organic light emitting diodes (OLEDs). Additionally, it was also employed for the unprecedented detection of picric acid in live cells. On the other hand, the derivative 3 in its non aggregated state detects HSO4− and I− ions via two discrete mechanisms promoted by the acidic and basic natures of these ions, respectively.15
O, –N etc.) units are in close proximity.4 This process is characterised by the formation of an intramolecular hydrogen bond and a large Stokes shift without self absorption, and thus has attracted wide interest in recent years.5–8 Although a large number of compounds exhibiting ESIPT properties have been employed for various practical applications such as laser dyes, photostabilisers, fluorescent materials and so forth,9–12 if these were to be integrated with AIE properties, this would definitely improve the potential of various probes for high tech applications. In recent years, inspired by literature reports on the influence of controlling the ratio of water in solution of aggregates on AIE, we reported a solvent controlled AIE enhancement of ESIPT chromophore benzothiazole based derivatives 1, 2 and 3 that modulated the emission characteristics, as well as naked eye fluorescence emission controlled by the extent of aggregation, as depicted in Fig. 1.13–15 Subsequently, these derivatives could be used as chemosensors and bioimaging agents. Interestingly derivative 2 turned out to be a multicolour emissive in a broad emission range from blue to red in its aggregated state and was suggested to be good candidate for possible application in organic light emitting diodes (OLEDs). Additionally, it was also employed for the unprecedented detection of picric acid in live cells. On the other hand, the derivative 3 in its non aggregated state detects HSO4− and I− ions via two discrete mechanisms promoted by the acidic and basic natures of these ions, respectively.15
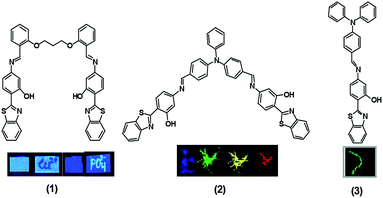 |
| | Fig. 1 Chemical structures of probes 1–3. Inset: visible emission colours from various probes (1–3) in different conditions under 365 nm UV light. | |
Interestingly, it could also be applied for the imaging of these ions in nematodes. However, in an attempt to explore the sensing ability of 3, it is interesting to note that compound 3 modulates its electronic behaviour when its poor solvent, water, is added to a solution of pure THF emission occurs. This observation motivated us to explore the potential for aggregation in a mixed solvent system and also bioimaging. In the present investigation, we report the quantified results of the aggregation behaviour of 3 and its bioimaging activity in line with the importance of the AIE-ESIPT coupled process in biological assays. In our earlier investigation,15 the behaviour of this probe was investigated in its non-aggregated state.
Experimental details
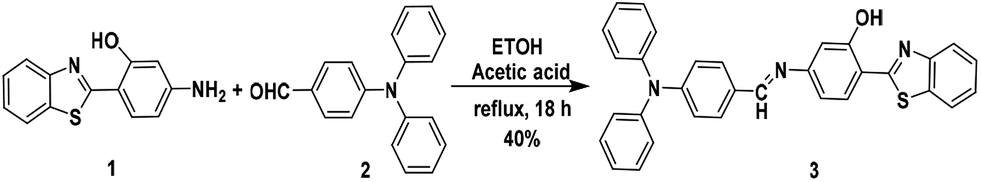
Synthesis of the molecular probe 3
The AIE + ESIPT hybrid molecular probe 3 was synthesised via a Schiff-base condensation reaction of 4-(diphenylamino)benzaldehyde (possessing three phenyl rotors and a nonplanar structure which make it an ideal building block for AIEgens) and 2-(4-amino-2-hydroxyphenyl)benzothiazole (a characteristic ESIPT active luminogen) (see Scheme 1).15,16 4-(Diphenylamino)benz-aldehyde (0.412 mmole, 0.112 g) and 2-(4-amino-2-hydroxyphenyl)-benzothiazole (0.412 mmole, 0.1 g) were added to a flask, and then 10 mL ethanol and 1 to 2 drops of glacial acetic acid were added. The reaction mixture was then refluxed at 80 °C for 18 h. After cooling to room temperature and filtering, a yellow powder was obtained that was recrystallized from ethanol and provided the pure compound. Yield: 40%. Mp: 195–197 °C. 1H NMR (400 MHz, CDCl3) δ/ppm: 6.81 (1H, dd, J = 8.40 Hz, ArH), 6.87 (1H, d, J = 2 Hz, ArH), 7.08 (2H, d, J = 8.8 Hz, ArH), 7.12 (2H, dt, Ja = 1.2 Hz, Jb = 7.60 Hz, ArH), 7.16 (4H, dd, Ja = 1.2 Hz, Jb = 7.6 Hz, ArH), 7.31 (4H, tt, Ja = 2 Hz, Jb = 8.4 Hz, ArH), 7.4 (1H, dt, Ja = 1.2 Hz, Jb = 7.6 Hz, ArH), 7.5 (1H, dt, Ja = 1.2 Hz, J = 7.6 Hz, ArH), 7.68 (1H, d, J = 8.4 Hz, ArH), 7.75 (2H, d, J = 8.8 Hz, ArH), 7.9 (1H, d, J = 7.2 Hz, ArH), 7.97 (1H, d, J = 7.6 Hz, ArH), 8.39 (1H, s, –CHN), 12.65 (1H, s, –OH, D2O exchangeable). 13C NMR (100 MHz, CDCl3) δ/ppm: 109.02, 113.85, 114.46, 121.33, 121.62, 122.1, 124.4, 125.46, 125.78, 126.8, 129, 129.36, 129.7, 130.43, 132.58, 146.94, 151.37, 152.05, 156.85, 159.08, 160.67, 169.31. IR (KBr): νmax/cm−1: 3693.8, 3060.1, 2870.1, 2363.1, 2105.9, 1856.2, 1632.6, 1580.4, 1476, 1438.8, 1390.3, 1319.5, 1274.7, 1207.7, 1133.1, 980.3, 946.7, 827.5, 756.6. HRMS: m/z calculated for C32H23N3OS: 498.1635 found: 498.1552 (M+ + 1) (for spectra see ESI†).
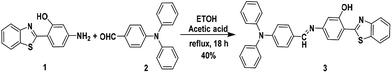 |
| | Scheme 1 Synthetic route for the fluorescent probe 3. | |
Materials and instrumentation
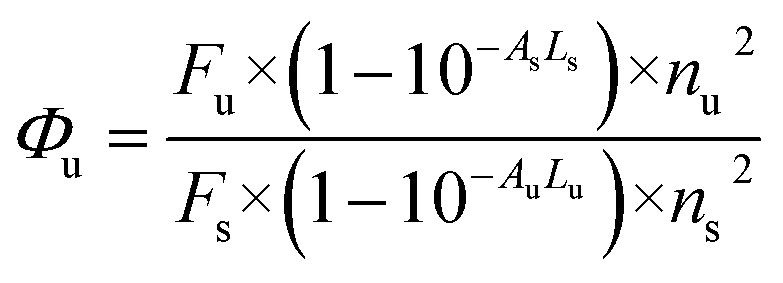
All liquid reagents were dried/purified using the recommended drying agents and/or distilled over 4 Å molecular sieves. THF (AR grade) and double distilled deionized water were used to carry out various spectrochemical studies. Fluorescence studies were carried out using a PerkinElmer LS 55 fluorescence spectrometer, having a xenon flash lamp with a pulse at a line frequency of 50–60 Hz. The fluorescence spectrometer consists of Monk–Gillieson type monochromators having the range of excitation: 200–800 nm and emission: 200–900 nm with a zero order R928 photomultiplier. The fluorescence spectroscopic studies were carried out using an ultraviolet (UV) light emitting diode (LED) with an excitation wavelength of 337 nm, focused perpendicularly to one side of the fluorescence quartz cuvette at an excitation slit width of 12 nm respectively. The emission spectrum was recorded by scanning the monochromator in the visible region from 350 to 650 nm using an emission slit width of 2.5 nm, respectively. Detection of the optical signal was performed using a photomultiplier tube located at the exit port of the monochromator, which was further connected to a power meter. UV-vis studies were carried out using a UV-1800 SHIMADZU UV-spectrophotometer. A high resolution mass spectrometry (HRMS) spectrum was recorded on a Bruker HRMS MICROTOF II spectrometer. 1H and 13C NMR spectra were recorded on a Bruker Avance II NMR spectrometer at 400 MHz, with TMS as the internal standard using CDCl3 and D2O as the deuterated solvent. Data are reported as follows: chemical shift in ppm (δ), integration, multiplicity (s = singlet, d = doublet, t = triplet, m = multiplet), coupling constant J (Hz) and assignment. Infrared (IR) spectra were recorded on an Agilent Technologies Cary 630 Fourier-transform infrared spectroscopy (FTIR) spectrophotometer in the range 650–4000 cm−1. The fluorescence quantum yields were measured using 9,10-diphenylanthracene17 as a standard having quantum yield of 0.95 in cyclohexane, using the following equation:
In which Φu and Φs are the quantum yields of the test and the standard samples, respectively. Au and As are the absorbance values of the test sample and the standard sample respectively, Fu and Fs are the areas of the emission bands for the test sample and the standard sample, and nu and ns are the refractive indices of the test sample and standard sample solutions in their respective pure solvents. L is the length of the cell (1.0 cm for standard and test samples). The dynamic light scattering (DLS) studies were carried out using a MALVERN Zetasizer Nano ZS instrument. Samples for the scanning electron microscopy (SEM) experiment were prepared by dropping a uniform volume (5 μL) of the solutions of 3 (in pure THF, 5:5 v/v, THF:water and 2:8 v/v, THF:water) over glass slides (1 × 1 cm) that were slowly dried afterwards under a vacuum in a hot oven at 70–80 °C. The dried slides were then coated with silver paste in a vacuum coater using the sputtering technique and then visualized in a ZEISS Supra 55 scanning electron microscope to capture the SEM images. The dried aggregated samples for confocal imaging were prepared by coating a glass slide with a solution of 3 (10 μM in 2:8 v/v, THF:water) using the drop casting method followed by drying the slide overnight in a vacuum.
Cytotoxicity assessment
In order to study the toxicity of 3, a 3-(4,5-dimethylthiazole-2-yl)-2,5-diphenyl tetrazolium bromide (MTT) assay18 was performed on breast cancer cell line (MCF-7) cells treated with 3 up to a concentration of 80 μM. In a typical procedure MCF-7 cells were grown in a T25 flask and seeded in a 96 well plate and incubated for 24 h in an incubator at 5% CO2, 37 °C and under a humidified environment. Dulbecco's modified eagle's media (DMEM-Himedia) supplemented with 10% fetal bovine serum and 1% penicillin streptomycin was used as the nutrient media. The stock solution of 3 was made in DMF:water. The treatment (40–80 μM) was given in such a way that the final DMF concentration did not exceed 1%. After a 24 h treatment, cells were washed and treated with 0.5 mg mL−1 MTT for 4 h. The MTT containing media was replaced with DMSO and the plate was read at 540 nm using a Biotek microplate-reader. The cell viability was calculated using absorbance at 540 nm using the following equation:
| % Cell viability = [mean absorbance of the treated cell/mean absorbance of the control] × 100 |
The data is represented as the mean ± standard deviation (SD) of triplicates.
Live cell imaging
The live cell imaging of cells treated with 3 was performed using confocal microscopy. Three different human cancer cell lines, that is HeLa (cervical cancer), MCF-7 (breast cancer) and A375 (human melanoma) cells were seeded in 12 mm confocal dishes and incubated for 24 h. Furthermore, the cells were treated with 3 (50 μM) for a period of 4 h and subsequently washed with 1× PBS. The intracellular fluorescence was examined using lasers of λex – 405 nm (λem – 415–460 nm). All of the cell lines were procured from the National Centre for Cell Science (NCCS), Pune, India and maintained at the Indian Institute of Technology (IIT) Indore, India.
Imaging in plant roots
For tissue imaging, Solanum lycopersicum L. (tomato) roots were used. For analysis, the roots were treated with probe 3 (10 μM in 2:8 v/v, THF:water) for 30 min at a temperature of 25 ± 2 °C. After treatment, the samples were washed with a THF:water (2:8 v/v) mixture, followed by slide preparation. Imaging was carried out using a confocal microscope (model: NikonA1R resonance scanner at 20× magnification at a 405 nm channel).
Results and discussion
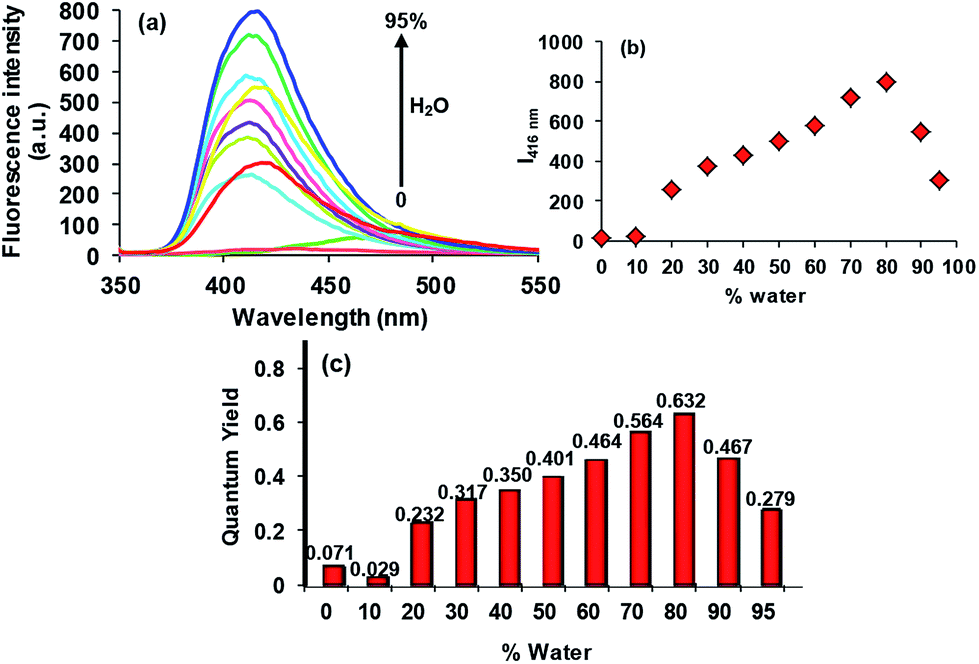
In the good solvent THF, compound 3 (5 × 10⁻⁶ M) exhibits a very weak emission band at 468 nm (Φf = 0.071) (Fig. 2). From the structural point of view, as predicted by the time-dependent density functional theory (TD-DFT) calculations, the possible conformational flexibility promoting the intramolecular rotations, as well as the photoinduced electron transfer (PET) assumed to be triggered by the 4-iminotriphenylamine (ITPA) sub unit to the 2-(2′-hydroxyphenyl)benzothiazole (HBT) sub unit of 3 involving mainly the highest occupied molecular orbital (HOMO)-1 and lowest unoccupied molecular orbital (LUMO) of 3 dominated by the orbitals of ITPA and HBT units, respectively, are considered to be responsible for the non-emissive behaviour of 3.15 These processes subsequently dissipate the excited state energy in the solution state. We anticipated that, as water is a poor solvent for 3, it might aggregate in a mixture with higher fractions of water in the solution. In order to explore this possibility, we investigated the photophysical behaviour of 3 in various solutions with varying fractions of water. As shown in Fig. 2, upon the addition of 20% of water v/v to the THF solution of 3 (5 × 10⁻⁶ M), an increase in the emission intensity of the band (Φf = 0.232) was observed which continued until the addition of 80% water accompanied by a hypsochromic shift of 52 nm to appear at 416 nm (Φf = 0.632). The visual change in the emission behaviour of 3 corresponding to different ratios of THF and water is depicted in Fig. 3.
 |
| | Fig. 2 Change in the emission behaviour of 3 (5 × 10⁻⁶ M, in THF, λexc = 337 nm) with the increasing percentage of the water fraction in the solution. | |
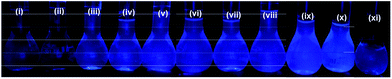 |
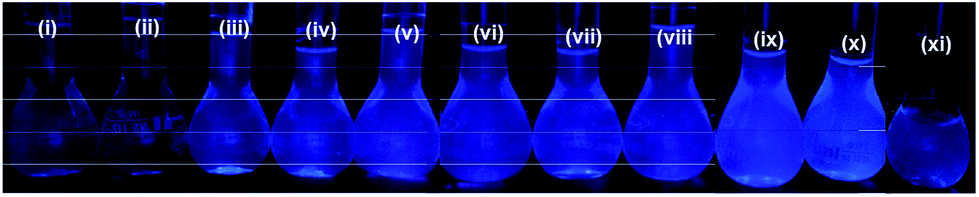
| | Fig. 3 Visual emission change (under illumination at 365 nm) with the increasing percentage of the water fraction in the THF solution of 3 (5 × 10⁻⁶ M), v/v (i = 10:0, ii = 9:1, iii = 8:2, iv = 7:3, v = 6:4, vi = 5:5, vii = 4:6, viii = 3:7, ix = 2:8, x = 1:9, xi = 0.5:9.5; THF:water). | |
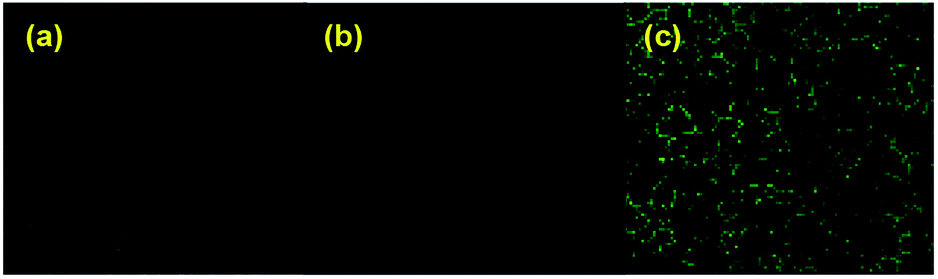
As compound 3 is insoluble in water, and weakly emissive in THF, and highly emissive in the THF:water 2:8 v/v fraction, we suggest that the process of the AIE could be ascribed to the concentration restricted intramolecular rotations. However, the decrease in the emission intensity beyond the 80% water fraction (Fig. 2) may be due to the start of agglomeration19 in the solution. As the HBT unit of 3 is a well known ESIPT chromophore, it is expected to display a dual emission corresponding to the enolic (410–430 nm) and keto (>500 nm) emissions.20 However, if certain experimental conditions, such as use of protic solvents, which may involve the hydroxyl group in intermolecular hydrogen bonding, do not permit them to adopt the keto form during the ESIPT process, the ESIPT chromophores will not exhibit a keto emission at a longer wavelength.11 On the basis of this, the AIE band observed at 416 nm in the THF:water, 2:8, v/v fraction is ascribed as primarily being the enolic emission. From the above described observations in the solution phase, we wondered if probe 3 would also be able to show an identical emission in the solid aggregated state. In order to study this, confocal images of the dried aggregated samples of 3 (10 μM in 2:8 v/v, THF:water) were recorded using lasers of λex = 404.1 nm (λem = 425–475 nm) and λex = 488 nm (λem = 500–530 nm). In the solid aggregated state, probe 3 showed a green emission (Fig. 4). The emission behaviour exhibited by 3 in the dried sample is in good agreement with the literature reports that in the solid state the ESIPT process is also activated owing to the stable intramolecular hydrogen bonding, giving the keto-AIE emission at a longer wavelength.21
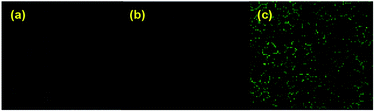 |
| | Fig. 4 (a) Digital image correlation (DIC), and fluorescent confocal microscopic images of dried aggregated sample of 3 (10 μM in 2:8 v/v THF:water) in (b) the blue channel (λex = 404.1 nm, λem = 425–475 nm) and (c) the green channel (λex = 488 nm, λem = 500–530 nm). Images were captured using a Nikon A1R confocal microscope at 20× zoom using a 405 excitation laser. | |
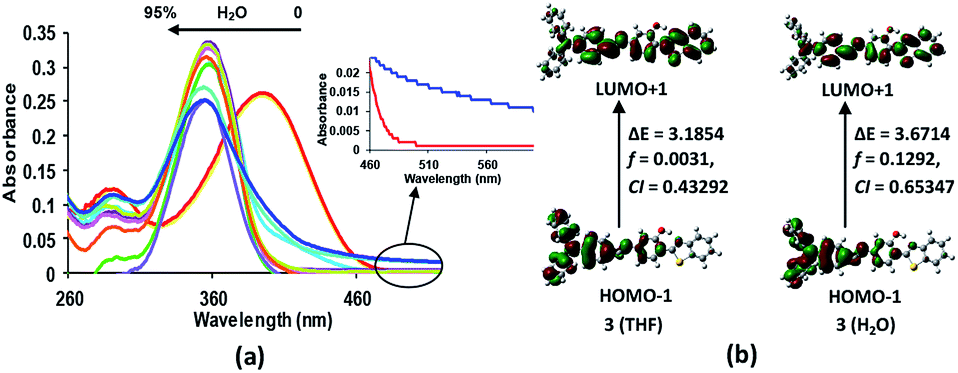
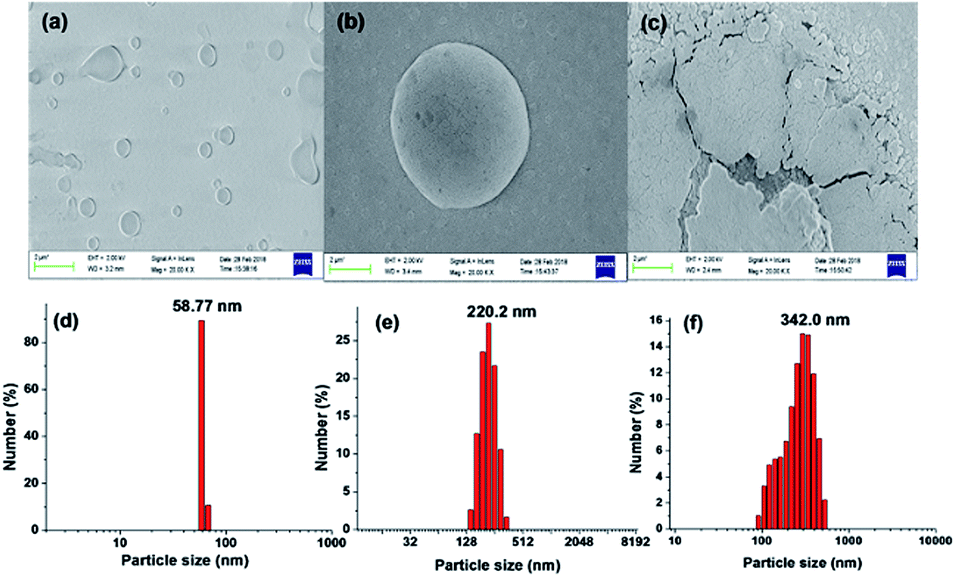
The electronic absorption spectrum of compound 3 (5 × 10⁻⁶ M, in THF) is characterised by a strong absorption band at 395 nm (3.1388 eV; εmax 41956.2 L mol−1 cm−1) and a high energy weak band at 290 nm (4.27532 eV; εmax 18767.8 L mol−1 cm−1) (Fig. 5). From the TD-DFT calculations, these bands have been assigned as intramolecular charge transfer (ICT) bands with the main contributions coming from HOMO − 1 → LUMO + 1 (CI = 0.43292) and HOMO − 1 → LUMO + 2 (CI = 0.56546), respectively.15 However, the incremental addition of water fractions to the pure THF solution results in a hypsochromic shift of 38 nm in the main band to appear at 358 nm (3.4632 eV; εmax 48600 L mol−1 cm−1) (Fig. 5a) which is in line with the TD-DFT calculations performed using water as a solvent (Fig. 5b). However, levelling of the tail in the visible region at a higher fraction of water supports the formation of aggregates in solution22 (Fig. 5a inset). The hypsochromic shift in the absorption band is believed to be due to the formation of H-type aggregates.22 The proposed aggregation of 3 with an increase in the water fraction was further supported by the SEM images of 3 in an 80% water fraction (Fig. 6a–c). SEM images revealed that probe 3 (5 × 10⁻⁶ M) assembles itself into spherical shaped aggregates, and the size of these aggregates varies with the varying fraction of water in the solution. The SEM image of 3 (5 × 10⁻⁶ M in 2:8 v/v, THF:water) further supported the onset of agglomeration at an 80% fraction of water (Fig. 6c). Furthermore, the DLS studies also confirmed the existence of aggregates with an average particle size of 342 nm in THF:water, v/v mixture with 80% water fraction. A significant increase in the particle size from 58.77 nm (pure THF) to 342.0 nm (with an 80% water fraction) is observed (Fig. 6d–f).
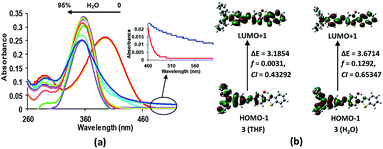 |
| | Fig. 5 (a) Change in the absorption behaviour of 3 (5 × 10⁻⁶ M, in THF) with the increasing percentage of the water fraction in solution. Inset: expanded absorbance spectra of 3 (5 × 10⁻⁶ M, in pure THF (red)) and in 2:8 v/v, THF:water (blue). (b) Contours of the molecular orbitals involved in the dominant transition, f = oscillator strength, CI = configurational integration coefficient. (See ESI†). | |
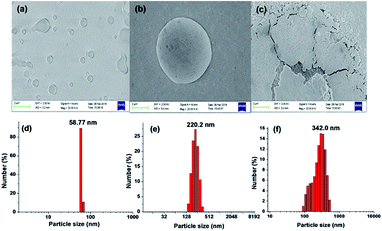 |
| | Fig. 6 SEM and DLS graphs of 3 (5 × 10⁻⁶ M) in (a) and (d) THF, (b) and (e) 5:5 v/v, THF:water and (c) and (f) 2:8 v/v THF:water. | |
In order to explore the bioimaging potential of compound 3, we first evaluated its cytotoxicity using an MTT assay (Fig. 7) in the concentration range 0–80 μM. Marginal toxicity of 3 was observed. The total cell viability was more than 80% at 100 μM for 3 for a treatment study of 24 h.
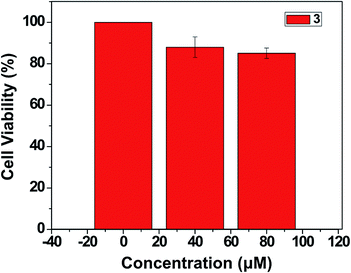 |
| | Fig. 7 Cytotoxicity profile of 3 against the MCF-7 cell line. | |
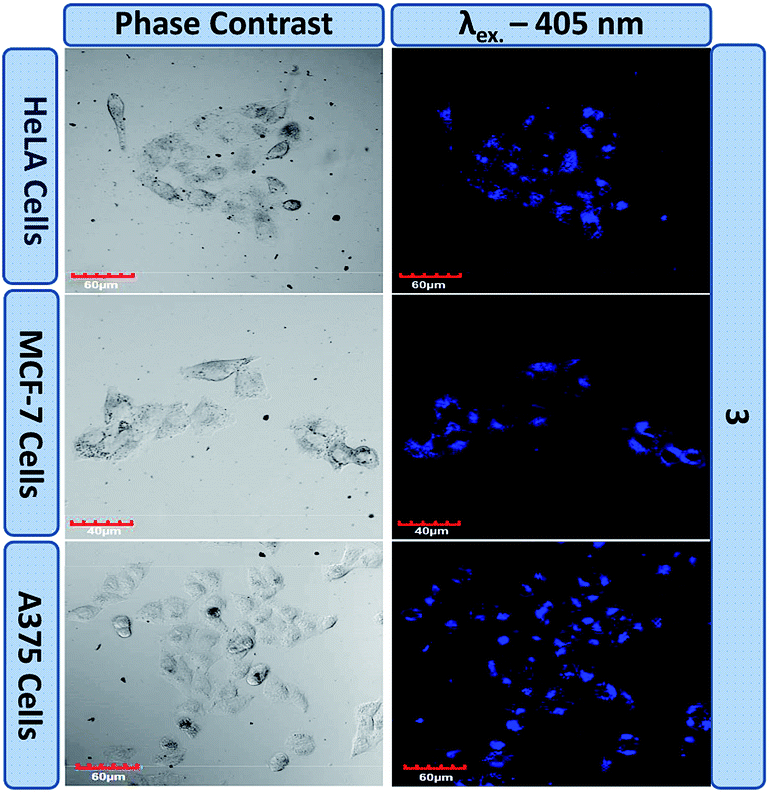
These results indicate that probe 3 possesses excellent biocompatibility and non-toxicity. These characteristics in combination with the inherent good fluorescent nature due to the AIE effect make 3 an ideal candidate for bioimaging, which was explored thereafter. Live cancer cell imaging was performed to utilise the cellular uptake of 3 and establish it as a bioimaging probe. Three different cancer cell lines, HeLa, MCF-7 and A375, were separately treated with 3 and imaged under a confocal microscope using λex – 405 nm/λem – 415–460 nm (blue channel laser). The appearance of a prominent fluorescence signal in the blue channel, as shown in Fig. 8, suggests the good cellular uptake of 3 in these cancer cell lines and a thorough investigation of these confocal images reveals an uneven subcellular distribution of 3. The emission in the blue channel further supplements our claim of AIE induced emission at 416 nm in the solution phase which has been assigned as being enolic emission.
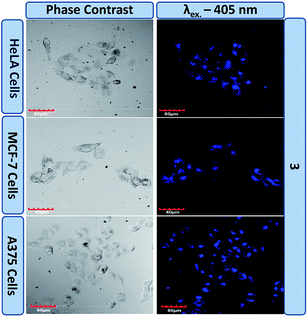 |
| | Fig. 8 Live cell imaging using 3 in different cancer cell lines. | |
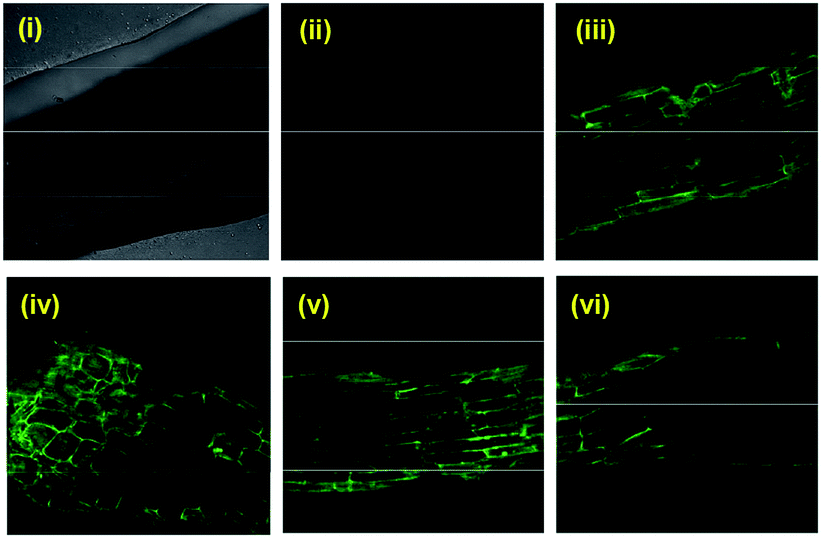
Additionally the ability of probe 3 to travel along the plant tissues was explored in the roots of Solanum lycopersicum L. (tomato) in which the roots were treated with 3 (10 μM in 2:8 v/v, THF:water) for 30 min, and imaged under a confocal microscope using λex – 405 nm/λem – 415–460 nm (blue channel laser) and λex – 488 nm/λem – 500–530 nm (green channel laser). The appearance of a prominent fluorescence signal in the green channel, as shown in Fig. 9, was observed which was attributed to the keto emission of the HBT unit in line with that in the solid state as shown in Fig. 4. These observations in plant tissues indicate that compound 3 can penetrate and distribute in the biological environment with a clear detectable emission. On the basis of these observations we suggest that 3 can be used to study the transportation and distribution of plant hormones if functionalised with 3.23
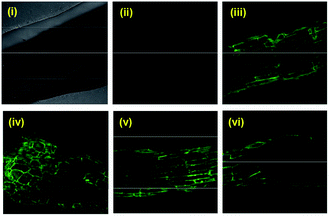 |
| | Fig. 9 (i) DIC, and fluorescent confocal microscopic images of Solanum lycopersicum L. (tomato) roots when treated with 3 (10 μM in 2:8 v/v, THF:water) in (ii) the blue channel (λex = 404.1 nm, λem = 425–475 nm) and (iii–vi) the green channel (λex = 488 nm, λem = 500–530 nm). Images were captured using a Nikon A1R confocal microscope at 20× zoom using a 405 excitation laser. | |
Conclusions
The benzothiazole based molecular probe aggregates in the mixed solvent system of THF and water, and emits the maximum emission in the blue region at an 80% fraction of water in THF (v/v). This blue emission is ascribed to the enolic emission of the benzothiazole chromophore. Whereas in the dried aggregated state, probe 3 shows emission in the green region that is ascribed to its keto emission. The increase in the particle size and the change in morphology of the aggregates corroborate the formation of aggregates. Importantly, the blue emission is retained in live cancer cells, whereas the solid state green emission is also retained in plant roots, thus disclosing the potential of probe 3 for bioimaging.
Conflicts of interest
There are no conflicts to declare.
Acknowledgements
We are thankful to CSIR, New Delhi for financial support under project 02(0268)/16/EMR-II (KS), Guru Nanak Dev University for providing facilities (UPE programme), the Sophisticated Instrumentation Centre, IIT Indore for use of the confocal microscopy facility, and IK thanks DST, New Delhi for an INSPIRE fellowship.
Notes and references
- J. B. Birks, Photophysics of Aromatic Molecules, Wiley, London, 1970 Search PubMed.
- J. Luo, Z. Xie, J. W. Y. Lam, L. Cheng, B. Z. Tang, H. Chen, C. Qiu, H. S. Kwok, X. Zhan and Y. Liu, et al., Chem. Commun., 2001, 1740–1741 RSC.
-
(a) D. Ding, K. Li, B. Liu and B. Z. Tang, Acc. Chem. Res., 2013, 46, 2441–2453 CrossRef CAS;
(b) R. T. K. Kwok, C. W. T. Leung, J. W. Y. Lam and B. Z. Tang, Chem. Soc. Rev., 2015, 44, 4228–4238 RSC.
- J. E. Kwon and S. Y. Park, Adv. Mater., 2011, 23, 3615–3642 CrossRef CAS PubMed.
- A. Douhal, F. Lahmani and A. H. Zewail, Chem. Phys., 1996, 207, 477–498 CrossRef CAS.
- S. Lochbrunner, T. Schultz, M. Schmitt, J. P. Shaffer, M. Z. Zgierski and A. Stolow, J. Chem. Phys., 2001, 114, 2519–2522 CrossRef CAS.
- J. Goodman and L. E. Brus, J. Am. Chem. Soc., 1978, 100, 7472–7474 CrossRef CAS.
- S. M. Ormson and R. G. Brown, Prog. React. Kinet., 1994, 19, 45–91 CAS.
- P. Chou, D. Mcmorrow, T. J. Aartsma and M. Kasha, J. Phys. Chem., 1984, 88, 4596–4599 CrossRef CAS.
- D. Kuila, G. Kvakovszky, M. A. Murphy, R. Vicari, M. H. Rood, K. A. Fritch and J. R. Fritch, Chem. Mater., 1999, 11, 109–116 CrossRef CAS.
- J. Zhao, S. Ji, Y. Chen, H. Guo and P. Yang, Phys. Chem. Chem. Phys., 2012, 14, 8803–8817 RSC.
- J. Wu, W. Liu, J. Ge, H. Zhang and P. Wang, Chem. Soc. Rev., 2011, 40, 3483–3495 RSC.
- I. Kaur, P. Kaur and K. Singh, Sens. Actuators, B, 2018, 257, 1083–1092 CrossRef CAS.
- I. Kaur, V. Sharma, S. M. Mobin, P. Kaur and K. Singh, Sens. Actuators, B, 2019, 281, 613–6222 CrossRef CAS.
- I. Kaur, A. Khajuria, P. Ohri, P. Kaur and K. Singh, Sens. Actuators, B, 2018, 268, 29–38 CrossRef CAS.
- F. S. Santos, E. Ramasamy, V. Ramamurthy and F. S. Rodembusch, J. Mater. Chem. C, 2016, 4, 2820–2827 RSC.
- A. M. Brouwer, Pure Appl. Chem., 2011, 83, 2213–2228 CAS.
- J. Carmichael, W. G. DeGraff, A. F. Gazdar, J. D. Minna and J. B. Mitchell, Cancer Res., 1987, 47, 936–942 CAS.
- L. Qin, B. Tong, J. Shen, J. Shi, J. Zhi, Y. Dong, F. Yang, Y. Dong, J. W. Y. Lam, Y. Liu and B. Z. Tang, J. Phys. Chem. B, 2009, 113, 9098–9103 CrossRef.
-
(a) M. H. Van Benthem and G. D. Gillispie, J. Phys. Chem., 1984, 88, 2954–2960 CrossRef CAS;
(b) A. J. G. Strandjord and P. F. Barbara, J. Phys. Chem., 1985, 89, 2355–2361 CrossRef CAS.
- M. A. Rauf, S. Hisaindee and N. Saleh, RSC Adv., 2015, 5, 18097–18110 RSC.
- B. Z. Tang, Y. Geng, J. W. Y. Lam and B. Li, Chem. Mater., 1999, 11, 1581–1589 CrossRef CAS.
- S. Parisotto, B. Lace, E. Artuso, C. Lombardi, A. Deagostino, R. Scuduo, C. Garino, C. Medana and C. Prandi, Org. Biomol. Chem., 2017, 15, 884–893 RSC.
Footnote |
| † Electronic supplementary information (ESI) available: NMR, mass spectrometry and FTIR spectra. See DOI: 10.1039/c9ra08149f |
|
| This journal is © The Royal Society of Chemistry 2019 |
Click here to see how this site uses Cookies. View our privacy policy here. 
 Open Access Article
 This Open Access Article is licensed under a Creative Commons Attribution-Non Commercial 3.0 Unported Licence
 bcd,
Anjali Khajuriae,
Puja Ohrie,
Paramjit Kaur
bcd,
Anjali Khajuriae,
Puja Ohrie,
Paramjit Kaur