DOI:
10.1039/C9RA08080E
(Paper)
RSC Adv., 2019,
9, 42010-42019
Novel lanthanide(III) 4-methylbenzoylhydrazide complexes as precursors for lanthanide oxide nanophotocatalysts
Received
5th October 2019
, Accepted 14th November 2019
First published on 18th December 2019
1. Introduction
Hydrazide compounds contain terminal NH2 groups and are precursors for numerous synthesized Schiff and azo compounds. Hydrazides and their derivatives have potential active sites; C![[double bond, length as m-dash]](https://www.rsc.org/images/entities/char_e001.gif) O, NH and NH2 have the ability to coordinate with different metal ions.1 Hydrazides and their derivative metal complexes have applications in biological fields as insecticidal, acaricidal, nematicidal, and antileishmanial agents and inhibit protease enzymes in some parasitic species and diamine oxidases.1 Their lanthanide complexes have luminescent and magnetic properties; thus, they can be used in electroluminescent devices.2,3 Also, due to their exhibited spectroscopic, magnetic, and chemical properties, these lanthanide complexes have many useful applications compared to other metal complexes. This is due to the fluxional nature of lanthanide(III) ion, which possesses high and variable coordination numbers as well as a lack of angular preference.4 Hydrazide lanthanide complexes are an ongoing area of active research due to their good antioxidant activities and their biological activities, such as anticoagulation, antiallergic, antibacterial, anti-inflammatory and anticancer. Also, they have been used for treatment of burns.5–7
O, NH and NH2 have the ability to coordinate with different metal ions.1 Hydrazides and their derivative metal complexes have applications in biological fields as insecticidal, acaricidal, nematicidal, and antileishmanial agents and inhibit protease enzymes in some parasitic species and diamine oxidases.1 Their lanthanide complexes have luminescent and magnetic properties; thus, they can be used in electroluminescent devices.2,3 Also, due to their exhibited spectroscopic, magnetic, and chemical properties, these lanthanide complexes have many useful applications compared to other metal complexes. This is due to the fluxional nature of lanthanide(III) ion, which possesses high and variable coordination numbers as well as a lack of angular preference.4 Hydrazide lanthanide complexes are an ongoing area of active research due to their good antioxidant activities and their biological activities, such as anticoagulation, antiallergic, antibacterial, anti-inflammatory and anticancer. Also, they have been used for treatment of burns.5–7
Metal oxide nanoparticles show a wide range of applications, including catalysis, sensing, optics, semiconductors, solar cells, batteries and biotechnology. Also, metal oxide nanoparticles have been used as nanophotocatalysts for the degradation of methylene blue and Safranin-O dyes.8–12 The synthesis of metal oxide nanoparticles from their corresponding metal complexes is of great interest. This technique offers several unique advantages over other methods, including facility, reproducibility, short reaction times, short washing and drying durations, and production of inorganic nanomaterials with narrow size distributions.9
In this work, we aimed to synthesize lanthanide metal complexes of lanthanum(III), cerium(III), samarium(III), gadolinium(III), and holmium(III) with 4-methylbenzoylhydrazide ligand. Structural characterization of all the prepared compounds was performed based on elemental analysis, spectral methods (UV-Vis, IR, 1H NMR, and mass spectroscopy), molar electrical conductivity, magnetic susceptibility and thermal analyses. Also, nano-metal oxides were prepared by thermal degradation of the metal complexes, and their applications in wastewater treatment were studied through photocatalytic degradation of methylene blue.
2. Experimental
2.1 Materials and methods
All chemicals were of analytical grade (BDH, Sigma or Aldrich) and were used as received without further purification. Elemental microanalysis (C, H, and N) was performed using a PerkinElmer-2400 elemental analyzer at Main Defense Chemical Laboratory. Infrared spectra were registered on a JASCO FTIR-6300 spectrophotometer in the range of 4000 to 400 cm−1 to investigate the infrared spectral bands. The 1H-NMR spectra were recorded in DMSO-d6 on a Bruker NMR spectrometer at 600 MHz. Fast atom bombardment (FAB) mass spectra for the ligand and its La(III) and Gd(III) complexes were acquired using a spectrometer. The electronic absorption spectral bands were revealed in Nujol mulls using Varian Vary 5000 UV-Vis spectrophotometer. Molar conductance measurements of the complexes in 10−3 M DMSO were performed using a Tacussel CD6N conductimeter. The magnetic susceptibility was measured at room temperature by a modified Gouy method using a Johnson Mathey magnetic susceptibility balance. A Shimadzu DAT/TG-50 thermal analyzer was used to conduct the thermogravimetric analysis (TG and DTG) under certain conditions (a heating rate of 10 °C min−1 under nitrogen and oxygen atmosphere with a flowing rate of 20 ml min−1 from room temperature to 900 °C using platinum crucibles). Melting points were detected by a Stuart melting point apparatus. The X-ray diffraction (XRD) measurements for the MONPs were performed using an Bruker D8 Advance diffractometer with a copper target and nickel filter with CuKα radiation (k = 0.154056 nm). Measurements were performed in the 2θ range of 20° to 80°. The morphology of the CeO2 nanoparticles was obtained by transmission electron microscopy (TEM) with a JEOL JEM 1230 (JEOL Ltd., Japan) operating at 120 kV. The average particle size was determined statistically by manually counting 90 particles.
2.2 Synthesis of 4-methylbenzoylhydrazide ligand (HL)
The ligand was prepared as reported.13 The reaction was performed by dissolving 4-toulic acid in ethanol in the presence of conc. sulfuric acid as a catalyst to yield the ester derivative. Then, an excess of hydrazine hydrate was added. The reaction mixture was refluxed for 4 h. The solid ligand was filtered, washed, and recrystallized from methanol to afford pale yellow crystals which were finally dried under vacuum over anhydrous calcium chloride. The measured melting point was 164 °C.
2.3 Synthesis of the lanthanide(III) complexes
The complexes were synthesized by adding an appropriate ethanolic solution of M(NO3)3·nH2O (M = La(III), Ce(III), Sm(III), Gd(III) and Ho(III), n = 3 to 6) to an ethanolic solution of ligand with a molar ratio of 1![[thin space (1/6-em)]](https://www.rsc.org/images/entities/char_2009.gif) :
:![[thin space (1/6-em)]](https://www.rsc.org/images/entities/char_2009.gif) 3 (M
3 (M![[thin space (1/6-em)]](https://www.rsc.org/images/entities/char_2009.gif) :
:![[thin space (1/6-em)]](https://www.rsc.org/images/entities/char_2009.gif) L). The mixture was stirred for three hours at 50 °C, then filtered, washed and completely dried under vacuum over anhydrous CaCl2.
L). The mixture was stirred for three hours at 50 °C, then filtered, washed and completely dried under vacuum over anhydrous CaCl2.
2.4 Preparation of metal oxide nanoparticles
In a typical procedure, certain amounts of La(III), Ce(III), Sm(III), Gd(III) and Ho(III) complexes were maintained inside a crucible and heated to 600 °C under air in a muffle furnace for 60 minutes (heating rate: 10 °C min−1). The thermal degradation of the coordinated precursors resulted in the formation of their analogue metal oxides. The produced oxides were cooled to room temperature and then collected for analysis.
2.5 Photocatalytic activity
The photodegradation test for methylene blue dye (model pollutant) was performed as follows: CeO2 nanoparticles (10 mg/100 ml) were dispersed in methylene blue aqueous solution (10 ppm) using a sonicator for 20 minutes in the dark to exclude the adsorption results. After that, the solution was irradiated with a UV lamp (6 W at a wavelength of 254 nm). Aliquots of 5.0 ml of the tested solution were collected each 20 min, centrifuged at 5000 rpm to monitor absorbance changes, then analyzed spectrophotometrically to detect the absorbance changes as a function of irradiation time.
3. Results and discussion
3.1 Analytical data
Table 1 presents the analytical data of the prepared lanthanide(III) nitrate complexes. The prepared complexes have the chemical formulas [La(HL)2(NO3)2]·NO3·EtOH, [Ce(HL)3(NO3)2]·NO3, [Sm(HL)3(NO3)2]·NO3·H2O, [Gd(HL)3(NO3)2]·NO3·0.5H2O and [Ho(HL)3(NO3)2]·NO3·0.5EtOH. The complexes are stable in air and non-hydroscopic. All the chelates showed solubility in polar and nonpolar solvents. The molar conductance values of the complexes were in the range of 52 to 56 Ω−1 cm2 mol−1, which demonstrates the uni-electrolytic properties of all the complexes.14
Table 1 Analytical data and molar conductance values of 4-methylbenzoylhydrazide (HL) and its metal complexes
| No. |
Compound |
Colour, F. W. |
Elemental analysis, F (cal.)% |
Mp |
Aa |
| C |
H |
N |
| (Ω−1 cm2 mol−1). |
| |
HL1·0.5H2O, C8H11N2O1.5 |
Off-white, 159.19 |
60.67, (60.36) |
6.42, (6.96) |
17.64, 17.59 |
132 |
— |
| 1 |
[La(HL)2(NO3)3]·EtOH, C18H26N7O9La |
White, 623.35 |
34.49, (34.40) |
3.67, (3.95) |
15.05, (14.78) |
222 |
42 |
| 2 |
[Ce(HL)3(NO3)2]·NO3, C24H30N9O12Ce |
White, 812.67 |
36.96, (37.11) |
3.94, (3.89) |
16.22, (16.23) |
238 |
52 |
| 3 |
[Sm(HL)3(NO3)2]·NO3·H2O, C24H32N9O13Sm |
White, 804.93 |
35.66, (35.81) |
4.00, (4.01) |
16.09, (15.67) |
246 |
56 |
| 4 |
[Gd(HL)3(NO3)2]·NO3·0.5H2O, C24H31N9O12.5Gd |
White, 802.81 |
36.06, (35.91) |
3.82, (3.89) |
15.69, (15.75) |
248 |
55 |
| 5 |
[Ho(HL)3(NO3)2]·NO3·0.5EtOH, C25H32N9O12.5Ho |
White, 854.52 |
35.99, (35.13) |
3.82, (3.77) |
15.68, (14.75) |
250 |
54 |
3.2 Spectral studies
3.2.1 Mass spectra. The FAB mass spectra of the ligand is shown in Fig. 1. The FAB mass spectrum of the hydrazide ligand (Fig. 1) contains a molecular ion peak at m/z 150.0 amu, which matches the theoretical molecular weight of the ligand without solvent. This proved its formation. Also, the spectrum exhibited other degradation peaks at 119, 91.05, 76, and 55 amu, which are assignable to [C8H7O]+, [C7H7]+, [C6H4]+ and 4.5C, respectively; this is compatible with Scheme 1. The mass spectra of the La(III) and Gd(III) complexes are consistent with the formulae [La(HL)2(NO3)3]·EtOH and [Gd(HL)3(NO3)2]·NO3·0.5H2O, giving parent molecular ions at m/z 623 and 803, respectively; this confirms the theoretical data.
 |
| | Fig. 1 FAB mass spectrum of the ligand. | |
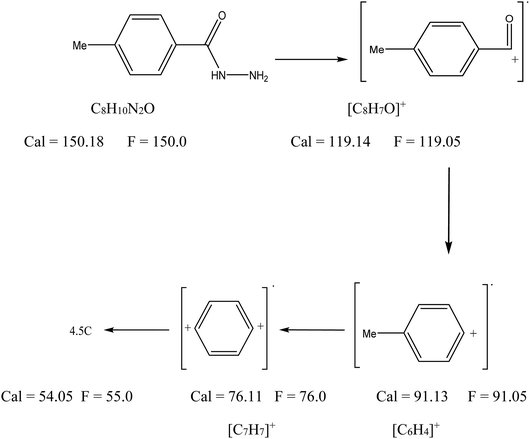 |
| | Scheme 1 Mass ion of the HL ligand and its fragmentation. | |
3.2.2 1H-NMR. The 1H-NMR spectrum of the ligand (HL) and its lanthanum(III) complex are compiled in Table 2 and represented in Fig. 2. The spectrum of the ligand exhibits signals at δ, ppm: 2.32 (3H, s, CH3), 4.52 (2H, s, NH2), 7.22 to 7.82 (4H, s, Ar-CH) and 9.69 (1H, s, NH).15,16 In comparison, the spectrum of the La(III) complex shows signals at 2.92, 4.80, and 9.77 ppm, which are assigned to CH3, NH2, and NH, respectively. The NH2 signal shifted downfield relative to the uncoordinated ligand, confirming its involvement in chelation. The absence of a signal at 12 to 14 ppm assigned to the enolic OH suggests that the ligand chelated with metal ion in its neutral keto structure.
Table 2 1H NMR spectra of hydrazide ligand (HL) and its La(III) complex
| (HL) |
La(III) complex |
Assignment |
| 2.32 |
2.33–2.49 |
3H of 2(CH3) |
| 4.52 |
4.80 |
2H of (NH2) |
| 7.22–7.82 |
7.23–7.72 |
H of (CH) |
| 9.69 |
9.77 |
1H of (NH) |
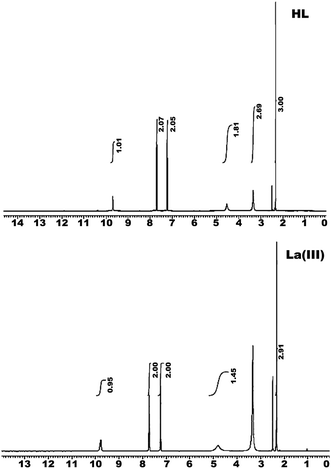 |
| | Fig. 2 1H NMR spectra of the hydrazide ligand (HL) and its La(III) complex. | |
3.2.3 Infrared spectra of the ligand (HL) and its metal complexes. The fundamental spectral bands and their assignments of the ligand and its metal complexes are tabulated in Table 3 and diagrammed in Fig. 3. The spectrum of the ligand contains strong bands at 3306, 3222, 3027, 1616, and 1503 cm−1; 1042 and 922 cm−1; and 787, 719 and 446 cm−1, which can be assigned to υasy(NH2), υsy(NH2), υ(NH), δ(NH2), and δ(NH)amide; υ(N–N), γ(NH2), and γ(NH)amide; and ρ(NH2), respectively.16 The carbonyl groups are assigned to strong bands located at 1659 and 677 cm−1, 633 cm−1 and 522 cm−1, attributed to υ(C![[double bond, length as m-dash]](https://www.rsc.org/images/entities/char_e001.gif) O), δ(C
O), δ(C![[double bond, length as m-dash]](https://www.rsc.org/images/entities/char_e001.gif) O), and γ(C
O), and γ(C![[double bond, length as m-dash]](https://www.rsc.org/images/entities/char_e001.gif) O), respectively. The spectrum of the ligand exhibits the presence of fundamental bands corresponding to NH and C
O), respectively. The spectrum of the ligand exhibits the presence of fundamental bands corresponding to NH and C![[double bond, length as m-dash]](https://www.rsc.org/images/entities/char_e001.gif) O (υ, δ, γ) with the absence of υ(OH); this indicates that the ligand has a keto structure. The spectrum of the ligand shows additional fundamental bands at 2920 and 2878 cm−1 due to the υ(CH) aromatic and methyl groups, respectively. Comparison of the spectral bands of the ligand with those of its metal complexes led to the following observations: υasy, υsy, and δ of the NH2 and υ(C
O (υ, δ, γ) with the absence of υ(OH); this indicates that the ligand has a keto structure. The spectrum of the ligand shows additional fundamental bands at 2920 and 2878 cm−1 due to the υ(CH) aromatic and methyl groups, respectively. Comparison of the spectral bands of the ligand with those of its metal complexes led to the following observations: υasy, υsy, and δ of the NH2 and υ(C![[double bond, length as m-dash]](https://www.rsc.org/images/entities/char_e001.gif) O) groups of the ligand undergo blue shifts at 10 to 13 cm−1 upon complexation. However, δ(C
O) groups of the ligand undergo blue shifts at 10 to 13 cm−1 upon complexation. However, δ(C![[double bond, length as m-dash]](https://www.rsc.org/images/entities/char_e001.gif) O) of the ligand at 617 cm−1 disappeared, while the second one at 633 cm−1 shifted to lower values by 5 to 17 cm−1 upon complexation.
O) of the ligand at 617 cm−1 disappeared, while the second one at 633 cm−1 shifted to lower values by 5 to 17 cm−1 upon complexation.
Table 3 Infrared spectral bands (cm−1) and their assignments for hydrazide ligand (HL) and its metal complexesa
| No. |
Compound |
υas (NH2) |
υsy (NH2), γ(NH2) |
υamide (NH), γ(NH) |
υ(C![[double bond, length as m-dash]](https://www.rsc.org/images/entities/char_e001.gif) O) O) |
δ(NH2) |
υ(N–N) |
δ(C![[double bond, length as m-dash]](https://www.rsc.org/images/entities/char_e001.gif) O), γ(C O), γ(C![[double bond, length as m-dash]](https://www.rsc.org/images/entities/char_e001.gif) O) O) |
γ(C![[double bond, length as m-dash]](https://www.rsc.org/images/entities/char_e001.gif) O), υ(M–O) O), υ(M–O) |
ρ(NH2), υ(M–N) |
NO3− band |
| Ionic |
υ4 |
υ1 |
| vw: very weak, w: weak, m: medium, s: strong, b: broad, sh: shoulder. |
| |
(HL)0.5H2O |
3306(s) |
3222(s), 787(w) |
3027(s), 719(s) |
1659(s) |
1616(s) |
1042(w), 992(s) |
677(m), 633(s) |
522 |
446(m) |
|
| 1 |
[La(HL)2(NO3)3]·EtOH |
3295(m) |
3216(m), 792(vw) |
3060(vw), 778(w) |
1647(m) |
1603(m) |
1034(vw), — |
—, 6159(w) |
516 |
— |
1384 |
1466 |
1210 |
| 2 |
[Ce(HL)3(NO3)2]·NO3 |
3295(b, m) |
3210(w), 792(w) |
3022(w), 778(w) |
1648(m) |
1605(m) |
1034(vw), — |
613(w) |
518 |
462(w) |
1384 |
1464 |
1208 |
| 3 |
[Sm(HL)3(NO3)2]·NO3·H2O |
3295(w) |
3207(w), 792(vw) |
—, 748(w) |
1648(s) |
1603(sh) |
1037(vw), — |
—, 621(m) |
528 |
463(w) |
1382 |
1465 |
1212 |
| 4 |
[Gd(HL)3(NO3)2]·NO3·0.5H2O |
3297(w) |
3210(w), — |
—, 748(w) |
1646(s) |
1606(s) |
1038(vw), — |
—, 630(m) |
527 |
472(w) |
1383 |
1465 |
1212 |
| 5 |
[Ho(HL)3(NO3)2]·NO3·0.5EtOH |
3297(m) |
3208(m), 794(vw) |
—, 748(m) |
1649(s) |
1606(w) |
1038(w) |
—, 628(m) |
528 |
463(w) |
1383 |
1463 |
1210 |
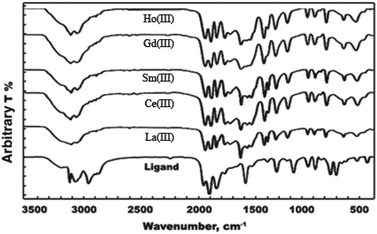 |
| | Fig. 3 IR spectra of the ligand and its metal complexes. | |
The above assignments indicate that the metal ions attach to the ligand via carbonyl oxygen and amino nitrogen atoms, leading to the construction of five-membered rings. The ligand bands at 522 and 446 cm−1 due to γ(C![[double bond, length as m-dash]](https://www.rsc.org/images/entities/char_e001.gif) O) and ρ(NH2) exhibit shifts in the ranges of 518 to 528 and 462 to 472 cm−1 upon complexation, which are attributed to υ(M–O) and υ(M–N), respectively.17 The absorption bands appearing at around 1380 and 784 cm−1 in the spectra of the investigated complexes are assigned to the ionic nitrate group.14 The complexes exhibit absorption bands in the regions of 1463 to 1466 cm−1 and 1208 to 1212 cm−1; these are not observed in the spectrum of the ligand and can be assigned to υ4 and υ1, respectively. This situation suggests that the nitrate ions are covalently bonded and are located in the coordination sphere; this indicates that the magnitude of separation Δυ = υ1 − υ4 is sufficiently greater than 200 cm−1, considering that the nitrate groups are covalently bonded to the metal ion in bidentate fashion. The data show that the lanthanide nitrate complexes contain both coordinated and ionic nitrate groups, which confirms the chemical formulae.
O) and ρ(NH2) exhibit shifts in the ranges of 518 to 528 and 462 to 472 cm−1 upon complexation, which are attributed to υ(M–O) and υ(M–N), respectively.17 The absorption bands appearing at around 1380 and 784 cm−1 in the spectra of the investigated complexes are assigned to the ionic nitrate group.14 The complexes exhibit absorption bands in the regions of 1463 to 1466 cm−1 and 1208 to 1212 cm−1; these are not observed in the spectrum of the ligand and can be assigned to υ4 and υ1, respectively. This situation suggests that the nitrate ions are covalently bonded and are located in the coordination sphere; this indicates that the magnitude of separation Δυ = υ1 − υ4 is sufficiently greater than 200 cm−1, considering that the nitrate groups are covalently bonded to the metal ion in bidentate fashion. The data show that the lanthanide nitrate complexes contain both coordinated and ionic nitrate groups, which confirms the chemical formulae.
3.2.4 Electronic absorption spectra. The electronic spectral data of the hydrazide organic compound (HL) and its metal chelates in Nujol mulls are reported in Table 4 and demonstrated in Fig. 4. The electronic spectrum of the ligand displays spectral bands in the range of 272 to 240 nm and at 296 nm, assigned to the π–π* and n–π* electronic transitions of the entire conjugate system of the ligand, respectively. On the other hand, the electronic spectra of the metal chelates (1–5) display π–π* and n–π* transitions of the ligand, which are shifted to higher values upon complexation; this indicates that chelation was achieved. None of the spectra of the complexes showed bands in the visible region. This is probably due the fact that the f–f bands are weak and obscured by the intense charge transfer bands.18,19 The magnetic moments of the lanthanide(III) complexes indicate that only the La(III) complex is diamagnetic, and the other tripositive lanthanide ion complexes are paramagnetic.
Table 4 Electronic absorption spectra and magnetic moment values of the ligand and its complexes
| No. |
Compound |
Electronic spectral bands (nm) |
Assignment |
μ/μB |
| |
(HL)0.5H2O |
296, 272, 240 |
N–π*, π–π* |
— |
| 1 |
[La(HL)2(NO3)3]·EtOH |
308, 284, 242 |
n–π*, π–π* |
Diam |
| 2 |
[Ce(HL)3(NO3)2]·NO3 |
297, 287, 242 |
n–π*, π–π* |
3.09 |
| 3 |
[Sm(HL)3(NO3)2]·NO3·H2O |
313, 284, 242 |
n–π*, π–π* |
3.69 |
| 4 |
[Gd(HL)3(NO3)2]·NO3·0.5H2O |
312, 284, 246 |
n–π*, π–π* |
7.91 |
| 5 |
[Ho(HL)3(NO3)2]·NO3·0.5EtOH |
312, 284, 242 |
n–π*, π–π* |
10.78 |
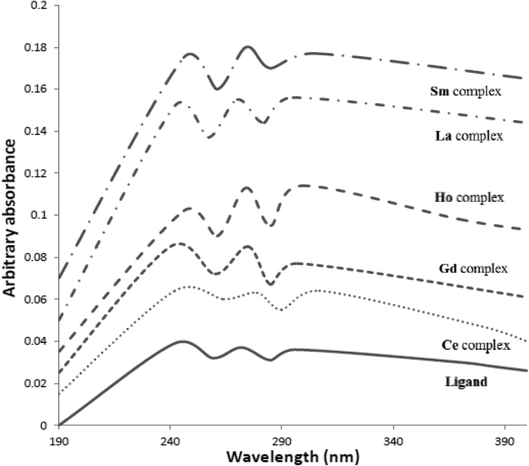 |
| | Fig. 4 Electronic absorption spectra of the ligand and its complexes. | |
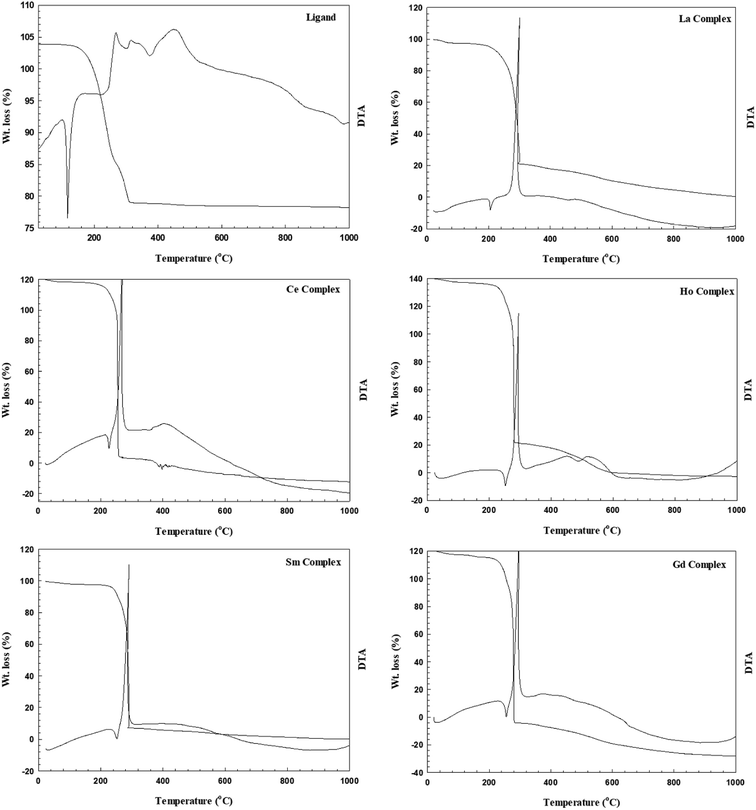
3.2.5 Thermal analysis of the metal complexes. The thermograms (TG, DTA) gathered with thermoanalytical data and their assignments for each decomposition step to follow the decomposition pathways for the ligand and its metal complexes are given in Table 5 and Fig. 5. The TGA curve of the ligand shows thermal stability up to 109 °C followed by a small weight loss of 2.70% up to 163 °C, corresponding to the release of 0.25 mol of H2O. The pyrolytic process was achieved through two steps by TG weight losses of 69.37% and 26.13% and DTA peaks at Tmax = 180 °C and 292 °C, respectively. The DTA curve displays a sharp endothermic peak at 132 °C, which is assignable to the melting point of the compound and corresponds with the measured value. The thermoanalytical data in Table 5 combined with the TG and DTA patterns of the La(III), Sm(III), Gd(III), and Ho(III) complexes show that these complexes decompose in a similar way, indicating that they are isothermal.
Table 5 Thermal decomposition of the ligand and its metal complexes
| No. |
Compound |
TG range (°C) |
DTA peak (°C) |
Mass loss% found (calcd.) |
Assignment |
TS (°C) |
| Dehydration. Desolvation. Decomposition. Remain. |
| 1 |
(HL)·0.5H2O |
109–163 |
|
2.70 (2.83) |
Loss of 0.25 mol of H2Oa |
163 |
| 163–292 |
|
69.37 (70.14) |
Ligand pyrolysisc |
|
| 292–322 |
|
26.13 (24.52) |
Complete ligand pyrolysisc |
|
| 2 |
[La(HL)2(NO3)3]·EtOH |
30–228 |
|
7.39 (8.18) |
Loss of 1 mol of EtOHb |
228 |
| 228–325 |
293 |
55.21 (55.90) |
Loss of 1 mol of L + 2 mol of NO3− + 1 mol of NO2c |
|
| 325–787 |
487 |
18.95 (17.73) |
Complete ligand pyrolysisc |
|
| At 787 |
|
18.44 (18.91) |
0.5La2O3d |
|
| 3 |
[Ce(HL)3(NO3)2]·NO3 |
30–206 |
|
7.49 (7.63) |
Loss of 1 mol of NO3−b |
206 |
| 206–250 |
231 |
63.80 (63.56) |
Loss of 2 mol of L + 2 mol of NO3−c |
|
| 250–466 |
387 |
7.06 (6.89) |
Complete L pyrolysisc |
|
| At 466 |
|
20.65 (20.19) |
0.5Ce2O3d |
|
| 4 |
[Sm(HL)3(NO3)2]·NO3·H2O |
30–217 |
|
2.60 (2.24) |
Loss of 1 mol of H2Oa |
217 |
| 217–297 |
257 |
56.93 (58.43) |
Loss of 2 mol of L + 2 mol of NO3− + 1 mol of NO2c |
|
| 297–692 |
467 |
19.34 (17.92) |
Complete ligand pyrolysisc |
|
| At 692 |
|
21.41 (21.67) |
0.5Sm2O3d |
|
| 5 |
[Gd(HL)3(NO3)2]·NO3·0.5H2O |
30–267 |
|
1.36 (1.12) |
Loss of 0.5 mol of H2Oa |
267 |
| 267–334 |
290 |
64.81 (65.07) |
Loss of 2 mol of L + 1 mol of NO3− + 1 mol of NO2 |
|
| 334–893 |
453 |
11.55 (11.23) |
Complete ligand pyrolysisc |
|
| At 893 |
|
22.41 (22.58) |
0.5Gd2O3d |
|
| 6 |
[Ho(HL)3(NO3)2]·NO3·0.5EtOH |
30–234 |
|
2.70 (2.81) |
Loss of 0.5EtOHb |
234 |
| 234–300 |
174 |
64.42 (63.89) |
Loss of 2 mol of L + 2 mol of NO3− + 1 mol of NO2c |
|
| 300–575 |
264 |
11.01 (11.23) |
Complete ligand pyrolysisc |
|
| At 575 |
452 |
22.11 (22.08) |
0.5Ho2O3d |
|
 |
| | Fig. 5 Thermograms of the ligand and its metal complexes. | |
The TG curves showed weight losses in the temperature range of 30 °C to 234 °C due to removal of the solvents of crystallization. After that, the chelates decomposed in two consecutive stages. The first stage exhibited weight losses of 55.21%, 56.90%, 64.80% and 64.42% from 228 °C to 325 °C, 217 °C to 297 °C, 214 °C to 334 °C and 234 °C to 300 °C for La(III), Sm(III), Gd(III) and Ho(III), respectively. This process is associated with sharp exothermic DTA peaks at Tmax = 293 °C, 257 °C, 290 °C, and 264 °C, respectively; this signifies that the oxidative process of the ligand involves the release of two moles of organic ligand (one mole in the La(III) complex), two moles of NO3 groups and one mole of NO2 gas. The last ligand pyrolysis was characterized by TG weight losses of 18.93%, 19.34%, 11.55% and 11.01% up to 787 °C, 692 °C, 893 °C and 575 °C for the La(III), Sm(III), Gd(III) and Ho(III) complexes, respectively. The thermal decomposition process ended with the formation of 0.5 M2O3 (M = La(III), Sm(III), Gd(III) and Ho(III)). However, the TG curves of the Ce(III) complex reveal a weight loss of 7.49% in the 30 °C to 206 °C range due to elimination of the ionic nitrate group. This step was followed by a TG weight loss of 63.8% up to 250 °C. This process was accompanied by two exothermic DTA peaks at Tmax = 231 °C to 253 °C, indicating the oxidation of the ligands with removal of two moles of the ligand and two moles of the coordinated nitrate group. The last decomposition step exerted a TG weight loss of 6.89% in the 250 °C to 466 °C range due to complete ligand pyrolysis, and the metal reacts with atmospheric oxygen to produce 0.5Ce2O3 as a product. This process is associated with the exothermic DTA peak at Tmax = 387 °C.
3.3 Characterization of nanoparticles
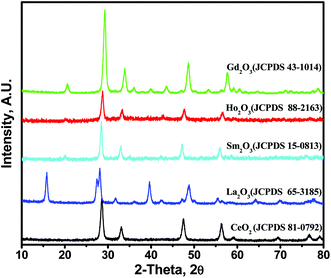
In Fig. 6, the diffraction peaks for CeO2 at 28.5°, 33.0°, 47.4° and 56.3° can be indexed to the (111), (200), (220) and (311) planes of the face-centered cubic structure of CeO2 (JCPDS no. 81-0792). For the La2O3 NPs, the peaks obtained at 28.67°, 31.21°, 43.28°, 47.86°, 59.29°, 64.97° and 70.12° are indexed to the (002), (400), (125), (600), (127), (800) and (822) planes, respectively, and assigned as per JCPDS no. 65-3185.20 For the Sm2O3 NPs, the diffraction peaks located at 28.2°, 32.7°, 38.6°, 45.4°, and 54.3° correspond to the (222), (400), (332), (521), and (541) planes of cubic Sm2O3 (JCPDS no. 15-0813), respectively.21 For the Ho2O3 NPs, diffraction lines of cubic holmium oxide (JCPDS card 88-2163) were obtained.22 For the Gd2O3 NPs, the pattern was well-indexed with the cubic structure reported in the standard JCPDS card no. 43-1014.23 No diffraction peaks of any impurity were observed, indicating the high purity of the final products. These results suggest that the precursor samples crystallized into their analogous oxide nanoparticles at a heating temperature of 700 °C. The crystallite sizes for the lanthanide oxide NPs were calculated using the Debye–Scherrer equation:24| |
D = kλ/(β![[thin space (1/6-em)]](https://www.rsc.org/images/entities/char_2009.gif) cos cos![[thin space (1/6-em)]](https://www.rsc.org/images/entities/char_2009.gif) θ) θ)
| (1) |
where k is a shape factor (k = 0.89), λ is the wavelength of the radiation, β is the full width at half maximum (FWHM) and θ is the angle corresponding to the most intense peak in the XRD pattern. The crystallite sizes were found to be 2.9 nm, 3.7 nm, 4.2 nm, 3.8 nm and 3.3 nm for the CeO2, La2O3, Sm2O3, Ho2O3 and Gd2O3 NPs, respectively.
 |
| | Fig. 6 X-ray diffraction patterns of the prepared lanthanide oxide nanoparticles. | |
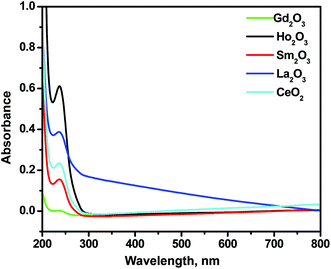
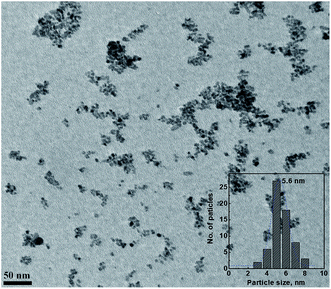
The absorption spectra for the prepared lanthanide oxide nanoparticles were measured, as shown in Fig. 7. All the nanoparticles showed similar absorption behavior, with a strong absorption peak at ∼240 to 250 nm, which is consistent with the literature. The band gap energy values for the lanthanide oxide nanoparticles were calculated using Tauc plots by applying the equation (αhν)1/n = A(hν − Eg), where h is Planck's constant, ν is the photon frequency, α is the absorption coefficient, Eg is the band gap, the exponent n denotes the nature of the electronic transition (direct or indirect), and A is a proportionality constant. The calculated values were found to be in the range of 4.64 to 4.85 eV. The increase of the band gap can be attributed to the quantum confinement effect, which led to decreased charge carrier recombination rates.20 The sizes and morphologies of the CeO2 nanoparticles were investigated by TEM. The TEM image of CeO2 is shown in Fig. 8. From the figure, the nanoparticles can be found to be monodisperse and spherical, with an average particle size of 5.6 nm.
 |
| | Fig. 7 UV-Vis absorption spectra of the prepared lanthanide oxide nanoparticles. | |
 |
| | Fig. 8 TEM image of the CeO2 nanoparticles. The inset is the size distribution for CeO2 nanoparticles. | |
3.4 Photocatalytic activity
Because all the prepared NPs revealed the same absorption spectra and band gap energy values, in this work, the CeO2 NPs were chosen for evaluation as a photocatalyst due to their smaller particle size relative to the other metal oxides. Photocatalytic degradation of MB dye using the CeO2 NPs as a model photocatalyst was performed to evaluate their photocatalytic activity. Fig. 9 shows the photocatalytic activity of the CeO2 NPs. The photo degradation efficiency was calculated to be 90.1%, as shown in Fig. 9B. Fig. 9C showed that the photodegradation reaction follows pseudo-first-order kinetics. The photodegradation rate constant for the photodegradation reaction was determined from the equation:where Co and C are the initial concentration and the concentration at time t, respectively, and k is the apparent first-order rate constant. The plot of ln(Co/C) versus time represents a straight line, as shown in Fig. 9C; the slope upon linear regression equals the apparent first-order rate constant k. The degradation rate obtained was 0.014 min−1. To evaluate the photostability of CeO2, four photodegradation experiments (reusability tests) under identical conditions were performed. From Fig. 9D, it can be noted that CeO2 was almost completely stable and photoactive up to the 4th run, as its photocatalytic activity decreased by only 15% after the 4th run.
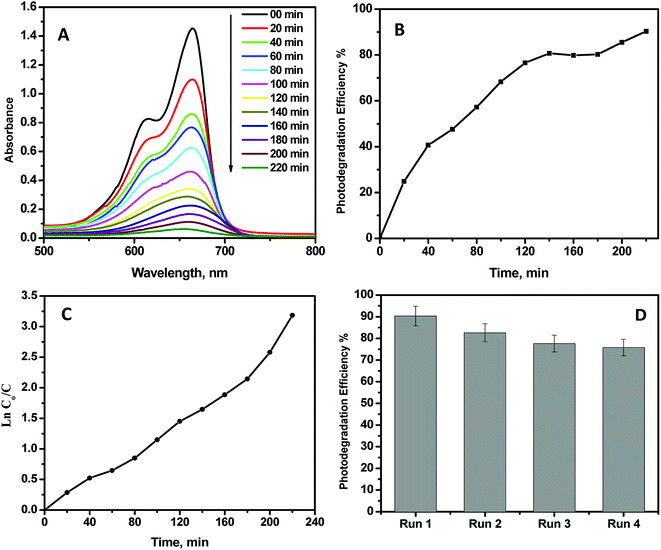 |
| | Fig. 9 (A) Methylene blue dye absorption spectra at different times upon irradiation with CeO2. (B) Evaluation of MB conversion efficiency upon irradiation. (C) Kinetics of MB photocatalytic degradation. (D) Reusability of CeO2 nanoparticles. | |
4. Conclusion
In this work, a series of metal complexes were prepared by separate reactions of lanthanide nitrate salts (La(III), Ce(III), Sm(III), Gd(III) and Ho(III)) with 4-methylbenzoylhydrazide. The structures of the complexes were confirmed by analytical studies, different spectral measurements and thermal studies. Complexes were formed with different stoichiometries of 1![[thin space (1/6-em)]](https://www.rsc.org/images/entities/char_2009.gif) :
:![[thin space (1/6-em)]](https://www.rsc.org/images/entities/char_2009.gif) 2 and 1
2 and 1![[thin space (1/6-em)]](https://www.rsc.org/images/entities/char_2009.gif) :
:![[thin space (1/6-em)]](https://www.rsc.org/images/entities/char_2009.gif) 3 (M
3 (M![[thin space (1/6-em)]](https://www.rsc.org/images/entities/char_2009.gif) :
:![[thin space (1/6-em)]](https://www.rsc.org/images/entities/char_2009.gif) L). The coordination compounds were converted to metal oxide nanoparticles (MONPs) through solid state thermal decomposition as monocular source precursors. The obtained MONPs were investigated via XRD, TEM and UV-Vis spectral analyses. CeO2 was utilized as a representative nanophotocatalyst to examine the photocatalytic activity of the MONPs in methylene blue (MB) photodegradation. The CeO2 catalyst showed high MB removal of 90.1% after UV illumination for 220 min. The reported method provides a generalized and systematic method for the preparation of many nanoparticle metal oxides with manageable and reproducible features.
L). The coordination compounds were converted to metal oxide nanoparticles (MONPs) through solid state thermal decomposition as monocular source precursors. The obtained MONPs were investigated via XRD, TEM and UV-Vis spectral analyses. CeO2 was utilized as a representative nanophotocatalyst to examine the photocatalytic activity of the MONPs in methylene blue (MB) photodegradation. The CeO2 catalyst showed high MB removal of 90.1% after UV illumination for 220 min. The reported method provides a generalized and systematic method for the preparation of many nanoparticle metal oxides with manageable and reproducible features.
Conflicts of interest
There are no conflicts to declare.
Acknowledgements
The authors gratefully acknowledge RSPU at Kuwait University, Facilities No. GS 01/01, GS 01/03, GS 01/05, GS 02/01, GS 02/08, GS 03/01 and GE 03/08. The Nanoscopy Science Center is also highly acknowledged.
References
- S. A. Galal, K. H. Hegab, A. S. Kassab, M. L. Rodriguez, S. M. Kerwin, A.-M. m. A. El-Khamry and H. I. El Diwani, Eur. J. Med. Chem., 2009, 44, 1500–1508 CrossRef CAS PubMed.
- J.-C. G. Bünzli and S. V. Eliseeva, J. Rare Earths, 2010, 28, 824–842 CrossRef.
- J.-C. G. Bünzli, Chem. Rev., 2010, 110, 2729–2755 CrossRef PubMed.
- P. Starynowicz and J. Lisowski, Polyhedron, 2015, 85, 232–238 CrossRef CAS.
- Q.-L. Guan, Y.-H. Xing, J. Liu, W.-J. Wei, R. Zhang, X. Wang and F.-Y. Bai, J. Inorg. Biochem., 2013, 128, 57–67 CrossRef CAS PubMed.
- M. Albrecht, O. Osetska and R. Fröhlich, Dalton Trans., 2005, 3757–3762 RSC.
- R. Wai-Yin Sun, D.-L. Ma, E. L.-M. Wong and C.-M. Che, Dalton Trans., 2007, 4884–4892 RSC.
- M. Madkour, Y. K. Abdel-Monem and F. Al Sagheer, Ind. Eng. Chem. Res., 2016, 55, 12733–12741 CrossRef CAS.
- Y. K. Abdel-Monem, S. M. Emam and H. M. Y. Okda, J. Mater. Sci.: Mater. Electron., 2017, 28, 2923–2934 CrossRef CAS.
- Y. K. Abdel-Monem, J. Mater. Sci.: Mater. Electron., 2016, 27, 5723–5728 CrossRef CAS.
- A. Bumajdad, M. Madkour, Y. Abdel-Moneam and M. El-Kemary, J. Mater. Sci., 2014, 49, 1743–1754 CrossRef CAS.
- F. Azeez, E. Al-Hetlani, M. Arafa, Y. Abdelmonem, A. A. Nazeer, M. O. Amin and M. Madkour, Sci. Rep., 2018, 8, 7104 CrossRef PubMed.
- K. K. Jha, A. Samad, Y. Kumar, M. Shaharyar, R. L. Khosa, J. Jain, V. Kumar and P. Singh, Eur. J. Med. Chem., 2010, 45, 4963–4967 CrossRef CAS PubMed.
- F. B. Tamboura, O. Diouf, A. H. Barry, M. Gaye and A. S. Sall, Polyhedron, 2012, 43, 97–103 CrossRef CAS.
- Y. K. Abdel-Monem, S. A. Abou El-Enein and M. M. El-Sheikh-Amer, J. Mol. Struct., 2017, 1127, 386–396 CrossRef CAS.
- S. M. Emam, S. A. Abouel-Enein and E. M. Abdel-Satar, Appl. Organomet. Chem., 2019, 33, e4847 CrossRef.
- S. A. Abouel-Enein, S. M. Emam and E. Monir, Appl. Organomet. Chem., 2018, 32, e4191 CrossRef.
- S. Alghool, M. S. Zoromba and H. F. A. El-Halim, J. Rare Earths, 2013, 31, 715–721 CrossRef CAS.
- A. K. El-Sawaf, M. A. Azzam, A. M. Abdou and E. H. Anouar, Inorg. Chim. Acta, 2018, 483, 116–128 CrossRef CAS.
- M. Uma, N. Balaram, P. R. Sekhar Reddy, V. Janardhanam, V. Rajagopal Reddy, H.-J. Yun, S.-N. Lee and C.-J. Choi, J. Electron. Mater., 2019, 48, 4217–4225 CrossRef CAS.
- M. Zhang, Y. Yan, W. Han, X. Li, Z. Hou, Y. Tian, K. Ye, L. Bao, X. Li and Z. Zhang, RSC Adv., 2012, 2, 1585–1591 RSC.
- S. Zinatloo-Ajabshir, S. Mortazavi-Derazkola and M. Salavati-Niasari, Int. J. Hydrogen Energy, 2017, 42, 15178–15188 CrossRef CAS.
- A. Kumar, J. C. G. E. da Silva, K. Kumar, H. C. Swart, S. K. Maurya, P. Kumar and S. P. Tiwari, Mater. Res. Bull., 2019, 112, 28–37 CrossRef CAS.
- A. A. Ali, A. A. Nazeer, M. Madkour, A. Bumajdad and F. Al Sagheer, Arabian J. Chem., 2018, 11, 692–699 CrossRef CAS.
|
| This journal is © The Royal Society of Chemistry 2019 |
Click here to see how this site uses Cookies. View our privacy policy here.  Open Access Article
 *a,
A. M. Alia,
Y. K. Abdel-Monema,
M. H. Sennab and
Metwally Madkour
 *c
*c
![[thin space (1/6-em)]](https://www.rsc.org/images/entities/char_2009.gif) :
:![[thin space (1/6-em)]](https://www.rsc.org/images/entities/char_2009.gif) 2 and 1
2 and 1![[thin space (1/6-em)]](https://www.rsc.org/images/entities/char_2009.gif) :
:![[thin space (1/6-em)]](https://www.rsc.org/images/entities/char_2009.gif) 3 (M
3 (M![[thin space (1/6-em)]](https://www.rsc.org/images/entities/char_2009.gif) :
:![[thin space (1/6-em)]](https://www.rsc.org/images/entities/char_2009.gif) L). The ligand chelates by the nitrogen and oxygen atoms of the amino and carbonyl groups of the hydrazide moiety in the neutral keto form. The coordination compounds were converted to metal oxide nanoparticles (MONPs) through solid state thermal decomposition as monocular source precursors. The obtained MONPs were investigated via XRD, TEM and UV-Vis spectra. As a representative, CeO2 was utilized as a nanophotocatalyst to examine the photocatalytic activity of the MONPs for methylene blue (MB) photodegradation. CeO2 showed high removal of MB dye by 90.1% after UV illumination for 220 min. The reported method provides a generalized and systematic method for the preparation of many metal oxide nanoparticles with manageable and reproducible features.
L). The ligand chelates by the nitrogen and oxygen atoms of the amino and carbonyl groups of the hydrazide moiety in the neutral keto form. The coordination compounds were converted to metal oxide nanoparticles (MONPs) through solid state thermal decomposition as monocular source precursors. The obtained MONPs were investigated via XRD, TEM and UV-Vis spectra. As a representative, CeO2 was utilized as a nanophotocatalyst to examine the photocatalytic activity of the MONPs for methylene blue (MB) photodegradation. CeO2 showed high removal of MB dye by 90.1% after UV illumination for 220 min. The reported method provides a generalized and systematic method for the preparation of many metal oxide nanoparticles with manageable and reproducible features.![[double bond, length as m-dash]](https://www.rsc.org/images/entities/char_e001.gif) O, NH and NH2 have the ability to coordinate with different metal ions.1 Hydrazides and their derivative metal complexes have applications in biological fields as insecticidal, acaricidal, nematicidal, and antileishmanial agents and inhibit protease enzymes in some parasitic species and diamine oxidases.1 Their lanthanide complexes have luminescent and magnetic properties; thus, they can be used in electroluminescent devices.2,3 Also, due to their exhibited spectroscopic, magnetic, and chemical properties, these lanthanide complexes have many useful applications compared to other metal complexes. This is due to the fluxional nature of lanthanide(III) ion, which possesses high and variable coordination numbers as well as a lack of angular preference.4 Hydrazide lanthanide complexes are an ongoing area of active research due to their good antioxidant activities and their biological activities, such as anticoagulation, antiallergic, antibacterial, anti-inflammatory and anticancer. Also, they have been used for treatment of burns.5–7
O, NH and NH2 have the ability to coordinate with different metal ions.1 Hydrazides and their derivative metal complexes have applications in biological fields as insecticidal, acaricidal, nematicidal, and antileishmanial agents and inhibit protease enzymes in some parasitic species and diamine oxidases.1 Their lanthanide complexes have luminescent and magnetic properties; thus, they can be used in electroluminescent devices.2,3 Also, due to their exhibited spectroscopic, magnetic, and chemical properties, these lanthanide complexes have many useful applications compared to other metal complexes. This is due to the fluxional nature of lanthanide(III) ion, which possesses high and variable coordination numbers as well as a lack of angular preference.4 Hydrazide lanthanide complexes are an ongoing area of active research due to their good antioxidant activities and their biological activities, such as anticoagulation, antiallergic, antibacterial, anti-inflammatory and anticancer. Also, they have been used for treatment of burns.5–7
![[thin space (1/6-em)]](https://www.rsc.org/images/entities/char_2009.gif) :
:![[thin space (1/6-em)]](https://www.rsc.org/images/entities/char_2009.gif) 3 (M
3 (M![[thin space (1/6-em)]](https://www.rsc.org/images/entities/char_2009.gif) :
:![[thin space (1/6-em)]](https://www.rsc.org/images/entities/char_2009.gif) L). The mixture was stirred for three hours at 50 °C, then filtered, washed and completely dried under vacuum over anhydrous CaCl2.
L). The mixture was stirred for three hours at 50 °C, then filtered, washed and completely dried under vacuum over anhydrous CaCl2.
![[double bond, length as m-dash]](https://www.rsc.org/images/entities/char_e001.gif) O), δ(C
O), δ(C![[double bond, length as m-dash]](https://www.rsc.org/images/entities/char_e001.gif) O), and γ(C
O), and γ(C![[double bond, length as m-dash]](https://www.rsc.org/images/entities/char_e001.gif) O), respectively. The spectrum of the ligand exhibits the presence of fundamental bands corresponding to NH and C
O), respectively. The spectrum of the ligand exhibits the presence of fundamental bands corresponding to NH and C![[double bond, length as m-dash]](https://www.rsc.org/images/entities/char_e001.gif) O (υ, δ, γ) with the absence of υ(OH); this indicates that the ligand has a keto structure. The spectrum of the ligand shows additional fundamental bands at 2920 and 2878 cm−1 due to the υ(CH) aromatic and methyl groups, respectively. Comparison of the spectral bands of the ligand with those of its metal complexes led to the following observations: υasy, υsy, and δ of the NH2 and υ(C
O (υ, δ, γ) with the absence of υ(OH); this indicates that the ligand has a keto structure. The spectrum of the ligand shows additional fundamental bands at 2920 and 2878 cm−1 due to the υ(CH) aromatic and methyl groups, respectively. Comparison of the spectral bands of the ligand with those of its metal complexes led to the following observations: υasy, υsy, and δ of the NH2 and υ(C![[double bond, length as m-dash]](https://www.rsc.org/images/entities/char_e001.gif) O) groups of the ligand undergo blue shifts at 10 to 13 cm−1 upon complexation. However, δ(C
O) groups of the ligand undergo blue shifts at 10 to 13 cm−1 upon complexation. However, δ(C![[double bond, length as m-dash]](https://www.rsc.org/images/entities/char_e001.gif) O) of the ligand at 617 cm−1 disappeared, while the second one at 633 cm−1 shifted to lower values by 5 to 17 cm−1 upon complexation.
O) of the ligand at 617 cm−1 disappeared, while the second one at 633 cm−1 shifted to lower values by 5 to 17 cm−1 upon complexation.
![[double bond, length as m-dash]](https://www.rsc.org/images/entities/char_e001.gif) O)
O)![[double bond, length as m-dash]](https://www.rsc.org/images/entities/char_e001.gif) O), γ(C
O), γ(C![[double bond, length as m-dash]](https://www.rsc.org/images/entities/char_e001.gif) O)
O)![[double bond, length as m-dash]](https://www.rsc.org/images/entities/char_e001.gif) O), υ(M–O)
O), υ(M–O)![[double bond, length as m-dash]](https://www.rsc.org/images/entities/char_e001.gif) O) and ρ(NH2) exhibit shifts in the ranges of 518 to 528 and 462 to 472 cm−1 upon complexation, which are attributed to υ(M–O) and υ(M–N), respectively.17 The absorption bands appearing at around 1380 and 784 cm−1 in the spectra of the investigated complexes are assigned to the ionic nitrate group.14 The complexes exhibit absorption bands in the regions of 1463 to 1466 cm−1 and 1208 to 1212 cm−1; these are not observed in the spectrum of the ligand and can be assigned to υ4 and υ1, respectively. This situation suggests that the nitrate ions are covalently bonded and are located in the coordination sphere; this indicates that the magnitude of separation Δυ = υ1 − υ4 is sufficiently greater than 200 cm−1, considering that the nitrate groups are covalently bonded to the metal ion in bidentate fashion. The data show that the lanthanide nitrate complexes contain both coordinated and ionic nitrate groups, which confirms the chemical formulae.
O) and ρ(NH2) exhibit shifts in the ranges of 518 to 528 and 462 to 472 cm−1 upon complexation, which are attributed to υ(M–O) and υ(M–N), respectively.17 The absorption bands appearing at around 1380 and 784 cm−1 in the spectra of the investigated complexes are assigned to the ionic nitrate group.14 The complexes exhibit absorption bands in the regions of 1463 to 1466 cm−1 and 1208 to 1212 cm−1; these are not observed in the spectrum of the ligand and can be assigned to υ4 and υ1, respectively. This situation suggests that the nitrate ions are covalently bonded and are located in the coordination sphere; this indicates that the magnitude of separation Δυ = υ1 − υ4 is sufficiently greater than 200 cm−1, considering that the nitrate groups are covalently bonded to the metal ion in bidentate fashion. The data show that the lanthanide nitrate complexes contain both coordinated and ionic nitrate groups, which confirms the chemical formulae.![[thin space (1/6-em)]](https://www.rsc.org/images/entities/char_2009.gif) cos
cos![[thin space (1/6-em)]](https://www.rsc.org/images/entities/char_2009.gif) θ)
θ)

![[thin space (1/6-em)]](https://www.rsc.org/images/entities/char_2009.gif) :
:![[thin space (1/6-em)]](https://www.rsc.org/images/entities/char_2009.gif) 2 and 1
2 and 1![[thin space (1/6-em)]](https://www.rsc.org/images/entities/char_2009.gif) :
:![[thin space (1/6-em)]](https://www.rsc.org/images/entities/char_2009.gif) 3 (M
3 (M![[thin space (1/6-em)]](https://www.rsc.org/images/entities/char_2009.gif) :
:![[thin space (1/6-em)]](https://www.rsc.org/images/entities/char_2009.gif) L). The coordination compounds were converted to metal oxide nanoparticles (MONPs) through solid state thermal decomposition as monocular source precursors. The obtained MONPs were investigated via XRD, TEM and UV-Vis spectral analyses. CeO2 was utilized as a representative nanophotocatalyst to examine the photocatalytic activity of the MONPs in methylene blue (MB) photodegradation. The CeO2 catalyst showed high MB removal of 90.1% after UV illumination for 220 min. The reported method provides a generalized and systematic method for the preparation of many nanoparticle metal oxides with manageable and reproducible features.
L). The coordination compounds were converted to metal oxide nanoparticles (MONPs) through solid state thermal decomposition as monocular source precursors. The obtained MONPs were investigated via XRD, TEM and UV-Vis spectral analyses. CeO2 was utilized as a representative nanophotocatalyst to examine the photocatalytic activity of the MONPs in methylene blue (MB) photodegradation. The CeO2 catalyst showed high MB removal of 90.1% after UV illumination for 220 min. The reported method provides a generalized and systematic method for the preparation of many nanoparticle metal oxides with manageable and reproducible features.


