
 Open Access Article
 This Open Access Article is licensed under a Creative Commons Attribution-Non Commercial 3.0 Unported Licence
Key role of hydrochar in heterogeneous photocatalytic degradation of sulfamethoxazole using Ag3PO4-based photocatalysts†
Li Zhou ab,
Min Caiab,
Xu Zhangab,
Naxin Cuiab,
Guifa Chenab and
Guo-yan Zou*ab
ab,
Min Caiab,
Xu Zhangab,
Naxin Cuiab,
Guifa Chenab and
Guo-yan Zou*ab
aInstitute of Eco-environment and Plant Protection, Shanghai Academy of Agricultural Sciences, Shanghai 201403, China. E-mail: zouguoyan@263.net; joly.zhouli@gmail.com; Tel: +86 18817365817
bShanghai Engineering Research Centre of Low-carbon Agriculture, Shanghai 201403, China
First published on 4th November 2019
Abstract
To overcome the practical application limitations of Ag3PO4 such as photocorrosion and relatively low efficiency of photogenerated carrier seperation, Ag3PO4 particles were loaded onto hydrochar. The particles in the composite had a smaller crystallite size and different phase structure with more edges than pure Ag3PO4 particles. The as-prepared composite catalyst exhibited a different photocatalytic performance for sulfamethoxazole (SMX) degradation when varying the mass ratio of hydrochar and Ag3PO4. In addition to higher SMX degradation efficiency, the composite exhibited much higher TOC degradation efficiency, recycling stability, and less-toxic intermediate production. The composites enhanced visible light response, and accelerated electron transfer and photogenerated carrier separation as well. The addition of H2O2 to the photocatalytic system enhanced the photocatalytic activity of the composite catalyst. According to a mechanistic examination, the hole (h+) is the dominant reactive species for SMX degradation. This study provides new insight into high-efficiency, low cost, and easily prepared photocatalysts for pollution removal from water.
1. Introduction
To increase the utilization of solar light in the process of photocatalytic activities, the development of visible-light responsive photocatalysts has drawn much attention recently. Due to Ag3PO4 having a more than 90% quantum efficiency at wavelengths >420 nm, Ag3PO4-based photocatalysts have attracted great attention.1 Although Ag3PO4 exhibits high photocatalytic activities for organic matter degradation in polluted water under visible light irradiation, it has serious drawbacks, namely, low efficiency of photogenerated carrier seperation and photocorrosion, resulting in Ag0 deposition and slow dissolution (∼0.02 g L−1).2 These are the main obstacles in using Ag3PO4 for practical applications.Recently, much effort has been put forward further optimizing the photocatalytic activity and improving the stability of Ag3PO4. An effective method to increase photocatalytic activity and stability of photocatalysts is synthesizing composite materials. Different types of materials, such as g-C3N4,3 GO,4 MnOx,5 TiO2−x,6 WO3,7 3DOM-SrTiO3,8 and AgX (X = Cl, Br, I),9–11 have been applied to synthesize Ag3PO4-based composite photocatalysts. The incorporated materials not only inhibit the photogenerated carrier's recombination and enhance photocatalytic activity, but also increase stability and decrease photocorrosion of Ag3PO4. However, the large scale applications of such composite materials need low preparation expenses, renewability, and excellent photocatalytic performance.12 Therefore, it is required to further develop novel supporting or incorporating materials to enhance photocatalytic performance and stability of Ag3PO4.
Biochar is generated from waste biomass carbonization via pyrolysis and hydrolysis. The produced biochar is a type of low-cost and stable material and has been applied in many fields.13 Usually in a typical biochar, the carbon, hydrogen, and oxygen content are in the range of 45–60, 2–5, and 10–20 wt%, respectively.14,15 The biochar contains some hydrophilic/hydrophobic functional groups and aromatic carbon structure, that can favor reaction with other functional material or adsorption of organic pollutants. The condensed aromatic ring and quinone moieties structure of biochar can promote electron shuttling and storage.12 Biochar has unique characteristics, such as electrical conductivity, abundant functional groups, and chemical stability, which are beneficial to photocatalysis process when combine biochar with photocatalysts.12 The incorporation of pyrochar, produced through the pyrolysis method, can improve the photocatalytic activity of many photocatalysts, including TiO2,16 Fe3O4/BiOBr,17 and Ag/Ag3PO4.18 It has been reported that 80% of amoxicillin decomposition occurred in 120 min with a composite of Ag/Ag3PO4/pyrochar, compared to 65% of amoxicillin degradation with pure Ag3PO4.18 The hydrolysis method, different from pyrolysis, may result in a different chemical structure and properties.19 Hydrochar possesses a greater abundance of defects and oxy-generated functional groups, including hydroxyl, ether, and carboxyl groups than pyrochar does.20 Furthermore, some studies have reported that hydrochar could adsorb more organic pollutants including phenanthrene, 17a-ethinylestradiol, and bisphenol A than pyrochar could.21 Based on these advantages, the composite hydrochar/TiO2 demonstrated superior visible-light photocatalytic activity in contrast to carbon/TiO2 with high technology carbon, such as fullerene and carbon nanotubes.22 However, to date, few studies have used hydrochar as a photocatalyst support or incorporated materials to investigate the synergistic effects of photodegradation on organic pollutants.
Owing to the potential antibacterial resistance, one of a source of environmental pollutants, antibiotics, has raised much concerns. Sulfamethoxazole (SMX), a typical sulfonamide antibiotic, is widely used in human and animal disease treatment and aquaculture. With high water solubility and low adsorption capacity, SMX is difficult to remove by simple photodegradation or adsorption methods.23 Photocatalysis technology has proven its potential in the degradation of SMX from aqueous matrices. Moreover, as opposed to dyes, SMX can not absorb visible light at the wavelengths greater than 400 nm,24 which casts SMX as an appropriate target pollutant with which to examine the photocatalytic activity of visible-light responsive materials.16,25
In the present work, the hydrothermal carbonization method was employed to prepare hydrochar from woodchips, and a chemical precipitation method was used to synthesize Ag3PO4-based composites with different hydrochar ratios. SMX was used as the target pollutant to examine the adsorption capacity and photocatalytic degradation efficiency of Ag3PO4/hydrochar composites under visible light. A potential photocatalytic degradation mechanism was proposed based on the radical scavenging experiments of a reactive species and electrochemical impedance spectroscopy (EIS), as well as on an electron spin resonance (ESR) analysis. The stability and reusability of photocatalysts, mineralization, and combined toxicity of intermediate products produced during the degradation process were evaluated for the practical application of the Ag3PO4/hydrochar composite.
2. Experimental
2.1 Chemicals
Sulfamethoxazole was bought from Sigma-Aldrich (USA). All of the other reagents, such as disodium hydrogen phosphate (Na2HPO4, ≥99.0%), silver acetate (CH3COOAg, ≥99.0%), hydrogen peroxide (H2O2, 30%), 5,5-dimethyl-1-pyrrolidine N-oxide (DMPO, ≥97.0%), isopropanol (≥99.7%), disodium ethylenediaminetetraacetic (EDTA-Na2, ≥99.0%), p-benzoquinone (≥98.0%), and acetonitrile (HPLC grade, ≥99.8%) were bought from Sinopharm Chemical Reagent Co. Ltd. (Shanghai, China). Each of the chemicals was utilized as received sans additional purification. In the process of experiments, double-distilled water was used all the time.2.2 Hydrochar preparation
Wood sticks were collected from Osmanthus fragrans growing in the courtyard of the Shanghai Academy of Agricultural Sciences (E:121.48°, N:30.95°) in June 2018. The woodchips collected were thoroughly washed to remove dust and then air dried for 48 h. Before the hydrothermal carbonization process, a pulverizer was used to carefully break the dried woodchips to pass through a 100-mesh sieve. To synthesize the hydrochar, 6 g of biomass powder was dispersed into 60 mL of double-distilled water by ultrasonic stirring for 1 h. The mixture was then moved into a 100 mL, Teflon™-lined stainless steel autoclave and the vessel was heated in an electric oven at 200 °C for 5 h. The hydrothermal hydrochar was centrifuged and the precipitate was washed with double-distilled water and ethanol and then dried at 100 °C. Following synthesis, the hydrochar sample was stored in the dark before being used.2.3 Photocatalysts preparation
In a typical synthesis of a hydrochar/Ag3PO4 composite, a specific amount of hydrochar was dispersed into a mixture of 40 mL water and 10 mL N,N-dimethylformamide (DMF). The above mixture was then sonicated for 4 h. A solution of 60 mL CH3COOAg (0.03 M) was added to the hydrochar suspension under vigorous magnetic stirring for 1 h. Ultimately a precipitate generated after adding dropwise 4 mL of 0.15 M Na2HPO4 solution under vigorous stirring. The precipitate was separated and washed for 3 times with distilled water and anhydrous ethanol respectively and then dried under vacuum at 80 °C. The amounts of added hydrochar were 0.05, 0.1, 0.2, and 0.3 g, and the obtained compost samples were labeled as 0.05C/Ag3PO4, 0.1C/Ag3PO4, 0.2C/Ag3PO4, and 0.3C/Ag3PO4, in which the mass ratio of hydrochar/Ag3PO4 were 0.2, 0.4, 0.8, and 1.2, respectively. Pure Ag3PO4 particles were also prepped beneath identical conditions, but without adding hydrochar.2.4 Material characterization
The surface morphologies of samples were characterized by scanning electron microscopy (SEM) using Nova NanoSem 450 devices at 15 kV produced by FEI company. The crystal structure of as-synthesized samples was ascertained by Bruker D8 Advance diffractometer with Cu-Kα radiation source (λ = 0.15406 nm) in the range 10–80° (2θ) at rate of 4° min−1 at 40 kV and 40 mA. Fourier transform infrared spectra (FT-IR) of the samples were recorded by a Nicolet 5700 spectrometer (Thermo, USA) equipped with a KBr beam splitter at room temperature in the range of 4000–400 cm−1 with the resolution of 2 cm−1. The elements' binding energies of samples were conducted on basis of the X-ray photoelectron spectroscopy (XPS) using an upgraded RBD PHI-5000C ESCA system (PerkinElmer) with Mg-Kα radiation (h = 1253.6 eV). The ultraviolet-visible reflectance spectra (UV-vis DRS) in the range of 200–800 nm were recorded by a LAMBDA 950 spectrometer (PerkinElmer) with an integrating sphere and BaSO4 used as a reference. A Bruker E500 spectrometer was used to record electron spin resonance (ESR) signals of spin-trapped paramagnetic materials with a resonance frequency of 9.77 GHz, modulation frequency of 100 kHz, microwave power of 20.02 mW, modulation amplitude of 1.0 G, and sweep width of 100 G. A CHI760E (Chenhua Instrument Co., Shanghai, China) electrochemical workstation was used to record electrochemical impedance spectroscopy (EIS) spectra in a three-electrode system. Ag/AgCl and Pt were used as the reference electrode and counterelectrode, respectively. The analysis was conducted at an open circuit potential with 5 mV AC amplitude in the frequency range of 0.1 Hz to 100 kHz. Nitrogen adsorption isotherms were measured on a automatic specific surface area and pore analyzer (Micromeritics Instrument Corporation, ASAP2460) at 77.3 K after degassing for 2 h at 373.15 K. The hydrochar/Ag3PO4 composite samples were characterizedby high spectral resolution confocal Raman Microscope (HORIBA LabRam HR Evolution) equipped with a 514 nm laser excitation source.2.5 Evaluation of photocatalytic activity
The photocatalytic performance of composites was evaluated by SMX degradation under visible light irradiation in a double-layer reactor (500 mL volume and 8 cm diameter) with cooling water circulation to keep reaction temperature at 25 ± 2 °C. In a typical process, 20 mg of photocatalyst was suspended in the SMX solution (1 mg L−1, 200 mL) and the solution was stirred for 60 min in the dark for achieving adsorption–desorption equilibrium. A 300-W xeon lamp with a cutoff filter (λ > 420 nm) served as the visible-light irradiation source and was positioned 30 cm from the liquid level. The lamp had a mean horizontal light intensity of 180 mW cm−2 to trigger photocatalytic reactions. A certain volume of sample was withdrawn at selected time during the process and then filtered using 0.22 μm syringe filters for SMX analysis by a high-performance liquid chromatograph (HPLC) at λmax 265 nm (Waters, USA), with acetone-water (30![[thin space (1/6-em)]](https://www.rsc.org/images/entities/char_2009.gif) :70, v/v) serving as the mobile phase at a flow rate of 1.0 mL min−1. The C-18 column (4.6 × 250 mm) was used at the temperature of 30 °C with injection volume of 10 μL. To ascertain the effect of reactive species for photocatalytic process, three scavengers, 10 mM isopropanol, 0.5 μM benzoquinone, and 5 mM disodium ethylenediaminetetraacetate (EDTA-Na2), were added separately to the SMX solutions (1 mg L−1) which contained 0.1 g L−1 of photocatalyst. The other experiment followed the identical procedure as the photodegradation experimental process.
:70, v/v) serving as the mobile phase at a flow rate of 1.0 mL min−1. The C-18 column (4.6 × 250 mm) was used at the temperature of 30 °C with injection volume of 10 μL. To ascertain the effect of reactive species for photocatalytic process, three scavengers, 10 mM isopropanol, 0.5 μM benzoquinone, and 5 mM disodium ethylenediaminetetraacetate (EDTA-Na2), were added separately to the SMX solutions (1 mg L−1) which contained 0.1 g L−1 of photocatalyst. The other experiment followed the identical procedure as the photodegradation experimental process.
2.6 Photocatalyst stability
The stability and reusability of Ag3PO4 and 0.1C/Ag3PO4 composites were conducted by SMX cyclic degradation experiments. Compared to the typical photocatalytic experiment, the cyclic tests elevated the concentrations of photocatalysts and SMX to Ccatalyst = 0.25 g L−1 and CSMX = 5 mg L−1 to offset the impact of the loss of photocatalysts during recycling process. After each cycle, the photocatalyst was collected by filtration and then was used for the following cyclic experiment after washing and drying.3. Results and discussion
3.1 Characterization of hydrochar/Ag3PO4
Fig. 1(a–c) show typical SEM images of hydrochar, Ag3PO4, and 0.1C/Ag3PO4, respectively. The as-prepared hydrochar has a rough, porous, and fibrous surface and pure Ag3PO4 particles are irregular spheres with an average diameter of about 593 nm (Fig. S1(a)†). Interestingly, using the same synthesized method, the Ag3PO4 particles in the composite hydrochar/Ag3PO4 have a cubic morphology with an smaller average particle size of around 298, 303, 256 and 238 nm for 0.05C/Ag3PO4, 0.1C/Ag3PO4, 0.2C/Ag3PO4, and 0.3C/Ag3PO4, respectively. (Fig. S1(b–e)†), indicating that with more hydrochar introduction, the particle size decreased gradually. As shown in Fig. 1 and S2,† the Ag3PO4 particles in the pure Ag3PO4 aggregated, whereas those in the composite with different shapes and sizes were well dispersed in hydrochar/Ag3PO4 composite with less hydrochar incorporation (0.05–0.2C/Ag3PO4). While in the 0.3C/Ag3PO4, the particles aggregated again due to the large amounts of biochar incorporation. The introduction of hydrochar had significant effects on the phase structure and crystallite size of Ag3PO4, which differs from previous reports18—probably due to the different method of synthesis and type of biochar. Yan et al. reported that cubic Ag3PO4 was synthesized in the presence of ammonia, and quasi-spherical Ag3PO4 particles were formed in the absence of ammonia.26 In the system with ammonia, an [Ag(NH3)2]+ complex formed, which reduced the release rate of Ag+ and subsequently reacted with PO43− anions to form Ag3PO4. In our experiments without hydrochar, the free Ag+ ions present in the reaction system were in considerably high concentrations such that the growth process of Ag3PO4 crystals was spontaneous and fast and lead to the rapid nucleation and irregularly spherical morphology of Ag3PO4 crystals. In contrast, in the presence of hydrochar, the free Ag+ could be absorbed by hydrochar and the free Ag+ would gradually be released into reaction system, which would slow the nucleation and different growth rates of Ag3PO4 crystals, resulting in the production of more crystalline structures.27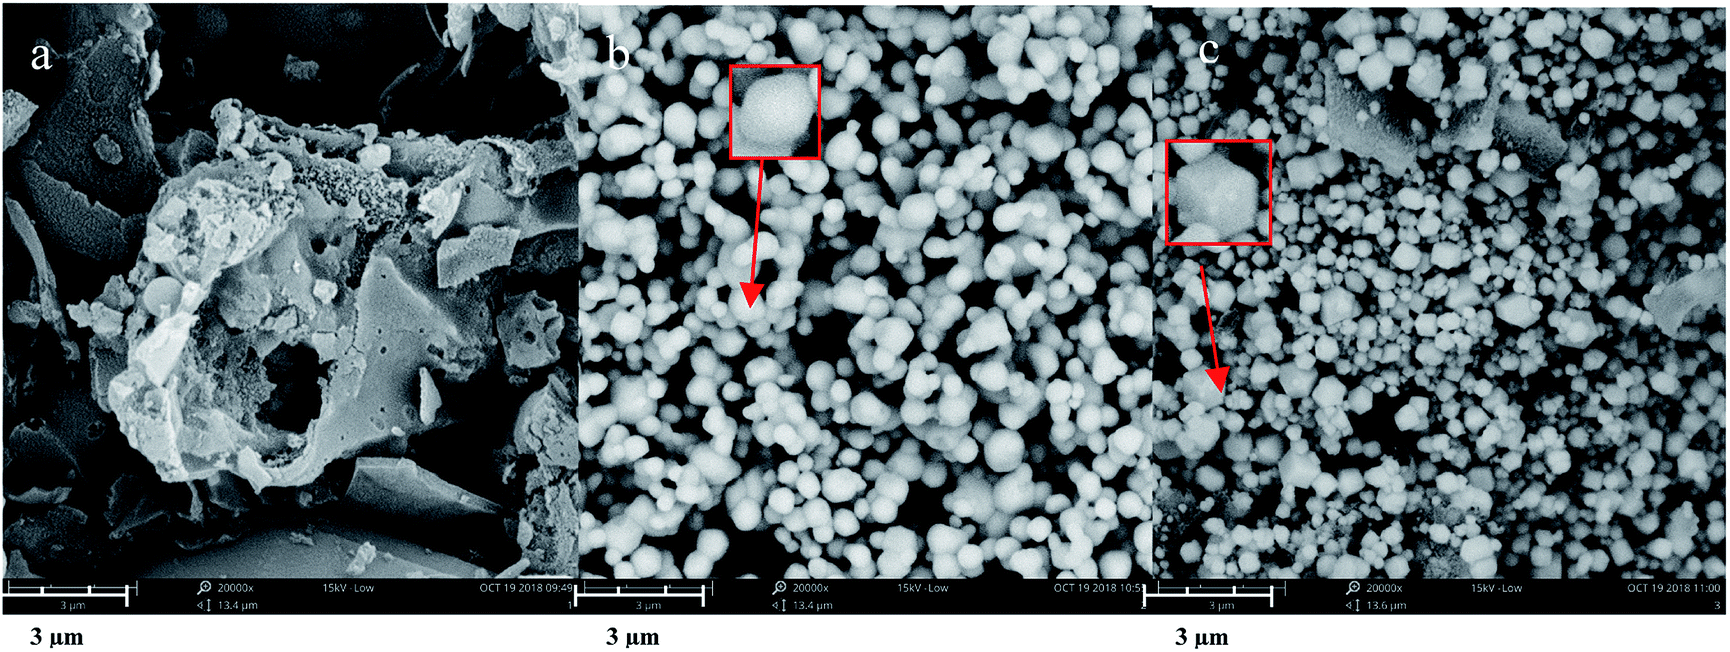 | ||
| Fig. 1 SEM images of (a) hydrochar, (b) Ag3PO4, and (c) 0.1C/Ag3PO4. The scale bar represents 3 μm. | ||
Although the Ag3PO4 particles have different shapes and sizes in the pure and composite samples, the XRD patterns [Fig. 2(a)] obviously reveal that each of the diffraction peaks of the samples with irregular spherical and cube morphology can be indexed to the cubic Ag3PO4 (JCPDS card no. 06-0505), although the peaks of 0.3C/Ag3PO4 were slightly shifted. The upshift of diffraction peaks of the 0.3C/Ag3PO4 showed a lattice contraction due to the interaction between hydrochar and Ag3PO4.28 No characteristic peaks of hydrochar were observed in the hydrochar/Ag3PO4 composite pattern, which could be attributed to its relatively weak crystallinity and the low hydrochar quantity. No Ag0 peaks are evident in the XRD patterns of any of the photocatalysts, indicating that the hydrochar did not reduce Ag+ to Ag0 during the preparation process.
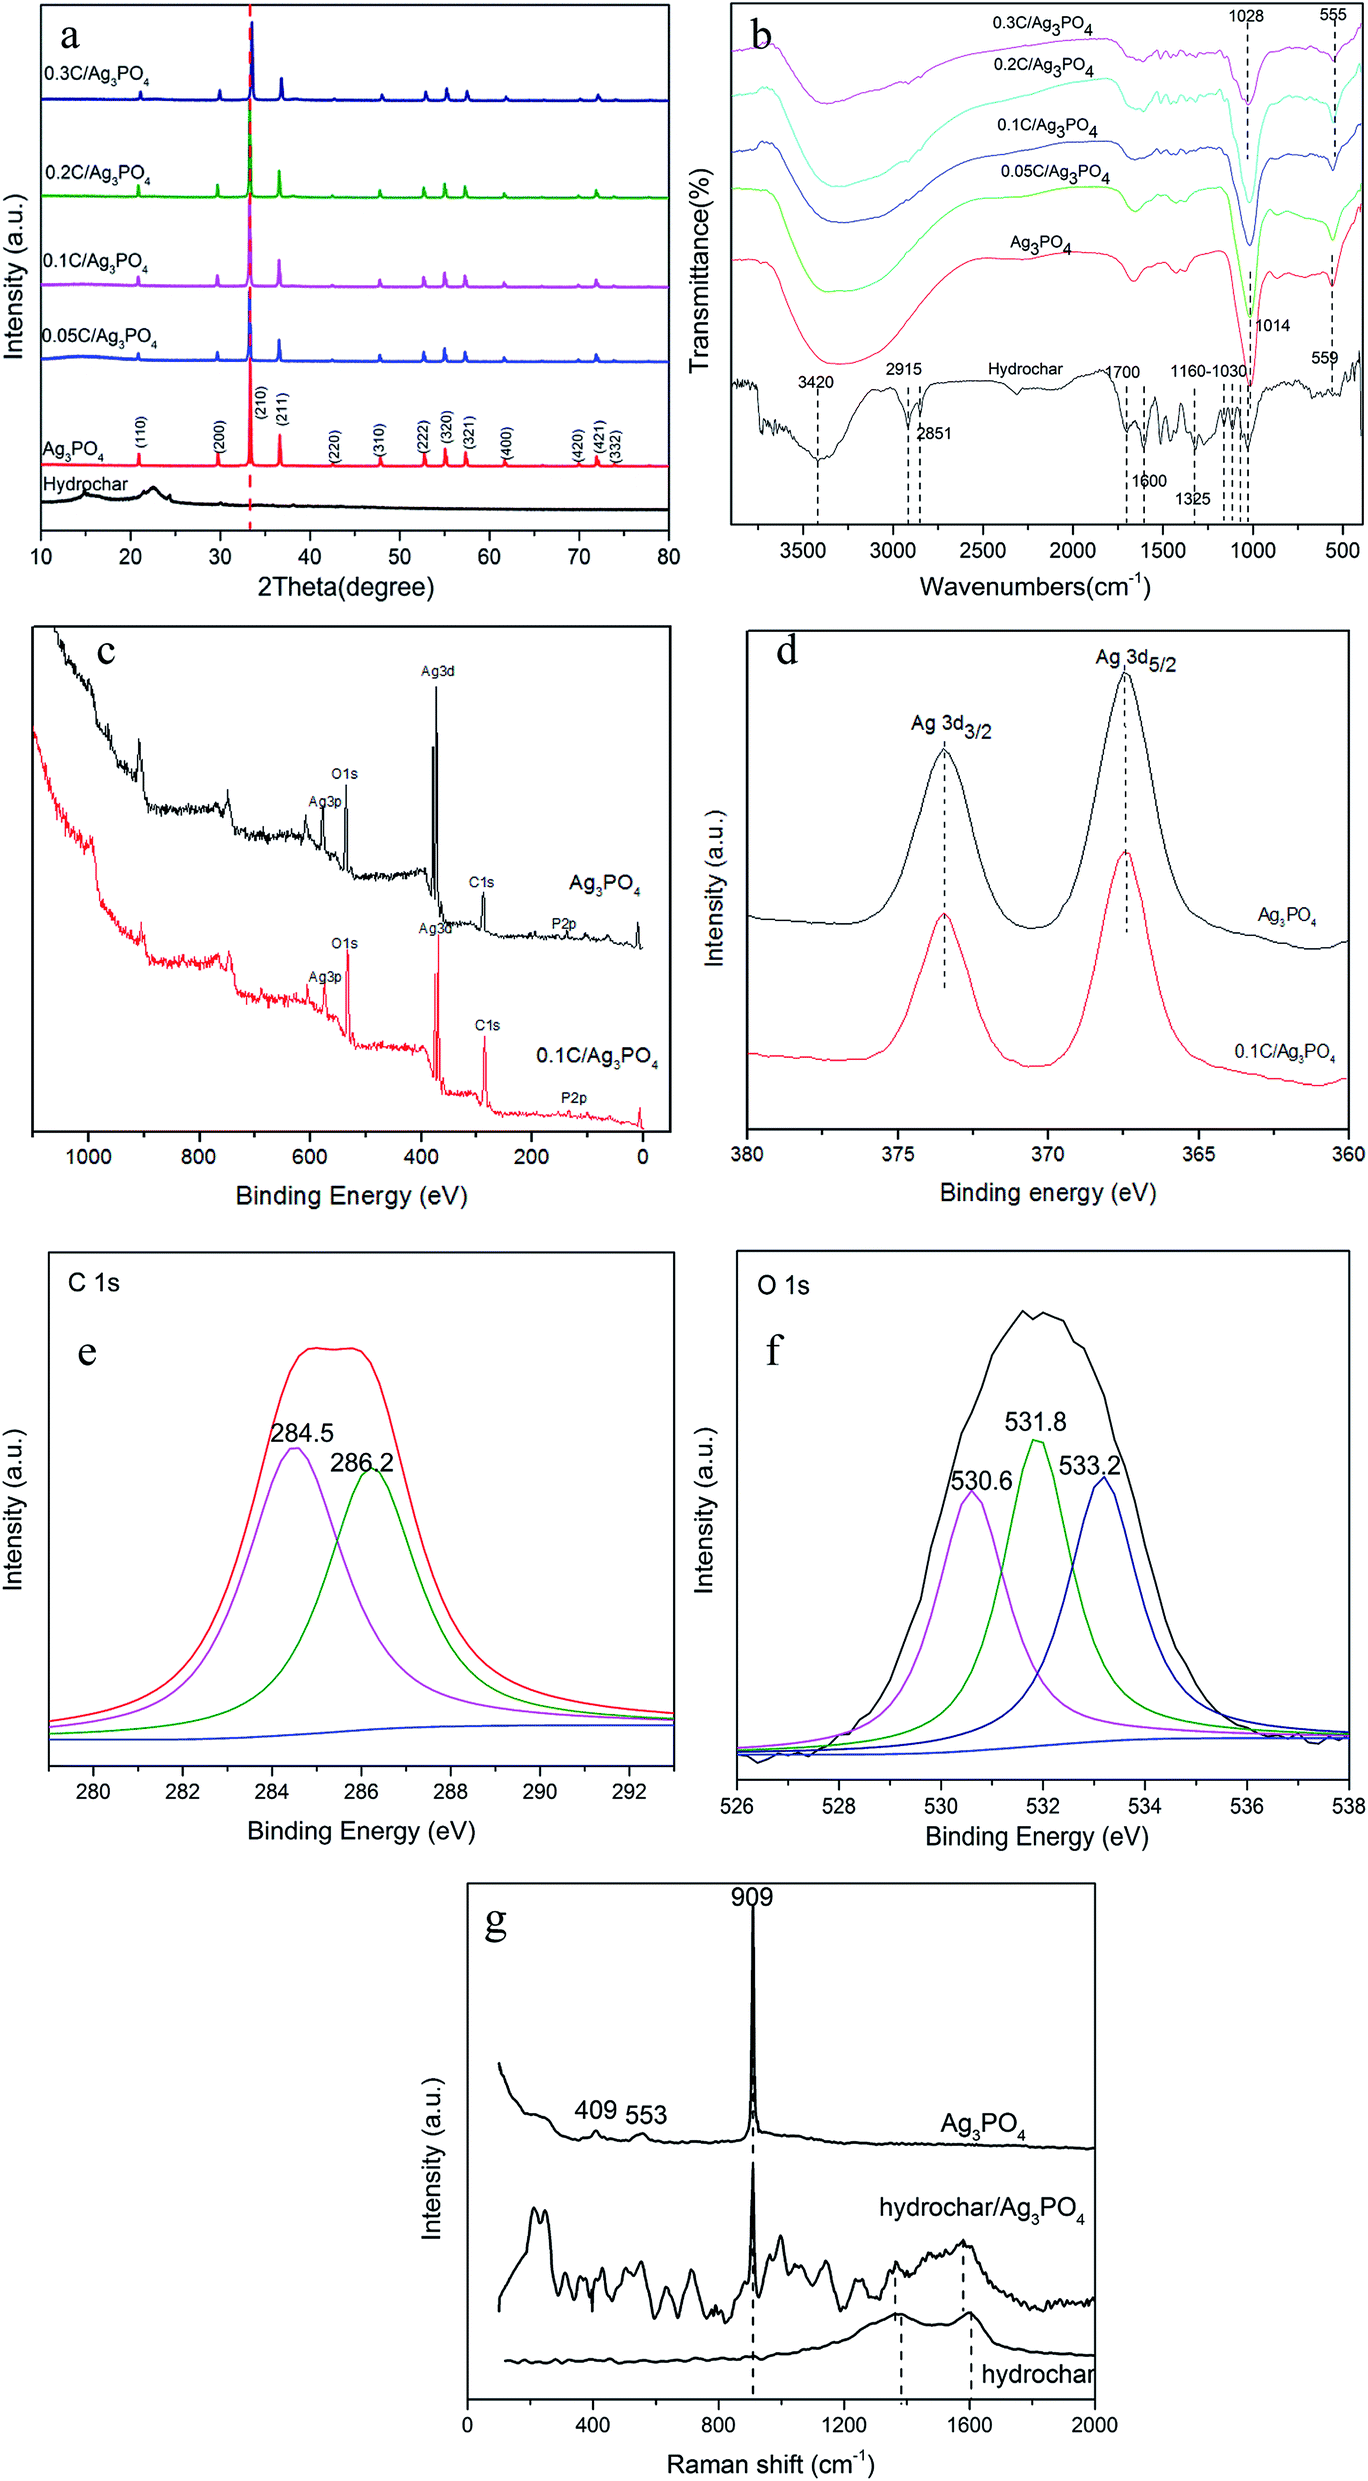 | ||
| Fig. 2 (a) The XRD patterns; (b) FT-IR spectra of hydrochar, Ag3PO4, 0.05–0.3C/Ag3PO4; (c) XPS survey spectra of Ag3PO4 and 0.1C/Ag3PO4; (d) high resolution XPS spectrum of Ag 3d in Ag3PO4 and 0.1C/Ag3PO4; (e and f) high resolution XPS spectrum of C 1s and O 1s in 0.1C/Ag3PO4; (g) Raman spectra of Ag3PO4, hydrochar and 0.1C/Ag3PO4. | ||
The FT-IR spectra of pure hydrochar, pure Ag3PO4, and hydrochar/Ag3PO4 composites are shown in Fig. 2(b). The abundant functional groups of hydrochar were identified from FT-IR spectra. The characteristic peaks at 1030–1160 cm−1 represent the aliphatic C–O and C–O–C stretching.29 The peaks at 1325 and 1600 cm−1 were ascribed to O–H bending and aroic C![[double bond, length as m-dash]](https://www.rsc.org/images/entities/char_e001.gif) C and CO stretching of conjugated ketones and quinones,30 respectively. The clear characteristic peaks at ∼1700 and 2923–2851 cm−1, which were ascribed to CO stretching of carboxyl groups and CH3 carbon,20 respectively, were also observed for this hydrochar samples. The peak at 3420 cm−1 in hydrochar was due to O–H stretching of hydroxyl groups because of absorbed water molecules.31 The above analysis revealed that much oxy-generated functional groups (hydroxyl groups and carboxyl groups etc.) existed in this hydrochar, which was beneficial to photocatalysts attachment. The infrared spectra of hydrochar/Ag3PO4 (with cubic particles) are identical to that of pure Ag3PO4 (with irregular spherical particles), although the absorption peaks intensities decreased with the addition of hydrochar. The two peaks located at 1014 cm−1 and 559 cm−1 in the Ag3PO4 represent P–O bond vibration.32 While with the addition of hydrochar, the peaks became weak and broad and meanwhile, the two peaks moved to 1028 and 555 cm−1 in 0.3C/Ag3PO4, suggesting that the chemical bonds connections have changed and hydrochar and Ag3PO4 were connected together successfully.33
C and CO stretching of conjugated ketones and quinones,30 respectively. The clear characteristic peaks at ∼1700 and 2923–2851 cm−1, which were ascribed to CO stretching of carboxyl groups and CH3 carbon,20 respectively, were also observed for this hydrochar samples. The peak at 3420 cm−1 in hydrochar was due to O–H stretching of hydroxyl groups because of absorbed water molecules.31 The above analysis revealed that much oxy-generated functional groups (hydroxyl groups and carboxyl groups etc.) existed in this hydrochar, which was beneficial to photocatalysts attachment. The infrared spectra of hydrochar/Ag3PO4 (with cubic particles) are identical to that of pure Ag3PO4 (with irregular spherical particles), although the absorption peaks intensities decreased with the addition of hydrochar. The two peaks located at 1014 cm−1 and 559 cm−1 in the Ag3PO4 represent P–O bond vibration.32 While with the addition of hydrochar, the peaks became weak and broad and meanwhile, the two peaks moved to 1028 and 555 cm−1 in 0.3C/Ag3PO4, suggesting that the chemical bonds connections have changed and hydrochar and Ag3PO4 were connected together successfully.33
The surface compositions and chemical states of Ag3PO4 and 0.1C/Ag3PO4 were established by XPS spectra. As can be seen in Fig. 2(c), mainly silver, oxygen, phosphorus, and carbon are present in both samples. A slightly stronger intensity of C 1s in the sample of 0.1C/Ag3PO4 than that of pure Ag3PO4 indicates the incorporation of hydrochar. The XPS spectra of pure Ag3PO4 and 0.1C/Ag3PO4 were almost identical (as revealed in Fig. 2(d)), suggesting no formation of Ag0 or other chemical bonds. C 1s spectra (Fig. 2(e)) in 0.1C/Ag3PO4 could be deconvoluted into two peaks. The peak at around 284.5 eV is attributed to sp2 hybridized carbon and the other peak at around 286.2 eV is assigned to some oxygen bound species such as C–OH or (and) C–O–C.34 The O 1s spectra (Fig. 2(f)) in 0.1C/Ag3PO4 could be deconvoluted into three peaks at around 530.6, 531.8 and 533.2 eV, which correspond to oxygen anions in the P–O of Ag3PO4, hydroxyl oxygen and carboxyl oxygen, respectively.20,35 The XPS results showed that there are much hydroxyl and carboxyl groups existing in hydrochar and Ag3PO4 composit, consistent with the FT-IR data. Fig. 2(g) shows Raman spectra of Ag3PO4, hydrochar and 0.1C/Ag3PO4. In the spectrum of Ag3PO4, the obvious peak at 409 and 553 cm−1 was consistent with the symmetric stretching vibration of P–O–P bonds, and the peaks at 909 cm−1 were ascribed to the vibration of terminal oxygen of PO4.3–5,36 In the spectrum of hydrochar, the peaks at 1378 and 1599 cm−1 were corresponded to the carbon-based material D-band (defects and disorder) and G-band (graphitic), respectively. In the spectrum of hydrochar/Ag3PO4 composite, the presence of D and G bands and the characteristic peak at 909 cm−1 demonstrated the successful coupling of hydrochar to Ag3PO4.37 The D and G peaks in the composite downshift to 1361 and 1579 cm−1, and the shift to lower energy of both the D and G modes in the composite is associated with the charge transfer from Ag3PO4 to hydrochar.38,39
3.2 Photocatalytic properties and composite stability
Using SMX as a target pollutant, photocatalytic performances of composites were evaluated to contrast the photocatalytic activities of Ag3PO4 with and without incorporating hydrochar under visible light irradiation. As presented on Fig. 3(a), in the process of 1 h adsorption before turning on the light, the removal rate of SMX by different samples are 9.97, 11.57, 14.86, 22.35 and 22.79% for Ag3PO4, 0.05C/Ag3PO4, 0.1C/Ag3PO4, 0.2C/Ag3PO4 and 0.3C/Ag3PO4, respectively, indicating that the adsorption abilities of composites increase with the increased amounts of introduced hydrochar. However, the specific surface areas of composites are inconsistent with the adsorption capacities. The specific surface areas of photocatalysts are 3.84, 11.38, 9.83, 6.82 and 6.04 m2 g−1 for Ag3PO4, 0.05C/Ag3PO4, 0.1C/Ag3PO4, 0.2C/Ag3PO4 and 0.3C/Ag3PO4, respectively. The introduced hydrochar increase the specific surface area of composites compared with pure Ag3PO4, and with the increased amounts of hydrochar, the specific surface area decrease gradually maybe due to the aggregation of hydrochar.22,40 The results about specific surface area and adsorption capacity show that the adsorption of hydrochar does not depend on the physical adsorption, and the different functional groups (as shown in FT-IR and XPS results) contained by hydrochar can favor adsorption of organic pollutants through hydrogen bonding and/or electrostatic interactions.12 After turning on the light, the SMX concentration decreases slightly without a catalyst or with only hydrochar under visible light, suggesting that the photolysis and hydrochar photocatalytic degradation is negligible. When pure Ag3PO4 is used for the SMX degradation, around 48% of the contaminant degrades in 90 min. In comparison, 98% SMX was degraded in the presence of the hydrochar/Ag3PO4 composite under identical conditions. As revealed in Fig. 3(b), the plots were linear fitted by ln(C0/CT) versus irradiation time and the degradation rate constant is 0.001, 0.006, 0.050, 0.059, 0.043, and 0.017 min−1 for hydrochar, pure Ag3PO4, 0.05C/Ag3PO4, 0.1C/Ag3PO4, 0.2C/Ag3PO4, and 0.3C/Ag3PO4, respectively. The 0.1C/Ag3PO4 shows the highest degradation constant, which is attributed to the proper contact of Ag3PO4 and hydrochar. The amount of hydrochar has a significant impact on the photocatalytic activities of the hydrochar/Ag3PO4 composite. When the hydrochar content is relatively low (0–2.3 wt%), the photocatalytic activities of composite increases with the increment of hydrochar. However, when the hydrochar content is relatively high (2.3–6.7 wt%), the photocatalytic activities of the composites decrease with further increase of the hydrochar content. Therefore, a proper amount of hydrochar may be important for electron transfer and the separation of hole–electron pairs of the composite photocatalysts.41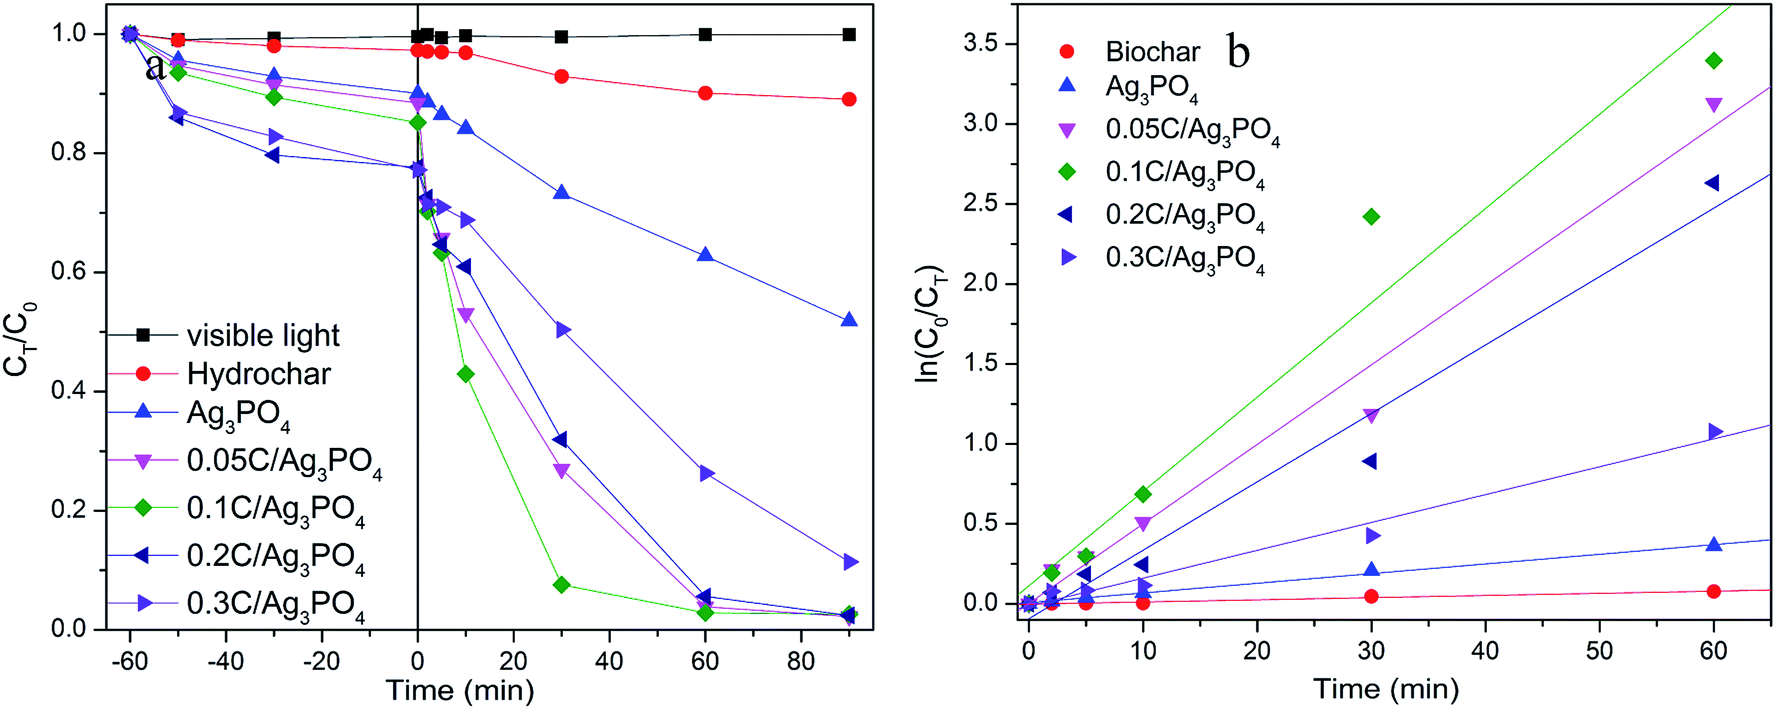 | ||
| Fig. 3 (a) Removal of SMX in presence of various photocatalysts with different hydrochar and Ag3PO4 composition ratios under visible light irradiation, (b) photocatalytic rate of hydrochar/Ag3PO4 for SMX degradation under visible light irradiation. | ||
Furthermore, it is possible that the shape and surface structure of the Ag3PO4 particles improved the photocatalytic activities of the hydrochar/Ag3PO4. Based on the aforementioned SEM outcomes, the Ag3PO4 particles of pure Ag3PO4 and hydrochar/Ag3PO4 show different shapes and surface constructions. From the previous report, the photodegradation efficiency of the cubic Ag3PO4 was two times that of the spherical particles for MO and RhB degradation. The number of active sites will be remarkably increased because of the higher density of corners and edges on the surface of cubic particles and these sites facilitated the adsorption of organic molecules.27 Thus, the shape and surface structure of Ag3PO4 sub-microcrystals could improve photocatalytic properties, which may be another reason that hydrochar/Ag3PO4 could enhance the photocatalytic activities in contrast with Ag3PO4 without hydrochar. The results about the change of combined toxicity of produced intermediates and TOC removal rate (Fig. S3†) also indicate the role of incorporated hydrochar in the composite photocatalysts.
The reusability and stability of photocatalysts are vital to the practical application of photocatalytic techniques. As shown in Fig. 4(a), after three consecutive cycles, the photocatalytic degradation efficiency of Ag3PO4 without hydrochar decreased sharply from 68.2% to 31.1% after 90 min irradiation. However, only minor deactivation of the 0.1C/Ag3PO4 was observed and the SMX removal rate decreased from 93.2% to 83.2%, which implied the higher stability of the composite photocatalyst. The fresh and spent catalysts were also examined with XPS (Fig. 4(b)). The two peaks in the spectra of Ag3PO4 and 0.1C/Ag3PO4, corresponding to the Ag 3d3/2 and Ag 3d5/2 binding energies of Ag+, located at 368 and 374 eV.42 The Ag 3d3/2 and Ag 3d5/2 peaks of Ag3PO4 without hydrochar showed clear reduction and upshift after three cycles of photocatalytic reactions. The 1.1 eV upshift implied obvious metallic Ag production in the process of photocatalytic reaction of Ag3PO4. For the 0.1C/Ag3PO4, the Ag 3d3/2 and Ag 3d5/2 peaks show a small decrease and an 0.3 eV upshift. This indicates that less Ag+ in 0.1C/Ag3PO4 was reduced into metallic Ag compared to Ag3PO4 without hydrochar. According to the previous report,43 a significant loss of Ag+ ions from the Ag3PO4 sharply decreases its photocatalytic activity. The changes of Ag 3d XPS peaks could explain the progressive decline of the photocatlaytic degradation performances. Therefore, incorporating hydrochar with the Ag3PO4 photocatalyst not only enhances the photocatalytic performance of composites, but also promotes the stability and durability of the photocatalytic activity by preventing the photo-corrosion.
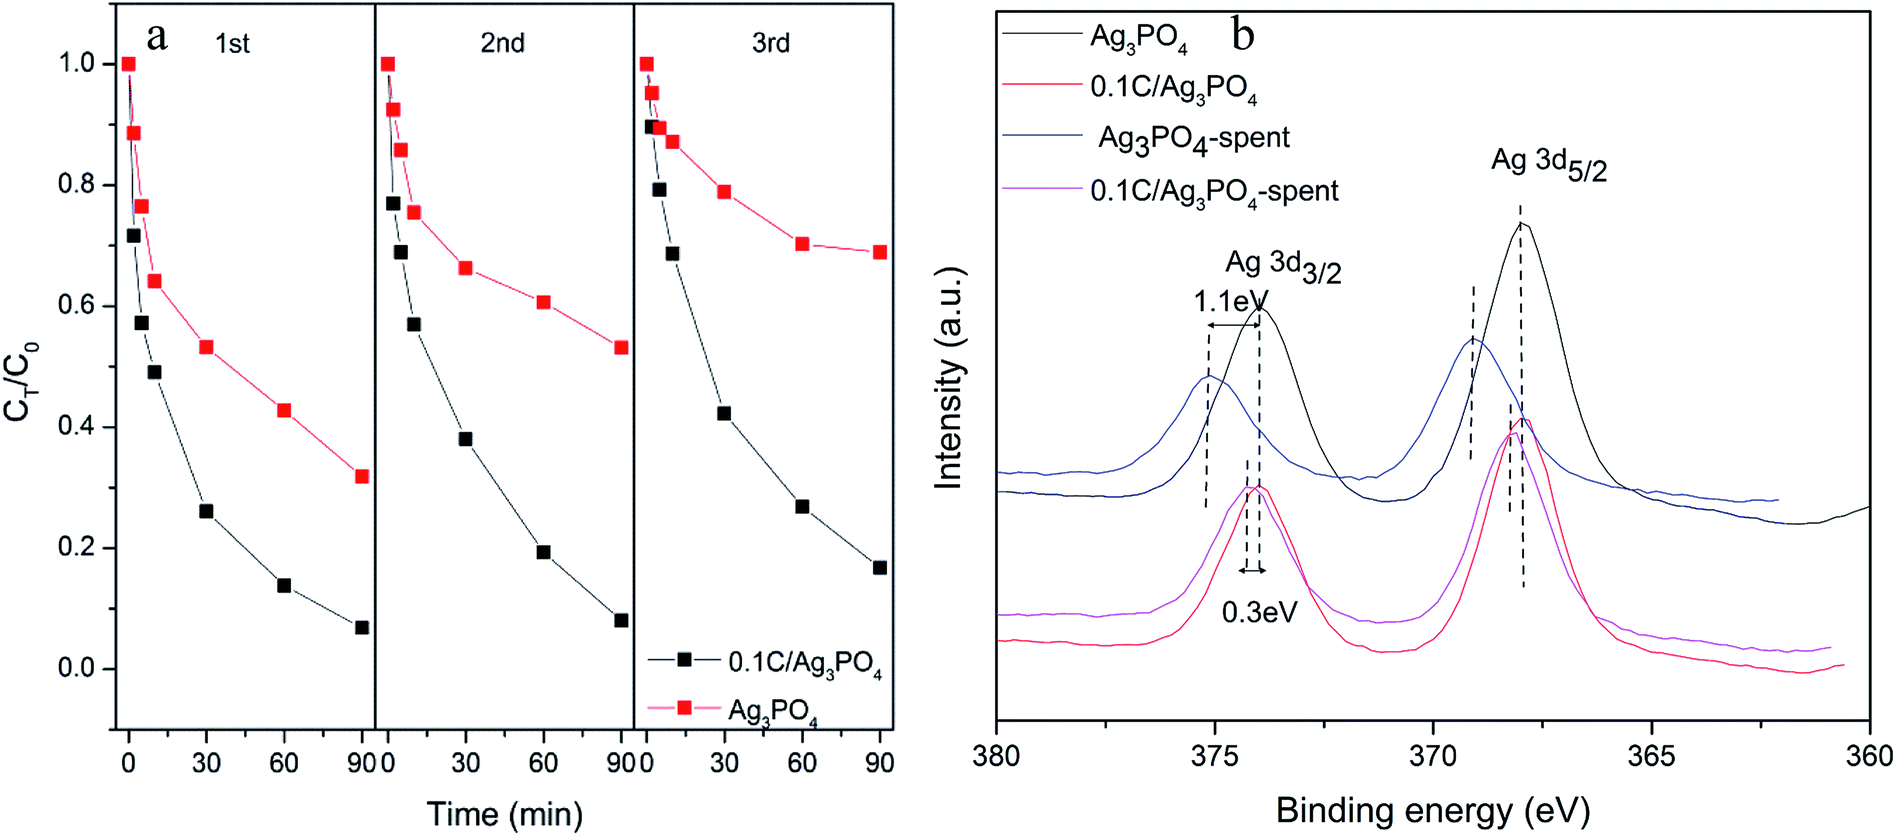 | ||
| Fig. 4 (a) The cycling performance of photocatalytic degradation of SMX removal for Ag3PO4 and 0.1C/Ag3PO4; and (b) the high-resolution XPS spectrum of Ag 3d in Ag3PO4 and 0.1C/Ag3PO4 before and after three reaction cycles. | ||
3.3 Mechanism analysis
The light absorbance of the hydrochar, pure Ag3PO4, and hydrochar/Ag3PO4 composite is shown in Fig. 5(a). The absorption edge of the pure Ag3PO4 is ∼538 nm, while all of the hydrochar/Ag3PO4 composites show a wider absorption in the visible light region. The absorption edge of 0.1C/Ag3PO4 is at ∼823 nm, which is broader than that of the pure Ag3PO4. Accordingly, 0.1C/Ag3PO4 and Ag3PO4 has a band gap (Eg) of 1.5 and 2.3 eV, respectively.9 The hybridization with hydrochar reduces the composite photocatalyst' band gap, thus promoting the light absorbance. | ||
| Fig. 5 (a) UV-vis diffuse reflectance spectra of the hydrochar/Ag3PO4 composite; and (b) EIS for the hydrochar, Ag3PO4, and 0.1C/Ag3PO4. | ||
Fig. 5(b) shows the EIS spectra of the hydrochar, Ag3PO4, and 0.1C/Ag3PO4 electrodes. The EIS spectra indicate the separation efficiency of the photocatalyst's electron–hole pairs. A smaller arc radius in a Nyquist diagram is an indication of an overall smaller charge-transfer resistance or, equivalently, a more facile charge transfer process at the electrode/electrolyte interface.41 Fig. 5(b) shows that the diameter of the arc radius on the EIS Nyquist plot of the 0.1C/Ag3PO4 composite electrode is smaller than that of hydrochar and pure Ag3PO4, indicating that the 0.1C/Ag3PO4 has the highest charge-separation and electron-transfer efficiency. Under visible light illumination, the photo-induced electrons of Ag3PO4 are transferred to the hydrochar, and the charge recombination is suppressed, which contributes to the improvement of the photocatalytic activity of the 0.1C/Ag3PO4.
The reactive oxidation species in the photocatalytic process were identified using different radical scavengers or quenchers. EDTA-Na2, isopropyl, and p-benzoquinone were added into the SMX degradation process to selectively quench h+, ˙OH, and O2˙−, respectively. As shown in Fig. 6(a) the addition of isopropyl and p-benzoquinone only slightly inhibit the progress of photocatalytic destruction. However, the addition of EDTA-Na2 significantly quenches the reactive oxidation species responsible for SMX degradation and consequently reduces the degradation rate from 98.2% to 23.7% after 90 min of irradiation. Thus, h+ is the dominant reactive specie responsible for the photocatalytic process of the Ag3PO4-based composite, which is consistent with the previous study.44
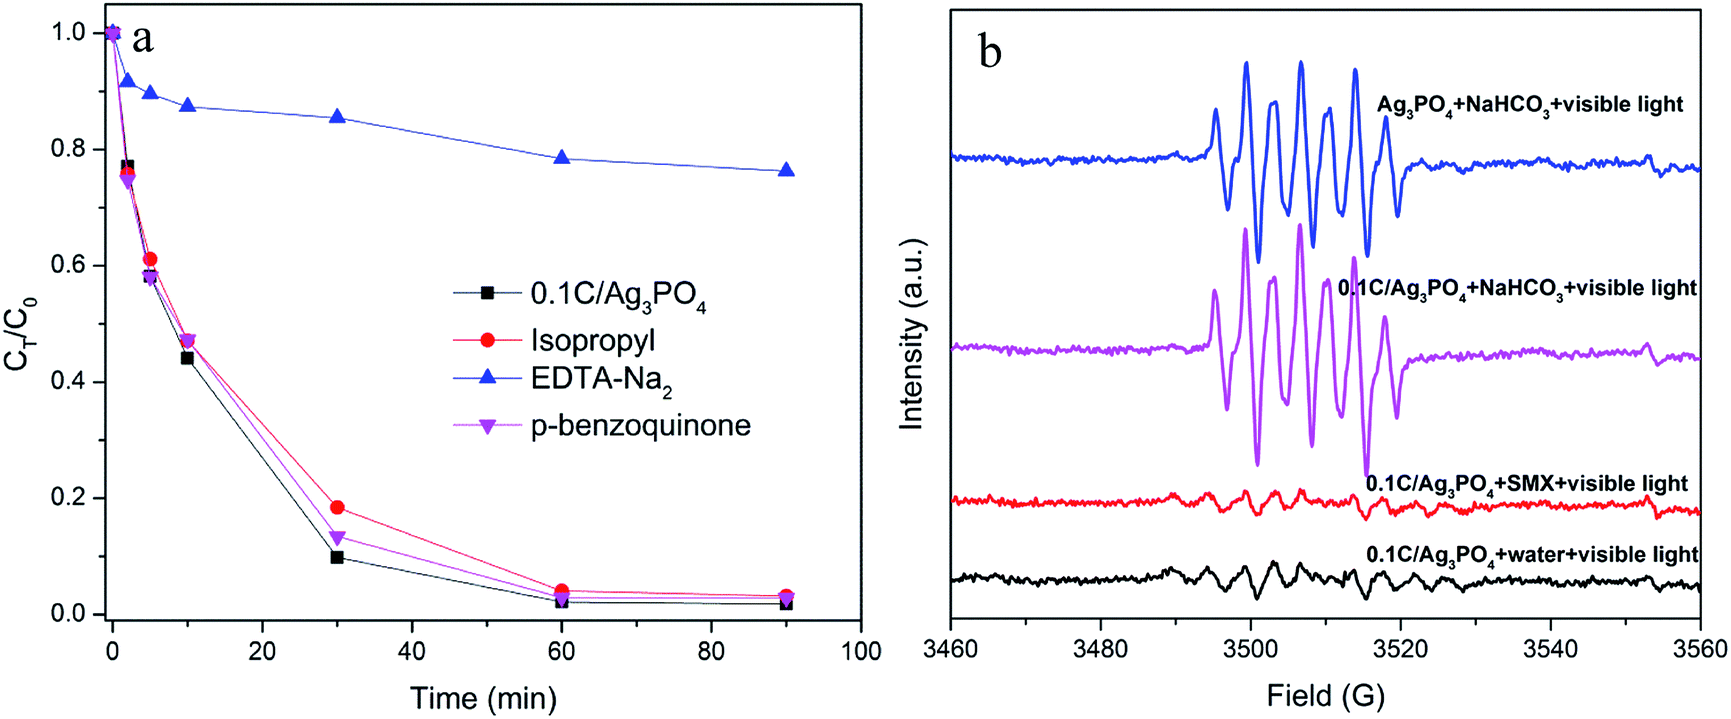 | ||
| Fig. 6 (a) Degradation curves of SMX with additions of scavengers over 0.1C/Ag3PO4 under visible light illumination; and (b) ESR spectra of radical adducts trapped by DMPO in Ag3PO4 and 0.1C/Ag3PO4 systems: in a different dispersion for DMPO-˙OH. | ||
ESR spectroscopy with DMPO was used to further verify the formation of ˙OH in the photodegradation system. Four spectra associated to the DMPO oxidation product, 5,5-dimethyl-1-pyrrolidone-2-oxyl (DMPOX), are shown in Fig. 6(b), which is indicative of the DMPO oxidation by ˙OH. For 0.1C/Ag3PO4, weak ESR characteristic signals are detected in the SMX solution or pure water solution under visible light irradiation, which is because of negligible amounts of ˙OH in the solutions. In other words, the photogenerated h+ in the Ag3PO4 valance band reacts slowly with the surface-bound water or hydroxyl group, generating a small amount of ˙OH. However, the DMPOX signal intensities in 0.1 M NaHCO3 dispersions are much stronger than those in the SMX or pure water solutions, indicating that the presence of OH− in NaHCO3 solution speeds up the oxidation reactions of DMPO by ˙OH produced by h+ oxidation. This constitutes additional evidence that h+ is likely the dominant reactive species generating in the photocatalytic process for both pure Ag3PO4 and 0.1C/Ag3PO4. In addition, the DMPOX signal intensity with 0.1C/Ag3PO4 is slightly stronger than that of pure Ag3PO4, which shows that hydrochar facilitates production of radicals and enhances 0.1C/Ag3PO4 photocatalytic activity.
In Fig. 7, the potential charge separation, migration, and degradation process mechanisms under visible light irradiation are shown, where +0.45 and +2.9 V are the respective conduction band (CB) and valence band (VB) potentials of Ag3PO4, compared to a normal hydrogen electrode (NHE), (denoted in blue on the right-hand Y-axis). The Ag3PO4 could be excited under visible light illumination due to the energy band gap. The VB potential of Ag3PO4 is more positive than SMX's oxidation potential (0.9 V),45,46 ˙OH/OH− (1.89 V/NHE),47 and ˙OH/H2O (2.68 V/NHE),48 indicating that the photogenerated holes have strong oxidative ability. The holes can oxidize SMX to CO2 and H2O (or other intermediate products) and OH− and H2O to ˙OH. The potential variation between the Ag3PO4 VB and SMX oxidative potential (ΔE = 2.0 V) is much greater than the difference between the VB potentials of Ag3PO4 and ˙OH/OH− or ˙OH/H2O (ΔE1 = 1.01 V and ΔE2 = 0.22 V). This difference means that the photogenerated holes could preferentially oxidize the SMX instead of reacting with absorbed OH− or H2O. This explains the minor effect of isopropanol as a ˙OH scavenger on the photocatalytic activity and the weak ˙OH signals in the SMX or water solution observed from the ESR analysis. However, the CB of the Ag3PO4 is too positive to reduce O2 to O2˙− (−0.33 V/NHE) and HO2˙ (−0.55 V/NHE)49 through electrons produced in the CB. Therefore, the production of such active oxygen species from single-electron reduction of O2 could not be attained during the photocatalytic process. The reduction potential of O2 to H2O2 (+0.695 V/NHE)49 is greater than the CB potential of Ag3PO4; therefore, the photogenerated electrons might be effectively moved to O2 to form H2O2 through a two-electron reduction.50 Furthermore, according to Fig. S4 in the ESI,† the H2O2 produced in this system or externally added H2O2 could trap electrons and form ˙OH.51
 | ||
| Fig. 7 Schematic of the proposed mechanism for SMX degradation under visible light irradiation and band structures of hydrochar/Ag3PO4 composite photocatalyst. | ||
4. Conclusions
A novel nanocomposite of Ag3PO4 particles hybridized with hydrochar was synthesized via a chemical precipitation method. Compared with pure Ag3PO4 particles, there were significant changes in size and shape in the Ag3PO4/hydrochar composite. The composite exhibited SMX and TOC photodegradation efficiency and recycling stability more than pure Ag3PO4. The incorporation of hydrochar enhanced the photocatalytic activity of 0.1C/Ag3PO4 by increasing both the visible light absorption and separation of hole–electron pairs. Furthermore, the h+ generated on the photocatalyst surface comprised main active species for the decomposition of adsorbed SMX. The addition of H2O2 in the photocatalytic system improved the electron-trapping efficiency and the formation of ˙OH, which enhanced the 0.1C/Ag3PO4 photocatalytic activity. Taking into account the efficient and stable photodegradation of SMX, the hydrochar/Ag3PO4 composite holds great potential as a sustainable visible-light-responsive photocatalyst for water remediation and pollutant degradation.Conflicts of interest
There are no conflicts to declare.Acknowledgements
This research was financially supported by the Youth Talent Development Plan of Shanghai Municipal Agricultural System (Grant No. 20180126), the State Key Laboratory of Pollution Control and Resource Reuse Foundation (Grant No. PCRRF18001), the Shanghai Agriculture Applied Technology Development Program (Grant No. 2019-02-08-00-12-F01136), and Shanghai Municipal Science and Technology Commission (Grant No. 19295801000).References
- Z. Yi, J. Ye, N. Kikugawa, T. Kako, S. Ouyang, H. Stuart-Williams, H. Yang, J. Cao, W. Luo, Z. Li, Y. Liu and R. L. Withers, Nat. Mater., 2010, 9, 559–564 CrossRef CAS.
- H. Wang, Y. Bai, J. Yang, X. Lang, J. Li and L. Guo, Chem.–Eur. J., 2012, 18, 5524–5529 CrossRef CAS.
- X. Yang, L. Tian, X. Zhao, H. Tang, Q. Liu and G. Li, Appl. Catal., B, 2019, 244, 240–249 CrossRef CAS.
- F. Wu, F. Zhou, Z. Zhu, S. Zhan and Q. He, Chem. Phys. Lett., 2019, 724, 90–95 CrossRef CAS.
- H. Cai, L. Sun, Y. Wang, T. Song, M. Bao and X. Yang, Chem. Eng. J., 2019, 369, 1078–1092 CrossRef CAS.
- J. Liu, F. Xie, R. Li, T. Li, Z. Jia, Y. Wang, Y. Wang, X. Zhang and C. Fan, Mater. Sci. Semicond. Process., 2019, 97, 1–10 CrossRef CAS.
- Y. Chang, K. Yu, C. Zhang, R. Li, P. Zhao, L.-L. Lou and S. Liu, Appl. Catal., B, 2015, 176–177, 363–373 CrossRef CAS.
- C. Zhang, K. Yu, Y. Feng, Y. Chang, T. Yang, Y. Xuan, D. Lei, L.-L. Lou and S. Liu, Appl. Catal., B, 2017, 210, 77–87 CrossRef CAS.
- L. Zhou, W. Zhang, L. Chen, H. Deng and J. Wan, Catal. Commun., 2017, 100, 191–195 CrossRef CAS.
- L. Chen, S. Yang, Y. Huang, B. Zhang, F. Kang, D. Ding and T. Cai, J. Hazard. Mater., 2019, 371, 566–575 CrossRef CAS PubMed.
- Y. Duan, L. Deng, Z. Shi, L. Zhu and G. Li, Chem. Eng. J., 2019, 359, 1379–1390 CrossRef CAS.
- M. M. Mian and G. Liu, RSC Adv., 2018, 8, 14237–14248 RSC.
- S.-H. Kong, S.-K. Loh, R. T. Bachmann, S. A. Rahim and J. Salimon, Renewable Sustainable Energy Rev., 2014, 39, 729–739 CrossRef CAS.
- C. A. Mullen, A. A. Boateng, N. M. Goldberg, I. M. Lima, D. A. Laird and K. B. Hicks, Biomass Bioenergy, 2010, 34, 67–74 CrossRef CAS.
- W.-J. Liu, H. Jiang and H.-Q. Yu, Chem. Rev., 2015, 115, 12251–12285 CrossRef CAS.
- L. Lu, R. Shan, Y. Shi, S. Wang and H. Yuan, Chemosphere, 2019, 222, 391–398 CrossRef CAS.
- S. Li, Z. Wang, X. Zhao, X. Yang, G. Liang and X. Xie, Chem. Eng. J., 2019, 360, 600–611 CrossRef CAS.
- X.-Q. Liu, W.-J. Chen and H. Jiang, Chem. Eng. J., 2017, 308, 889–896 CrossRef CAS.
- H. S. Kambo and A. Dutta, Renewable Sustainable Energy Rev., 2015, 45, 359–378 CrossRef CAS.
- N. Chen, Y. Huang, X. Hou, Z. Ai and L. Zhang, Environ. Sci. Technol., 2017, 51, 11278–11287 CrossRef CAS.
- K. Sun, K. Ro, M. Guo, J. Novak, H. Mashayekhi and B. Xing, Bioresour. Technol., 2011, 102, 5757–5763 CrossRef CAS.
- Y. O. Donar, S. Bilge, A. Sinag and O. Pliekhov, Chemcatchem, 2018, 10, 1134–1139 CrossRef CAS.
- G. Siedlewicz, M. Borecka, A. Bialk-Bielinska, K. Sikora, P. Stepnowski and K. Pazdro, Oceanologia, 2016, 58, 221–234 CrossRef.
- L. Zhou, H. Deng, W. Zhang and Y. Gao, Fresenius Environ. Bull., 2015, 24, 1685–1691 CAS.
- M. Li, H. Huang, S. Yu, N. Tian, F. Dong, X. Du and Y. Zhang, Appl. Surf. Sci., 2016, 386, 285–295 CrossRef CAS.
- Q. Yan, M. Xu, C. Lin, J. Hu, Y. Liu and R. Zhang, Environ. Sci. Pollut. Res., 2016, 23, 14422–14430 CrossRef CAS.
- Y. Bi, S. Ouyang, N. Umezawa, J. Cao and J. Ye, J. Am. Chem. Soc., 2011, 133, 6490–6492 CrossRef CAS.
- W. Yao, J. Yang, J. Wang and Y. Nuli, Electrochem. Commun., 2007, 9, 1029–1034 CrossRef CAS.
- A. B. Fuertes, M. C. Arbestain, M. Sevilla, J. A. Macia-Agullo, S. Fiol, R. Lopez, R. J. Smernik, W. P. Aitkenhead, F. Arce and F. Macias, Aust. J. Soil Res., 2010, 48, 618–626 CrossRef CAS.
- S.-X. Zhao, N. Ta and X.-D. Wang, Energies, 2017, 10, 15 Search PubMed.
- L. Pi, R. Jiang, W. Zhou, H. Zhu, W. Xiao, D. Wang and X. Mao, Appl. Surf. Sci., 2015, 358, 231–239 CrossRef CAS.
- X. Wang, X. Wang, J. Zhao, J. Song, L. Zhou, R. Ma, J. Wang, X. Tong and Y. Chen, Catal. Sci. Technol., 2017, 7, 2335–2346 RSC.
- Q. Cao, L. Xiao, L. Zeng, C. Cao and J. Wang, Powder Technol., 2017, 321, 1–8 CrossRef CAS.
- L. Zhao, X. F. Chen, X. C. Wang, Y. J. Zhang, W. Wei, Y. H. Sun, M. Antonietti and M. M. Titirici, Adv. Mater., 2010, 22, 3317–3321 CrossRef CAS.
- G. M. An, W. H. Ma, Z. Y. Sun, Z. M. Liu, B. X. Han, S. D. Miao, Z. J. Miao and K. L. Ding, Carbon, 2007, 45, 1795–1801 CrossRef CAS.
- Q. Xiang, D. Lang, T. Shen and F. Liu, Appl. Catal., B, 2015, 162, 196–203 CrossRef CAS.
- Z. Mu, J. Hua, S. Kumar Tammina and Y. Yang, Colloids Surf., A, 2019, 578, 123643 CrossRef.
- Y. Hou, F. Zuo, Q. Ma, C. Wang, L. Bartels and P. Feng, J. Phys. Chem. C, 2012, 116, 20132–20139 CrossRef CAS.
- W. Zhai, G. Li, P. Yu, L. Yang and L. Mao, J. Phys. Chem. C, 2013, 117, 15183–15191 CrossRef CAS.
- H. Zhang, Z. Wang, R. Li, J. Guo, Y. Li, J. Zhu and X. Xie, Chemosphere, 2017, 185, 351–360 CrossRef CAS.
- L. Liu, Y. Qi, J. Lu, S. Lin, W. An, Y. Liang and W. Cui, Appl. Catal., B, 2016, 183, 133–141 CrossRef CAS.
- L. Zhou, O. G. Alvarez, C. S. Mazon, L. Chen, H. Deng and M. Sui, Catal. Sci. Technol., 2016, 6, 5972–5981 RSC.
- P. Dong, Y. Wang, B. Cao, S. Xin, L. Guo, J. Zhang and F. Li, Appl. Catal., B, 2013, 132–133, 45–53 CrossRef CAS.
- Y. Chai, J. Ding, L. Wang, Q. Liu, J. Ren and W.-L. Dai, Appl. Catal., B, 2015, 179, 29–36 CrossRef CAS.
- P. Gamache, R. McCarthy, J. Waraska and I. Acworth, Am. Lab., 2003, 35, 21–25 CAS.
- F. Gagné, C. Blaise and C. André, Ecotoxicol. Environ. Saf., 2006, 64, 329–336 CrossRef.
- J. F. Dai, T. Xian, L. J. Di and H. Yang, J. Nanomater., 2013, 642897, 5 Search PubMed.
- W. Yin, W. Wang and S. Sun, Catal. Commun., 2010, 11, 647–650 CrossRef CAS.
- M. Miyauchi, Phys. Chem. Chem. Phys., 2008, 10, 6258–6265 RSC.
- H. Katsumata, M. Taniguchi, S. Kaneco and T. Suzuki, Catal. Commun., 2013, 34, 30–34 CrossRef CAS.
- B. H. J. Bielski, D. E. Cabelli, R. L. Arudi and A. B. Ross, J. Phys. Chem. Ref. Data, 1985, 14, 1041–1100 CrossRef CAS.
Footnote |
| † Electronic supplementary information (ESI) available. See DOI: 10.1039/c9ra07843f |
| This journal is © The Royal Society of Chemistry 2019 |