 Open Access Article
Creative Commons Attribution 3.0 Unported Licence
Enhanced resistance to calcium poisoning on Zr-modified Cu/ZSM-5 catalysts for the selective catalytic reduction of NO with NH3
Hongyan Xuea,
Tao Menga,
Fangfang Liua,
Xiaoming Guo *a,
Shengdong Wangb and
Dongsen Mao
 *a
*a
aResearch Institute of Applied Catalysis, School of Chemical and Environmental Engineering, Shanghai Institute of Technology, Shanghai 201418, PR China. E-mail: guoxiaoming@sit.edu.cn; dsmao@sit.edu.cn; Fax: +86 21 60873301; Tel: +86 21 60873301
bShanghai Institute for Design & Research in Environmental Engineering Co., Ltd., Shanghai 200232, PR China
First published on 25th November 2019
Abstract
Ca/ZrCu/ZSM-5 catalysts containing different Zr contents were prepared by incipient wetness impregnation. The catalysts were tested for the selective catalytic reduction (SCR) of NOx with ammonia and characterized by N2-BET, N2O titration, XRD, NH3-TPD, H2-TPR, and XPS techniques. In the temperature range of 100–170 °C, after calcium impregnation, NOx conversion over the Cu/ZSM-5 catalyst decreased by 11.3–24.3%, while that over Zr0.10/Cu/ZSM-5 only decreased by 3.8–12.2%. The improvement of the calcium poisoning resistance of the ZrCu/ZSM-5 catalyst is mainly attributed to an increase in the dispersion and the surface concentration of Cu. Moreover, the addition of zirconium promotes the reduction of CuO by decreasing the interaction between CuO and CaO, which also contributes to the improvement of resistance to CaO poisoning. The apparent activation energy and turnover frequency for the SCR reaction over the Ca/ZrxCu/ZSM-5 catalysts were calculated and discussed.
1. Introduction
As major air pollutants, nitrogen oxides (NOx) result in a series of environmental issues, such as photochemical smog, acid rain, and ozone depletion.1–3 Recently, researchers found that NOx is also one of the key factors for the formation and evolution of haze, which is harmful to the ecological environment and human health.4 Many effects have been devoted to reduce the emission of NOx. Among the technologies for the removal of NOx, selective catalytic reduction (SCR) of NOx with ammonia is the most effective and economical technique.5–9Due to the poor low-temperature catalytic activity of vanadia-based catalysts,10–12 the SCR reactor must be installed upstream of the desulfurization system and electrostatic precipitator. Several common poisons in the fly ash including SO2 and heavy metals, especially alkali/alkaline earth metals deactivate the catalyst severely.13,14 Cu-based catalysts have been deemed to be a competitive candidate for SCR reaction because of its excellent low-temperature activity, remarkable hydrothermal stability and environmentally benign property.5,15–18 The SCR reactor using Cu-based catalyst could be placed downstream of the desulfurization system and electrostatic precipitator, and the harmfulness of fly ash to the catalyst was cut down remarkably. However, trace alkali metal and alkaline earth metal still remains in the flue gases, and the poisoning effect is inevitable.19–21 Putluru et al.19 reported that the decrease in the catalytic activity of Cu/zeolite catalyst by K loading was mainly attributed to the loss of the surface acid sites and the decline of the ability for reduction of CuO. Fan et al.20 pointed out that the NH3-SCR activity on the Cu/SSZ-13 catalyst was greatly reduced with the introduction of alkali metal. They indicated that the zeolite structures of the poisoned catalyst were seriously deteriorated and the amount of active sites (Cu(II)) was decreased significantly. Thus, it is necessary to improve the resistance of catalyst to alkali metals and alkaline earth metals. Many researchers attempt to improve the resistance of vanadium-based and manganese-based catalysts to alkali and alkaline earth metals.22–26 For instance, Due-Hansen et al.22 pointed out that the resistance to potassium poisoning of the vanadia-based catalysts supported on tungstated and sulfated zirconia was significantly improved comparing with the traditional V2O5/TiO2 catalyst. In that case, the potassium preferentially interacted with the sulfate and/or tungstate, and the poisoning effect was alleviated largely. Peng et al.26 reported that the potassium poisoning of MnOx/TiO2 catalyst is due to the decline of reducibility, the decrease in surface acidity and the enhanced stability of nitrite/nitrate species. After the modification with CeO2, the resistance to the potassium poisoning was improved, and the reasons were ascribed to that the cerium could provide the surface acid sites, which was difficult to be neutralized by alkali atoms. Moreover, the influence of potassium on the 4f orbitals of Ce is negligible, which stabilizes the reducibility of catalyst for NH3 activation. Unfortunately, the investigations concerning the improvement of calcium resistance of the Cu/zeolite catalysts for the selective catalytic reduction of NOx are quite few.
In this study, Ca/ZrCu/ZSM-5 catalysts containing different Zr content were prepared and tested for the SCR of NOx. This study focuses on the promoting effects of ZrO2 on the resistance to Ca poisoning over the Cu/ZSM-5 catalyst. Moreover, the physicochemical properties of the catalysts were investigated, and the relationship between the physicochemical properties and the activity of catalysts was discussed.
2. Experimental section
2.1. Catalyst preparation
ZrCu/ZSM-5 catalysts containing a constant copper content of 4 wt% and variable amount of zirconium were prepared with the impregnation method.21 The commercial zeolite H-ZSM-5 (Si/Al = 38) was purchased from the catalyst plant of Nankai University, Tianjin, China. Typically, a certain amount of aqueous solutions of Cu(NO3)2·3H2O and Zr(NO3)4·5H2O were slowly dropped into the support H-ZSM-5 and stirred at room temperature. The as-impregnated precursor was dried at 120 °C and then calcined at 550 °C for 4 h in air atmosphere. The as-prepared catalysts were termed as ZrxCu/Z, where x is the weight ratio of Zr to ZSM-5 and expresses in percentage; for example, x = 0.05 means that the weight percentage of Zr to ZSM-5 equals 0.05%. The CaO-impregnated ZrxCu/Z catalysts, with a constant weight ratio of Ca to ZSM-5 of 1.26%, were prepared via impregnating the ZrxCu/Z catalysts with Ca(NO3)2 solution and denoted as Ca/ZrxCu/Z. Prior to the evaluation of the catalytic activity, the catalysts were tableted, and then granulated and screened to a size of 40–60 meshes.2.2. Catalyst characterization
Full nitrogen adsorption/desorption isotherms at −196 °C were obtained after degassing at 200 °C, using an adsorption apparatus (Micromeritics ASAP-2020 HD88). The specific surface areas of catalysts (SBET) and the average pore size were estimated with the BET and BJH method.The copper surface area (SCu) was measured by N2O pulse titration using a gas sampling valve. Approximately 0.1 g of sample was packed into a quartz tube reactor and reduced in an H2/N2 mixture (10 vol%) for 1 h at 300 °C. After being purged with He to remove any weakly adsorbed H2, the catalyst was cooled to 80 °C under He. Next, a gas mixture of N2O/He (2 vol%) was intermittently injected into the reactor until the reaction was completed. N2O and N2 in the effluent were analyzed by a mass spectrometer (Pfeiffer Vacuum). The metallic copper surface area was calculated from the following equation assuming an atomic copper surface density of 1.46 × 10¹⁹ atoms per m2.27–29
| 2Cu(s) + N2O(g) = Cu2O(s) + N2(g) | (1) |
X-ray diffraction (XRD) pattern was recorded on a PANalytical X'Pert instrument with Ni-filtered Cu Kα radiation at 40 kV and 40 mA. Scans were made in the 2θ range of 20°–60° with a scanning speed of 6° min−1.
Temperature-programmed desorption of ammonia (NH3-TPD) was employed to determine the surface acidity of the samples. First, approximately 0.1 g of the sample was flushed with N2 gas at 400 °C for 20 min. Then, the sample was cooled to 50 °C and saturated with ammonia at the same temperature. Subsequently, a pure N2 stream was passed over the catalysts at 100 °C in order to remove the physisorption molecules. TPD experiments were started with a heating rate of 5 °C min−1 from 100 to 600 °C.
H2-TPR was performed in a continuous-flow apparatus equipped with a thermal conductivity detector (TCD). First, 50 mg of sample was purged by N2 at 400 °C for 20 min. After cooling down to room temperature, the reducing gas of 10% H2/N2 was switched on, and then H2-TPR measurements were carried out with a heating rate of 5 °C min−1. The amount of consumed H2 was measured by the TCD.
The XPS and Auger electron spectroscopy were recorded on an ESCALA 250 Xi spectrometer using a standard Al Kα X-ray source (1486.6 eV). The binding energy value was calibrated with C 1s = 284.6 eV as a reference. The reduction of catalyst was performed in a separate reaction chamber, and the samples were transferred by a transfer rod without exposure to air.
2.3. Catalytic activity and kinetic tests
SCR activity measurement was carried out in a flow-type apparatus designed for continuous operation at atmospheric pressure. The reactant gas was composed of 500 ppm NO, 500 ppm NH3, 5% O2 and balanced N2. 0.15 g of catalyst was packed into a fixed-bed quartz reactor with an inner diameter of 6 mm. The space velocity was 80![[thin space (1/6-em)]](https://www.rsc.org/images/entities/char_2009.gif) 000 ml g−1 h−1 and the reaction temperature ranged from 100 to 400 °C. The composition of the exhaust gases was monitored by flue gas analyzer (Testo 340), and the conversion of NOx was calculated using the following equation:
000 ml g−1 h−1 and the reaction temperature ranged from 100 to 400 °C. The composition of the exhaust gases was monitored by flue gas analyzer (Testo 340), and the conversion of NOx was calculated using the following equation:
 | (2) |
Steady-state reaction rates were obtained from 100 to 150 °C, and the SCR reaction rates per gram of catalyst were calculated by the following equation:
 | (3) |
The turnover frequency (TOF) of the NH3-SCR reaction, defined as the number of NOx molecules converted per metallic copper atom per second, can be calculated by the equation:
 | (4) |
3. Results and discussion
3.1. Textural and structural properties
Table 1 shows the textural properties of the investigated catalysts. The BET surface area (SBET) of the Cu/Z catalyst is 267.3 m2 g−1, which decreases to 249.1 m2 g−1 after Ca loading. For the Ca/ZrxCu/Z catalysts, with the increase in Zr content, there is a little change in the BET surface area, the total pore volume and the average pore diameter. However, as the zirconium content reached 0.40 wt%, the SBET declined to a value of 220.8 m2 g−1. The reason may be ascribed to the blocking of zeolite pores by CaO and ZrO2. For comparison, the textural properties of Zr0.10Cu/Z are also presented in Table 1. The SBET value (279.1 m2 g−1) of Zr0.10Cu/Z is slightly larger than that of Cu/Z catalyst.| Catalyst | BET surface area (m2 g−1) | Total pore volume (cm3 g−1) | Average pore diameter (nm) | Cu surface areaa (m2 g−1) | Ea (kJ mol−1) | TOF × 103b (s−1) |
|---|---|---|---|---|---|---|
| a Determined by N2O titration method.b Calculated using the eqn (4) at the reaction temperature of 140 °C. | ||||||
| Cu/Z | 267.3 | 0.16 | 2.51 | 0.43 | 23.9 | 24.7 |
| Ca/Cu/Z | 249.1 | 0.16 | 2.51 | 0.37 | 32.3 | 21.1 |
| Ca/Zr0.05Cu/Z | 242.1 | 0.16 | 2.58 | 0.54 | 26.9 | 16.1 |
| Ca/Zr0.10Cu/Z | 247.2 | 0.15 | 2.48 | 0.62 | 24.2 | 15.8 |
| Ca/Zr0.20Cu/Z | 248.8 | 0.15 | 2.50 | 0.52 | 26.4 | 17.1 |
| Ca/Zr0.40Cu/Z | 220.8 | 0.14 | 2.59 | 0.42 | 27.2 | 19.5 |
| Zr0.10Cu/Z | 279.1 | 0.16 | 2.41 | 0.71 | 23.2 | 15.7 |
The metallic copper surface area (SCu) was measured with the N2O titration method and presented in Table 1. After Ca loading, the SCu of Cu/Z catalyst decreases from 0.43 to 0.37 m2 g−1, which is ascribed to the coverage of surface copper by CaO. With the addition of zirconium, the SCu of the catalysts increased remarkably, and a maximum of 0.62 m2 g−1 was obtained for the Ca/Zr0.10Cu/Z catalyst. This phenomenon indicates that the dispersion of copper can be promoted by the addition of an appropriate amount of zirconium. In comparison with Cu/Z catalyst, the reference catalyst Zr0.10Cu/Z possess a much larger SCu (0.71 m2 g−1), which further verifies the promotion of Zr for the dispersion of Cu. The reason for this is attributed to that the Zr doping inhibits the aggregation of CuO species on the surface of catalyst.
The XRD patterns of the Cu/Z and Ca/ZrxCu/Z catalysts are shown in Fig. 1(A). All the samples exhibit the characteristic diffraction peaks of ZSM-5 (PDF #44-0003), which indicates that the zeolite structure remains unchanged after the impregnation of copper, calcium and zirconium. With increasing zirconium content, the intensity of diffraction peaks of ZSM-5 zeolite decreased slightly. The weak diffraction peaks at 35.5° and 38.7° correspond to the CuO (PDF #45-0937) suggesting the formation of crystalline CuO over Cu/Z and Ca/ZrxCu/Z. For all the samples, no characteristic diffraction peak of zirconium oxide and calcium oxide was observed, and the result implies that the zirconium and calcium species exist in a low degree of crystallinity or in a high dispersion. Moreover, the XRD patterns of the Ca/ZrxCu/Z catalysts reduced at 300 °C were obtained and presented in Fig. 1(B). The characteristic peaks of the cubic metallic Cu were observed at 43.5° and 50.4° for all the samples accompanied with the disappearance of characteristic peaks of CuO, and no diffraction peak of Cu+ was detected. These results suggested that CuO in the sample was transformed into Cu0 after the reduction.
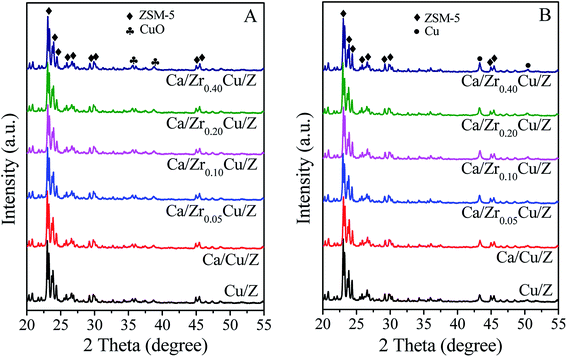 | ||
| Fig. 1 XRD patterns of Cu/Z and Ca/ZrxCu/Z catalysts: (A) calcined catalysts and (B) reduced catalysts. | ||
3.2. NH3-TPD analysis
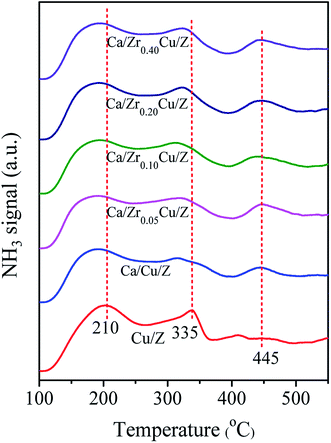
For the NH3-SCR reaction, it is important to determine the surface acidity of catalyst.30 The NH3 desorption profiles over Cu/Z and Ca/ZrxCu/Z catalysts are shown in Fig. 2. Three desorption peaks were observed at 210, 335 and 445 °C for the Cu/Z catalyst. Here, the peaks located at 210 and 445 °C can be reasonably assigned to the weak acid sites and strong acid sites over the surface of HZSM-5, respectively.21,31,32 The peak located at 335 °C corresponds to the desorption of NH3 from the metal ion (Cu2+ in this case).21,33–35 After the Ca impregnation, the peak at 335 °C weakened indicating that the loading of calcium reduces the amount of Lewis acid sites. Compared with Ca/Cu/Z sample, no significant change in the NH3-desorption profiles can be discerned over the Ca/ZrxCu/Z catalysts, and this result illustrates that the addition of zirconium exerts little influence on the acidity of Ca/Cu/Z catalyst.3.3. H2-TPR analysis
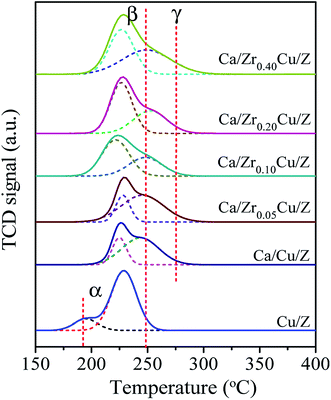
The H2-TPR profiles of the Cu/Z and Ca/ZrxCu/Z samples are presented in Fig. 3. There are two reduction peaks in the TPR profile of the Cu/Z catalyst appearing at about 195 °C and 230 °C, respectively. The low temperature peak (α peak) is related to the highly dispersed CuO on the surface of catalyst, while the high temperature reduction peak (β peak) can be assigned to the bulk CuO.32 After CaO loading, α peak disappeared because the highly dispersed copper species was covered by CaO. Moreover, β peak became broad and a shoulder appeared on the high-temperature side (denoted as γ peak). There is an interaction between copper species and CaO, which decreases the reducibility of CuO.21 Therefore, γ peak corresponds to the reduction of bulk-like CuO interacted with CaO strongly, and a similar result was reported by Liu et al.36 The positions and relative contributions of reduction peak (β and γ peak) of the Ca/ZrxCu/Z catalysts are summarized in Table 2. With the introduction of Zr, a small shift of β peak towards the lower temperature can be observed suggesting a higher copper dispersion. Furthermore, the fraction of β peak in the TPR pattern increases first and then decreases with the increase in Zr loading, and a maximum was obtained over the sample of Ca/Zr0.10Cu/Z. These results indicate that the introduction of appropriate amount Zr increase the copper dispersion and weaken the interaction between the CuO and CaO.| Catalyst | Peak β | Peak γ | ||
|---|---|---|---|---|
| Temperature (°C) | Fraction (%) | Temperature (°C) | Fraction (%) | |
| Ca/Cu/Z | 225 | 27.8 | 244 | 72.2 |
| Ca/Zr0.05Cu/Z | 228 | 29.0 | 245 | 71.0 |
| Ca/Zr010Cu/Z | 221 | 61.2 | 248 | 38.8 |
| Ca/Zr0.20Cu/Z | 226 | 59.5 | 250 | 40.5 |
| Ca/Zr0.40Cu/Z | 226 | 48.4 | 249 | 51.6 |
Some researchers37,38 reported that there are two types divalent copper (Cu(II)) in the zeolite supported copper catalysts. One is the common Cu(II) existing in the CuO crystallite (denoted as cry-CuO); the other is the isolated Cu2+ (denoted as iso-Cu2+), which forms via the ion-exchange between Cu2+ and zeolite during the catalyst preparation process. The reduction of cry-CuO is a one-step reduction, i.e. CuO reduces to Cu0 directly, and the reduction generally occurs in the temperature range of 200–300 °C. Two steps are involved in the reduction of iso-Cu2+: first, the isolated Cu2+ reduces to isolated Cu+ (iso-Cu+) in the range of 200–300 °C; second, at a temperature above 330 °C, the reduction of iso-Cu+ to Cu0 happens. However, in this case, there are no peaks corresponding to the reduction of iso-Cu2+ and iso-Cu+. The reason is ascribed to that, with the wet impregnation method to prepare Cu/zeolite catalyst, the amount of iso-Cu2+ is too small to be detected by TPR technique. The XRD results of catalysts reduced at 300 °C also confirmed the absence of iso-Cu+.
3.4. XPS analysis
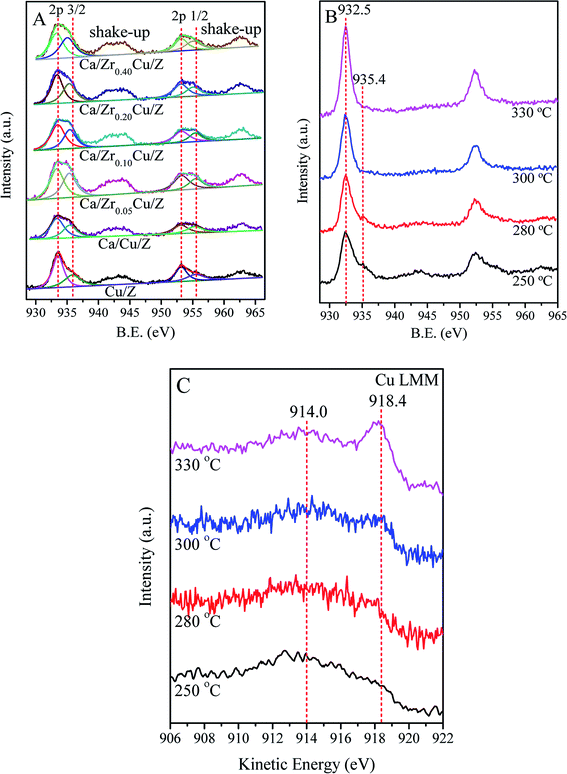
Fig. 4(A) shows the results of the Cu 2p of the calcined Cu/Z and Ca/ZrxCu/Z samples. The binding energies (BE) of Cu 2p3/2 and Cu 2p1/2 appear at around 933.6 eV and 953.2 eV, respectively.39,40 The presence of shakeup satellite peaks at about 943.0 eV and 963.0 eV reveals that the divalent copper (Cu(II)) is presented in Cu/Z and Ca/ZrxCu/Z catalysts. The spectra of Cu 2p3/2 of all catalysts were deconvoluted into two peaks at around 933.0 eV and 935.4 eV. The former corresponds to the Cu(II) in CuO crystallites (cry-CuO), as demonstrated by the XRD results; the latter can be assigned to the isolated Cu2+ (iso-Cu2+) species produced during the catalyst preparation process.6,37 As shown in Table 3, the peaks of Cu 2p3/2 on the Cu/Z catalyst slightly shift towards lower energy with Ca loading. The reason for this is that the Ca with a higher electron donating ability can drive electrons to Cu resulting in a lower BE of Cu species.21 Furthermore, the effect of the amount of zirconium on the BE values of Cu 2p3/2 is indiscernible.| Catalyst | Surface concentration (at%) | Cu 2p3/2 (B.E.) | Cu 2p1/2 (B.E.) | Cry-CuO/iso-Cu2+a | ||||
|---|---|---|---|---|---|---|---|---|
| Cu | Ca | Zr | CuO | Iso-Cu2+ | CuO | Iso-Cu2+ | ||
| a The peak area ratio of CuO crystallites to isolated Cu2+ ions in XPS spectrum. | ||||||||
| Cu/Z | 1.22 | — | — | 933.6 | 935.9 | 953.2 | 955.5 | 1.72 |
| Ca/Cu/Z | 1.06 | 1.12 | — | 933.3 | 935.4 | 953.1 | 955.3 | 1.49 |
| Ca/Zr0.05Cu/Z | 1.90 | 1.19 | 0.24 | 933.3 | 935.3 | 953.1 | 955.3 | 1.40 |
| Ca/Zr0.10Cu/Z | 2.16 | 1.15 | 0.36 | 933.3 | 935.4 | 953.1 | 955.3 | 1.49 |
| Ca/Zr0.20Cu/Z | 1.75 | 1.19 | 0.48 | 933.3 | 935.3 | 953.1 | 955.3 | 1.46 |
| Ca/Zr0.40Cu/Z | 1.70 | 1.22 | 0.71 | 933.3 | 935.3 | 953.2 | 955.3 | 1.42 |
The surface compositions of the catalysts were also presented in Table 3. The amount of surface Cu atoms of the Cu/Z catalysts reduces from 1.22% to 1.06% with Ca loading. With the addition of Zr, the amount of surface Cu of Ca/Cu/Z catalysts increases remarkably, indicating that Zr enriches the copper species on the catalyst surface. The amount of Cu atom reached a maximum (2.16%) as the zirconium of 0.10 wt% was loaded. As for the amount of Ca atom on the surface of the catalysts, only a slight change can be found with the increase in Zr loading. It was well-documented that, for the NH3-SCR reaction, cry-CuO and iso-Cu2+ in Cu/zeolite were both the active sites.6,37,41 The ratios of cry-CuO to iso-Cu2+ were calculated from the corresponding peak areas in XPS spectra and presented in Table 3. The result showed that cry-CuO was predominant on the surface of all catalysts, but with the addition calcium, the ratio of cry-CuO to iso-Cu2+ decreased from 1.72 to 1.49. After the addition of zirconium in the Ca/Cu/Z catalyst, the ratio of cry-CuO to iso-Cu2+ is almost a constant.
In order to get further insight into the change in chemical state of copper element on the surface of catalyst, in situ XPS for the catalyst reduced at different temperature was carried out in this case. Fig. 4(B) shows the results of the Cu 2p of Ca/Zr0.10Cu/Z catalyst reduced at 250, 280, 300 and 330 °C. With the increase in the reduction temperature, the shakeup feature of the Ca/Zr0.10Cu/Z catalyst weakened gradually. As the temperature reaches 300 °C, the shakeup peaks disappeared completely, and the characteristic feature of the iso-Cu2+ species (ca. 935.4 eV) vanished. These results indicated that both the cry-CuO and iso-Cu2+ were reduced completely at 300 °C. However, the Cu0 and Cu+ species cannot be differentiated because the Cu 2p3/2 BE values of Cu0 and Cu+ are nearly identical (ca. 932.5 eV). Fortunately, the LMM Auger spectra of Cu0 (∼918.8 eV) and Cu+ (existed as Cu2O, ∼916.8 eV) are separated by approximately 2.0 eV, and they can be used to distinguish the valence state of Cu. In this work, the Auger electron spectroscopy of the Ca/Zr0.10Cu/Z catalyst at the reduction temperature of 250, 280, 300 and 330 °C were also collected and presented in Fig. 4(C). At 250 °C, the Cu (LMM) Auger peaks centered at around 914.0 eV can be observed suggesting the existence of isolated Cu+ (iso-Cu+).42 It is worth to mention that, the Cu Auger is peculiarly sensitive to chemical state,42–44 and the Auger spectra of iso-Cu+ is different from that of Cu+ in Cu2O. In this case, the Auger peak appears at around 914.0 eV rather than 916.8 eV. With the increase in the reduction temperature, the Auger peaks of Cu+ became weaker accompanied with an increase in the peak intensity of 918.4 eV (Cu0). When the reduction temperature is up to 330 °C, Cu+ was reduced almost completely to Cu0.
3.5. SCR activity and kinetic measurements
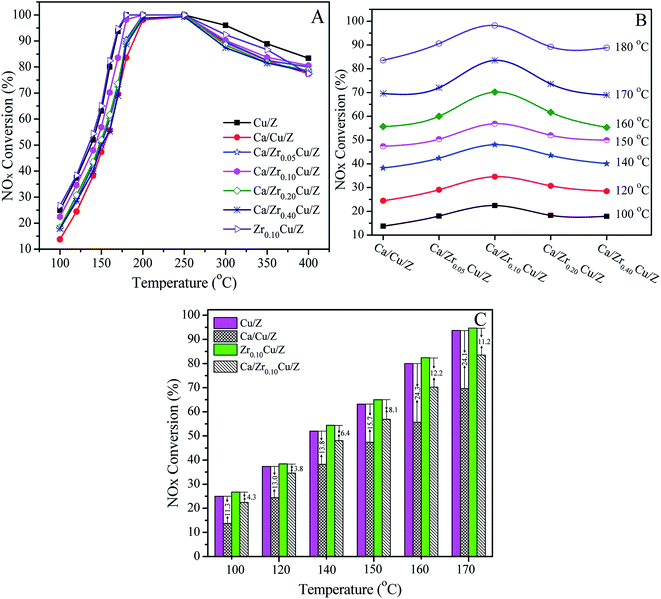
The catalytic activities of Cu/Z and Ca/ZrxCu/Z catalysts for the NH3-SCR are presented in Fig. 5(A). All the investigated catalyst exhibits a typical behavior of the SCR of NOx. First, the NOx conversion increases with increasing the reaction temperature, and after reaching a maximum at the intermediate temperature, the NOx conversion begins to decrease since the oxidation of ammonia with O2 become prevalent at a high temperature.45,46 As shown in Fig. 5(A), after the impregnation of Ca, the catalytic activity of the Cu/Z catalyst declined over the whole temperature range due to the toxic effect of CaO.21 With the introduction of zirconium, the activity of Ca/Cu/Z improved remarkably, particularly in the low-temperature region. Fig. 5(B) shows the variation of NOx conversion with the change in the content of zirconium in the temperature range of 100–180 °C. The activity of Ca/ZrxCu/Z catalyst takes on a volcano-shape variation, and the highest catalytic activity is obtained over Ca/Zr0.10Cu/Z catalyst. To gain further insight into the enhanced calcium poisoning resistance of the Zr-modified Cu/Z catalyst, NOx conversion over the Cu/Z and Zr0.10/Cu/Z catalysts with/without the calcium loading in the temperature range of 100–170 °C are shown in Fig. 5(C). After the calcium impregnation, NOx conversion over Cu/Z catalyst decreased by 11.3–24.3%, while that over Zr0.10/Cu/Z only decreased by 3.8–12.2%. Clearly, the resistance to calcium poisoning over the Zr0.10/Cu/Z catalyst improved remarkably.As reported in our previous work,21 the poisoning effect of calcium on Cu/ZSM-5 is related to the decrease in the surface Cu atoms, the decline in the reducibility of CuO and the loss of the surface acid sites. In this case, as demonstrated by the results of SCu and XPS, the addition of zirconium leads to an increase in the copper dispersion and the surface concentration of copper atoms. As shown in the part of H2-TPR, with the addition of zirconium, the interaction between CuO and CaO decreases, and the reducibility of CuO is improved. Moreover, as illustrated in the Fig. 2, there is no significant change in the surface acid sites. Therefore, in this study, the enhanced resistance to Ca poisoning results from the improvement of the Cu dispersion and the reducibility of CuO.
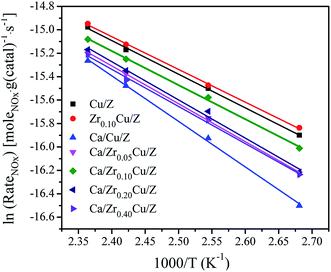
The NH3-SCR reaction rates per gram of catalyst over Cu/Z and Ca/ZrxCu/Z catalysts were calculated by eqn (3) in the temperature range 100–150 °C. In such a temperature range, the conversions of NOx are low, and the reaction is far from thermodynamic equilibrium. Arrhenius plots of the SCR reaction rates over Cu/Z and Ca/ZrxCu/Z catalysts are shown in Fig. 6. According to the linear relationship between the reaction rate and the reciprocal of temperature, the apparent activation energy (Ea) was determined. As shown in Table 1, the Ea for NH3-SCR reaction of Cu/Z catalyst is similar to that of Zr0.10Cu/Z catalyst. The apparent activation energy increases over Cu/Z catalyst after Ca loading. While with the addition of zirconium, the apparent activation energy of Ca/Cu/Z catalyst decreases, and Ca/Zr0.10Cu/Z catalyst possessed the minimum value of apparent activation energy in all Ca-impregnating catalysts. Evidently, the variation trend of the apparent activation energy with the increase in the amount of Zr is agreement with that of NOx conversion.
Turnover frequencies (TOF) of NH3-SCR reaction at 140 °C, which represents the number of NOx molecules converted per metallic copper atom per second, was calculated by eqn (4) for the investigated catalysts, and the results are also presented in Table 1. The values of TOF varied in the range of 15.7–24.7 × 10⁻³ s−1. After the Ca impregnation, the value of TOF over the Cu/Z catalyst decreases. With the addition of zirconium, the TOF of Ca/ZrxCu/Z catalysts decreases further, and a minimum is observed on the Ca/Zr0.10Cu/Z catalyst. The result of TOF reveals that the introduction of zirconium improves the catalytic activity via increasing the amount of Cu active sites not the activity per Cu-site. Actually, instead of increasing, the activity per Cu-site decreases. Moreover, the TOF varies with the change in the dispersion of Cu suggests that the SCR reaction over the Ca/ZrxCu/Z catalyst is a structurally sensitive reaction.
4. Conclusion
With the addition of zirconium, an enhanced calcium poisoning resistance of Cu/ZSM-5 catalyst for the SCR of NO was obtained. The introduction of zirconium gives rise to an increase in SCu and the surface concentration of copper atoms, which is the main reason responsible for the improvement of catalytic activity. The introduction of zirconium decreases the interaction between the CuO and CaO and further promotes the reduction of CuO. Moreover, there is no significant change in the acidity of Ca/Cu/Z after the addition of zirconium. The optimum addition amount of zirconium is 0.10%, and the highest catalytic activity was obtained over the corresponding catalyst.Conflicts of interest
There are no conflicts to declare.Acknowledgements
The work was supported by Shanghai Promotion Association of Tech-Transfer (No. LM201641), Shanghai Municipal Education Commission (International Visiting Scholar Program, No. 2014-56) and Shanghai Municipal Science and Technology Commission (No. 13ZR1441200).References
- G. Busca, L. Lietti, G. Ramis and F. Berti, Appl. Catal., B, 1998, 18, 1–36 CrossRef CAS.
- T. Zhang, J. Liu, D. Wang, Z. Zhao, Y. Wei, K. Cheng, G. Jiang and A. Duan, Appl. Catal., B, 2014, 148–149, 520–531 CAS.
- J. Hao, L. Wang, M. Shen, L. Li and J. Hu, Environ. Pollut., 2007, 147, 401–408 CAS.
- R. J. Huang, Y. Zhang, C. Bozzetti, K. F. Ho, J. J. Cao, Y. Han, K. R. Daellenbach, J. G. Slowik, S. M. Platt, F. Canonaco, P. Zotter, R. Wolf, S. M. Pieber, E. A. Bruns, M. Crippa, G. Ciarelli, A. Piazzalunga, M. Schwikowski, G. Abbaszade, J. Schnelle-Kreis, R. Zimmermann, Z. An, S. Szidat, U. Baltensperger, I. E. Haddad and A. S. H. Prévôt, Nature, 2014, 514, 218–222 CAS.
- P. N. R. Vennestrøm, T. V. W. Janssens, A. Kustov, M. Grill, A. Puig-Molina, L. F. Lundegaard, R. R. Tiruvalam, P. Concepción and A. Corma, J. Catal., 2014, 309, 477–490 CrossRef.
- L. Wang, J. R. Gaudet, W. Li and D. Weng, J. Catal., 2013, 306, 68–77 CrossRef CAS.
- J. W. Shi, G. Gao, Z. Fan, C. Gao, B. Wang, Y. Wang, Z. Li, C. He and C. Niu, Appl. Catal., A, 2018, 560, 1–11 CrossRef CAS.
- S. Ming, Z. Chen, C. Fan, L. Pang, W. Guo, K. B. Albert, P. Liu and T. Li, Appl. Catal., A, 2018, 559, 47–56 CrossRef CAS.
- X. Wang, X. Du, L. Zhang, Y. Chen, G. Yang and J. Ran, Appl. Catal., A, 2018, 559, 112–121 CAS.
- B. Thirupathi and P. G. Smirniotis, J. Catal., 2012, 288, 74–83 CrossRef CAS.
- S. Ali, L. Chen, F. Yuan, R. Li, T. Zhang, S. H. Bakhtiar, X. Leng, X. Niu and Y. Zhu, Appl. Catal., B, 2017, 210, 223–234 CrossRef CAS.
- M. Yates, J. A. Martín, M. Á. Martín-Luengo, S. Suárez and J. Blanco, Catal. Today, 2005, 107–108, 120–125 CrossRef CAS.
- J. Li, Y. Peng, H. Chang, X. Li, J. C. Rittenden and J. Hao, Front. Environ. Sci. Eng., 2016, 10, 413–427 CrossRef CAS.
- H. Chang, C. Shi, M. Li, T. Zhang, C. Wang, L. Jiang and X. Wang, Chin. J. Catal., 2018, 39, 710–717 CrossRef CAS.
- X. Hu, M. Yang, D. Fan, G. Qi, J. Wang, J. Wang, T. Yu, W. Li and M. Shen, J. Catal., 2016, 341, 55–61 CrossRef CAS.
- S. Lai, D. Meng, W. Zhan, Y. Guo, Y. Guo, Z. Zhang and G. Lu, RSC Adv., 2015, 5, 90235–90244 RSC.
- N. Akter, X. Chen, J. Parise, J. A. Boscoboinik and T. Kim, Korean J. Chem. Eng., 2018, 35, 89–98 CrossRef CAS.
- L. Han, X. Zhao, H. Yu, Y. Hu, D. Li, D. Sun, M. Liu, L. Chang, W. Bao and J. Wang, Microporous Mesoporous Mater., 2018, 261, 126–136 CrossRef CAS.
- S. S. R. Putluru, A. Riisager and R. Fehrmann, Appl. Catal., B, 2011, 101, 183–188 CrossRef CAS.
- C. Fan, Z. Chen, L. Pang, S. Ming, C. Dong, K. B. Albert, P. Liu, J. Wang, D. Zhu, H. Chen and T. Li, Chem. Eng. J., 2018, 334, 344–354 CrossRef CAS.
- H. Xue, X. Guo, S. Wang, C. Sun, J. Yu and D. Mao, Catal. Commun., 2018, 112, 53–57 CrossRef CAS.
- J. Due-Hansen, S. Boghosian, A. Kustov, P. Fristrup, G. Tsilomelekis, K. Ståhl, C. H. Christensen and R. Fehrmann, J. Catal., 2017, 251, 459–473 CrossRef.
- A. L. Kustov, M. Y. Kustova, R. Fehrmann and P. Simonsen, Appl. Catal., B, 2005, 58, 97–104 CrossRef CAS.
- J. Due-Hansen, A. L. Kustov, S. B. Rasmussen, R. Fehrmann and C. H. Christensen, Appl. Catal., B, 2006, 66, 161–167 CrossRef CAS.
- N. Yang, R. Guo, W. Pan, Q. Chen, Q. Wang and C. Lu, Fuel, 2016, 169, 87–92 CrossRef CAS.
- Y. Peng, J. Li, W. Si, X. Li, W. Shi, J. Luo, J. Fu, J. Crittenden and J. Hao, Chem. Eng. J., 2015, 269, 44–50 CrossRef CAS.
- O. Hinrichsen, T. Genger and M. Muhler, Chem. Eng. Technol., 2000, 23, 956–959 CrossRef CAS.
- Y. Hua, X. Guo, D. Mao, G. Lu, G. L. Rempel and F. T. T. Ng, Appl. Catal., A, 2017, 540, 68–74 CrossRef CAS.
- J. Słoczyński, R. Grabowski, A. Kozłowska, P. Olszewski, J. Stoch, J. Skrzypek and M. Lachowska, Appl. Catal., A, 2004, 278, 11–23 CrossRef.
- Y. Nie, Q. Yan, S. Chen, D. O'Hare and Q. Wang, Catal. Commun., 2017, 97, 47–50 CrossRef CAS.
- X. Liu, X. Wu, D. Weng and L. Shi, J. Rare Earths, 2016, 34, 1004–1009 CrossRef CAS.
- B. Dou, G. Lv, C. Wang, Q. Hao and K. S. Hui, Chem. Eng. J., 2015, 270, 549–556 CrossRef CAS.
- G. H. Kuehl and H. K. C. Timken, Microporous Mesoporous Mater., 2000, 35–36, 521–532 CrossRef CAS.
- L. J. Lobree, I. C. Hwang, J. A. Reimer and A. T. Bell, J. Catal., 1999, 186, 242–253 CrossRef CAS.
- J. Wang, T. Yu, X. Wang, G. Qi, J. Xue, M. Shen and W. Li, Appl. Catal., B, 2012, 127, 137–147 CrossRef CAS.
- C. Liu, X. Guo, Q. Guo, D. Mao, J. Yu and G. Lu, J. Mol. Catal. A: Chem., 2016, 425, 86–93 CrossRef CAS.
- B. Pereda-Ayo, U. D. L. Torre, M. J. Illán-Gómez, A. Bueno-López and J. R. González-Velasco, Appl. Catal., B, 2014, 147, 420–428 CrossRef CAS.
- T. Zhang, J. Shi, J. Liu, D. Wang, Z. Zhao, K. Cheng and J. Li, Appl. Surf. Sci., 2016, 375, 186–195 CrossRef CAS.
- X. Liu, X. Wu, D. Weng, Z. Si and R. Ran, Catal. Today, 2017, 281, 596–604 CrossRef CAS.
- A. Corma, A. Palomares and F. Márquez, J. Catal., 1997, 170, 132–139 CrossRef CAS.
- J. Xue, X. Wang, G. Qi, J. Wang, M. Shen and W. Li, J. Catal., 2013, 297, 56–64 CrossRef CAS.
- W. Grünert, N. W. Hayes, R. W. Joyner, E. S. Shpiro, M. R. H. Siddiqui and G. N. Baeva, J. Phys. Chem., 1994, 98, 10832–10846 CrossRef.
- G. Moretti and P. Porta, Surf. Interface Anal., 1990, 15, 47–50 CrossRef CAS.
- C. D Wagner and A. Joshi, J. Electron Spectrosc. Relat. Phenom., 1988, 47, 283–313 CrossRef.
- J. H. Kwak, D. Tran, S. D. Burton, J. Szanyi, J. H. Lee and C. H. F. Peden, J. Catal., 2012, 287, 203–209 CrossRef CAS.
- J. Li, H. Chang, L. Ma, J. Hao and R. T. Yang, Catal. Today, 2011, 175, 147–156 CrossRef CAS.
| This journal is © The Royal Society of Chemistry 2019 |

