
 Open Access Article
 This Open Access Article is licensed under a Creative Commons Attribution-Non Commercial 3.0 Unported Licence
Remote loading of curcumin-in-modified β-cyclodextrins into liposomes using a transmembrane pH gradient†
Fadwa Odeh‡
*a,
Hamdi Nsairat‡ a,
Walhan Alshaer‡*b,
Shrouq Alsotarib,
Rula Buqaienb,
Said Ismailcd,
Abdalla Awidibc and
Abeer Al Bawabae
a,
Walhan Alshaer‡*b,
Shrouq Alsotarib,
Rula Buqaienb,
Said Ismailcd,
Abdalla Awidibc and
Abeer Al Bawabae
aDepartment of Chemistry, The University of Jordan, Amman 11942, Jordan. E-mail: f.odeh@ju.edu.jo; Tel: +962 6 5355000 ext. 22152 Tel: +962 792950409
bCell Therapy Center, The University of Jordan, Amman 11942, Jordan. E-mail: walhan.alshaer@ju.edu.jo; Tel: +962 6 5355000 ext. 23960 Tel: +962 790823678
cFaculty of Medicine, The University of Jordan, Amman, Jordan
dQatar Genome Project, Qatar Foundation, Doha, Qatar
eHMCSR, The University of Jordan, Amman, Jordan
First published on 13th November 2019
Abstract
Curcumin (CRM) is a natural polyphenol with antioxidative, anti-inflammatory, and anticancer therapeutic properties. However, CRM therapeutic potential is limited by low water solubility and bioavailability. Intraliposomal remote loading describes the retention of drugs in liposome cores in response to transmembrane pH gradient. The current study describes for the first time the remote loading of CRM into liposomes using secondary (E-βCD) and tertiary (D-βCD) amino-modified β-cyclodextrins (βCDs) as carriers and solubilizers. βCDs were chemically modified to prepare the ionizable weak base functional group followed by forming a guest-host complex of CRM in the modified βCDs hydrophobic cavities via a solvent evaporation encapsulation technique. These complexes were then actively loaded into preformed liposomes, composed of DPPC/cholesterol (65/35 molar ratio) via pH gradient. The formation of CRM-βCDs inclusion complexes was characterized using UV-Vis spectroscopy, thermal analysis, and NMR spectroscopy. The complex stoichiometric ratio was determined to be 1![[thin space (1/6-em)]](https://www.rsc.org/images/entities/char_2009.gif) :1 of CRM-βCDs based on Job's plot which was also confirmed by the modified Benesi–Hildebrand equation with increasing probability of forming the 1:2 ratio of CRM-βCDs. The apparent formation constants (Kf) of 51.6, 100.9 and 55.4 mM−2 were determined for CRM-βCD, CRM-E-βCD, and CRM-D-βCD complexes, respectively. Liposome size, charge and polydispersity index indicate the presence of a homogeneous population before and after active loading. The encapsulation efficiencies of CRM-βCD complexes into pH gradient preformed liposomes were 16.5, 51.1, and 41.7 for CRM-βCD, CRM-E-βCD, and CRM-D-βCD, respectively, showing more than 5 fold increase compared to normal liposomes. The current study provides a novel remote loading approach utilizing chemically modified cyclodextrins to incorporate hydrophobic drugs into liposomes.
:1 of CRM-βCDs based on Job's plot which was also confirmed by the modified Benesi–Hildebrand equation with increasing probability of forming the 1:2 ratio of CRM-βCDs. The apparent formation constants (Kf) of 51.6, 100.9 and 55.4 mM−2 were determined for CRM-βCD, CRM-E-βCD, and CRM-D-βCD complexes, respectively. Liposome size, charge and polydispersity index indicate the presence of a homogeneous population before and after active loading. The encapsulation efficiencies of CRM-βCD complexes into pH gradient preformed liposomes were 16.5, 51.1, and 41.7 for CRM-βCD, CRM-E-βCD, and CRM-D-βCD, respectively, showing more than 5 fold increase compared to normal liposomes. The current study provides a novel remote loading approach utilizing chemically modified cyclodextrins to incorporate hydrophobic drugs into liposomes.
1. Introduction
The poor aqueous solubility of hydrophobic drugs is limiting their therapeutic applications in the clinic. Many clinically effective drugs are hydrophobic and suffer from low water solubility and bioavailability.1 Therefore, different strategies have been developed to overcome these limitations thereby improving therapeutic potency. One important strategy is the incorporation of hydrophobic drugs into carriers such as cyclodextrins and nanoparticles to enhance their solubility and bioavailability.2,3 Liposomes, consist of one or more lipid bilayers enclosing an aqueous core, are considered as one of the most successful drug delivery systems due to their biocompatibility, stability, easy to synthesize and high drug loading efficiency.4,5 Liposomal drug loading can be achieved by either passive or active methods.6 Liposomal passive loading is performed during the formation of the lipid bilayer vesicles. This approach can encapsulate the hydrophilic drug in the liposomes aqueous core, while water-insoluble drugs will accumulate in the small-sized hydrophobic lipid bilayer (∼5 nm thickness).6–9 However, the passive loading of hydrophobic drugs into the bilayer of liposomes is limited by bilayer destabilization, high lipid/drug ratio, and rapid drug release.10 Therefore, methods to solubilize hydrophobic drugs such as complexation with cyclodextrins (drug-in-cyclodextrins) were successfully applied and permitted the loading of hydrophobic molecules into the liposomes aqueous core, hence forming drug-in-cyclodextrins-in-liposomes delivery system.11 Cyclodextrins are truncated cone shape macrocyclic oligosaccharides consisting of six, seven and eight glucopyranose units for α, β and γ-cyclodextrins, respectively. Structural studies have revealed that cyclodextrins have a hydrophobic central cavity and a hydrophilic outer surface.12,13 Therefore, cyclodextrins have the ability to form complexes with specific water insoluble drug molecules via physical interactions in their hydrophobic cavities (guest–host interaction). These characteristics make them invaluable in the fields of pharmaceutics and drug delivery.14,15 Moreover, the hydroxyl groups of cyclodextrins are chemically reactive and can be modified with different functional groups that can improve pharmaceutical applications.16,17Active or remote loading has been developed to ensure high intraliposomal drug concentrations and minimal loss of precious chemotherapeutic agents.18 Remote loading can be achieved through loading drug molecules into preformed liposomes using pH gradient and/or ionic potential differences across liposomal membranes.7,10 There are two main factors that direct the success of intraliposomal active loading, (i) the water solubility of the drug, and (ii) the presence of ionizable functional group in its structure which can facilitate active loading and accumulation of drugs inside liposomes.17,19
Curcumin (CRM) (Fig. S1†), bis(4-hydroxy-3-methoxyphenyl)-1,6-diene-3,5-dione, is a polyphenol molecule derived from the rhizome of the plant Curcuma longa. Currently, CRM has important attention in medicine for the wide range of its pharmacological applications such as anti-inflammation, anti-microbial, anti-oxidant, anti-parasitic, anti-mutagenic and anti-cancer.20,21 CRM can be a good candidate for active loading into liposomes. However, CRM is missing the requirements for liposomal active loading, including its low solubility in aqueous solution (≈20 μg mL−1) and not bearing an ionizable functional group.17 Moreover, applying chemical modifications to this natural active compound can alter it's biological and chemical properties. Since incorporating drug-cyclodextrin complexes into liposomes were limited to passive loading,3,8,22 modified cyclodextrins, bearing ionizable groups (Fig. S2†), may act as a promising carrier to actively load water-insoluble drugs in liposomes core, avoiding the drug chemical modification risk.17,23 In the current work, we suggest a method for remote loading of CRM hydrophobic molecule into the aqueous core of liposomes through chemically modified β-cyclodextrins (βCDs) as carriers. In order to do so, we synthesized and characterized newly modified βCDs with weak bases as ionizable functional groups. Then, CRM was complexed with the modified βCDs and the resulting CRM-in-βCDs inclusion complexes were characterized by thermal analysis, spectroscopic proton nuclear magnetic resonance (1H-NMR) and UV-visible spectrophotometric techniques. Finally, the ability of the modified βCDs to complex and remote loading of CRM into the core of liposomes was assessed using transmembrane pH gradient method.
2. Materials and methods
2.1. Chemicals
β-Cyclodextrin (βCD), curcumin, bis(4-hydroxy-3-methoxyphenyl)-1,6-diene-3,5-dione (CRM) and p-toluenesulfonyl chloride (TsCl) were purchased from Sigma (St. Louis, MO, USA). 1-Ethanol-2-amine (ethanolamine) and N,N-diethylamine (diethyl amine) were purchased from TEDIA (Fairfield, OH, USA). 1,2-Dipalmitoyl-sn-glycero-3-phosphocholine (DPPC) and cholesterol (CHOL) were obtained from Avanti Polar Lipids, Inc. (Alabaster, Alabama, USA). Phosphate buffer saline (PBS) and [4-(2-hydroxyethyl)-piperazino]-ethanesulfonic acid (HEPES) were obtained from LONZA® (USA). Deuterated dimethylsulfoxide (d6-DMSO) (99.9% atom) was used for NMR analysis and was purchased from Aldrich (USA). Vinylec K was purchased from Aldrich, USA. Uranyl acetate reagent from Electron Microscopy Science (USA). Acetone, methanol, ethanol, acetonitrile, and 1-propanol were obtained from carbon group (England). All other chemicals and solvents were of analytical grade. All reagents and chemicals were used without further treatment.2.2. Synthesis of mono amino-modified βCDs
The amino-modified βCDs, mono-6-deoxy 1-ethanol-2-amine-βCD (E-βCD) and mono-6-deoxy-N,N-diethylamine-βCD (D-βCD) were synthesized as illustrated in Scheme 1. Firstly, mono(6-O-p-tolylsulfonyl)-βCD, 6-OTs-βCD was synthesized by tosylation of βCD with p-toluenesulfonyl chloride (TsCl) in basic aqueous solution according to literature procedure with minor modifications,24 where βCD (1.477 g, 1.3 mmol) and TsCl (0.429 g, 2.25 mmol) was dissolved in 35 mL of deionized water and stirred at room temperature for 3 h. Thereafter, sodium hydroxide, NaOH (0.60 g, 15 mmol) in 7 mL of deionized water was added and the mixture was stirred for 10 min. Unreacted TsCl was removed by filtration through a grade 4 sintered glass funnel. The filtrate was brought to pH ∼7.5 by the addition of NH4Cl (1.3 g), then refrigerated overnight at 4 °C. The resulting white precipitate was recovered by filtration, and dried for 24 h at 80 °C. A pure white solid was obtained (47.52% yield).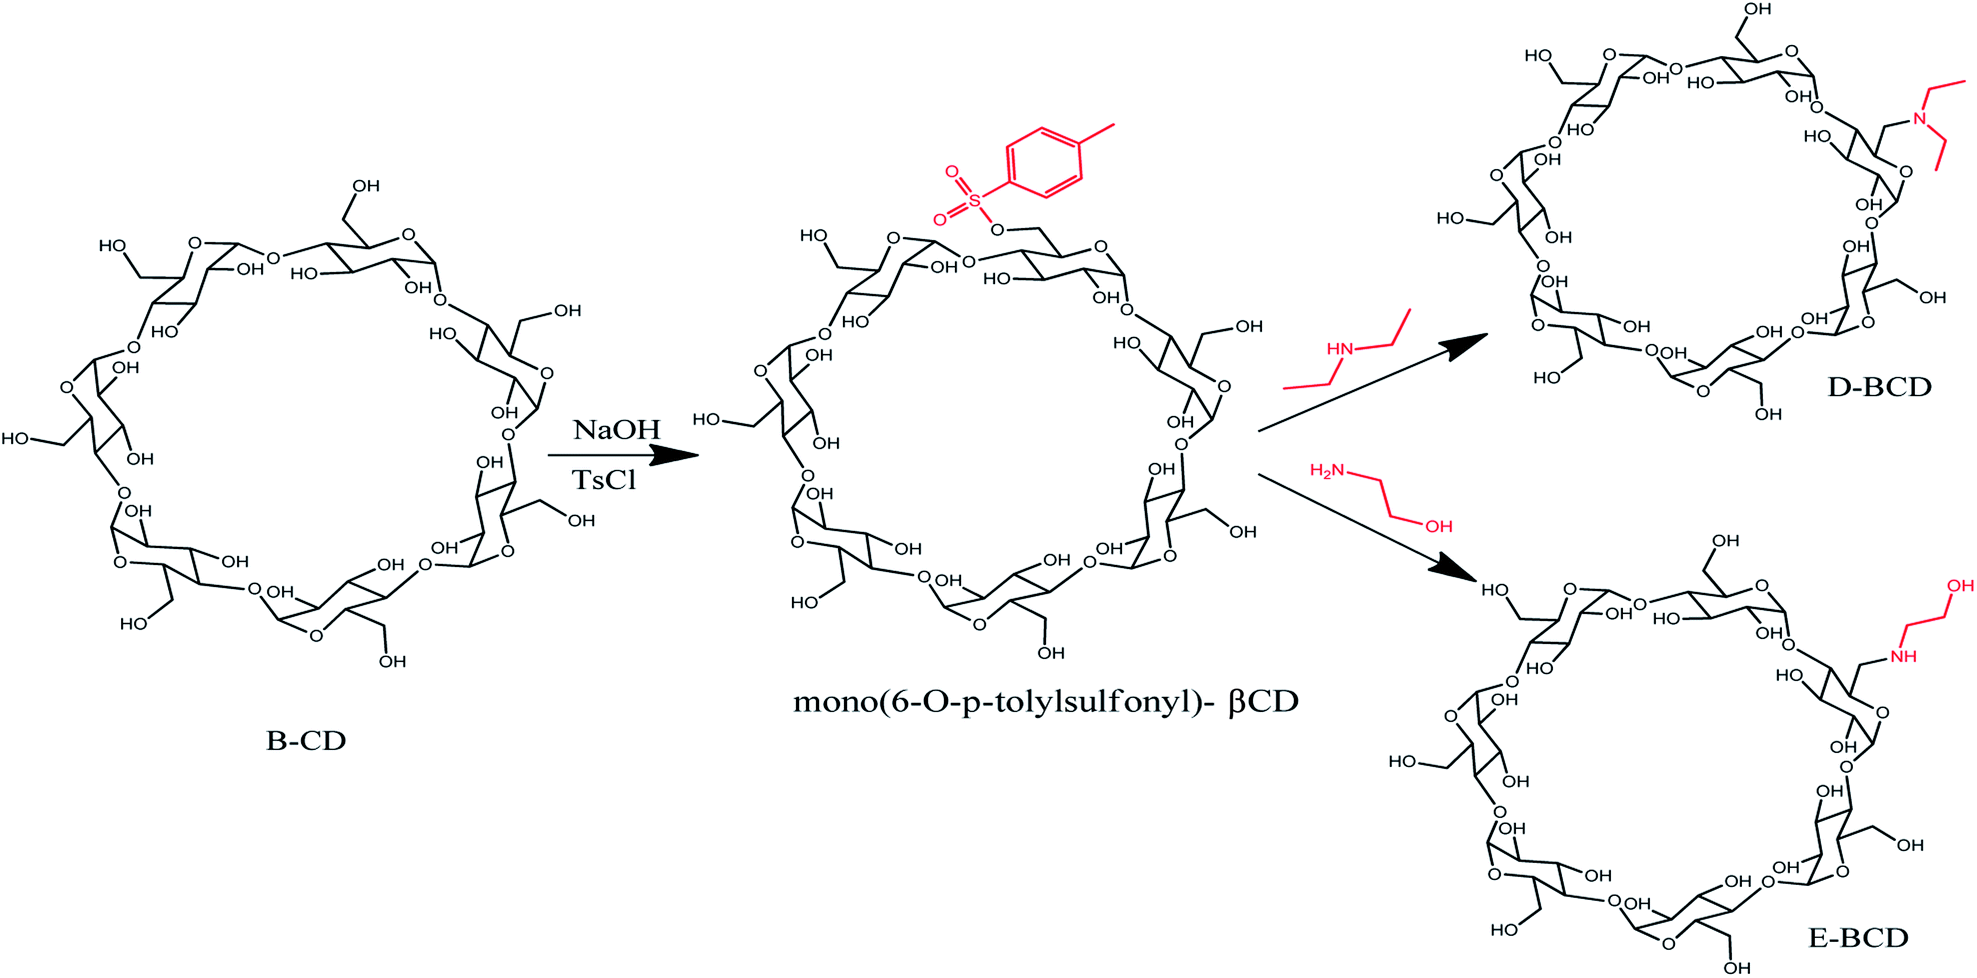 | ||
| Scheme 1 Schematic synthesis of the modified β-cyclodextrin (E-βCD and D-βCD). | ||
The amino-modified βCDs, E-βCD and D-βCD, were synthesized by nucleophilic substitution of 6-OTs-βCD with an excess of the corresponding aliphatic amines, 1-ethanol-2-amine (ethanolamine) and N,N-diethylamine (diethyl amine). A solution of 6-OTs-βCD (0.30 g, 0.235 mmol) in an excess ethanol amine (17.625 mmol, 1.064 mL) was stirred at 70 °C for 18.0 h, then cooled to room temperature. Distilled water (1 mL) was added to dilute the mixture, the resultant solution was poured into a mixture of acetone (10 mL) and ethanol (10 mL) slowly, forming white precipitate immediately. The white precipitate was collected by suction filtration and recrystallized three times in hot water (3 × 1 mL), 0.2217 g of E-βCD was produced (80.01% yield).25
17.625 mmol, 1.822 mL excess amount of diethyl amine was added to 0.30 g, 0.235 mmol of 6-OTs-βCD, the solution stirred at 40–50 °C for four days. The excess diethylamine was removed under vacuum. The product (D-βCD) was obtained by recrystallization from hot water (3 × 1 mL), yielding 0.2 g (71.55%) as a white crystal.
These products were characterized by proton nuclear magnetic resonance (1H-NMR) analysis using Bruker Avance III 500 mHz instrument (Bruker BioSpin, Switzerland) and by high-resolution mass spectroscopy with electrospray ionization method operating HRMS (ESI) using ESI-apex-IV Bruker Mass spectrometry.
2.3. Preparation of encapsulated complexes
The preparation of inclusion complexes of CRM with different βCDs was performed via solvent evaporation encapsulation technique.26 A 1:2 drug to cyclodextrin ratio (0.044 mmol, 16.8 mg) of CRM dissolved in methanol (nearly saturated ∼1 mL) and appropriate cyclodextrin (0.022 mmol, 25, 26.2 and 26.1 mg for βCD, E-βCD, and D-βCD, respectively) dissolved in deionized water (∼2 mL). The methanolic solution of the CRM was then added dropwise into the cyclodextrin solution in 5 mL round bottom flask. This solution was then mixed by shaking, without a cap to evaporate the methanol, at 300 rpm and 40 °C for 36 h. The complex solution was used after filtration, to remove the particulate matter, for spectrophotometric and active loading investigation or dried in the fume hood overnight and completely dried using vacuum oven at 35 °C for 2 h for further characterization.17,21
2.4. Spectrophotometric studies
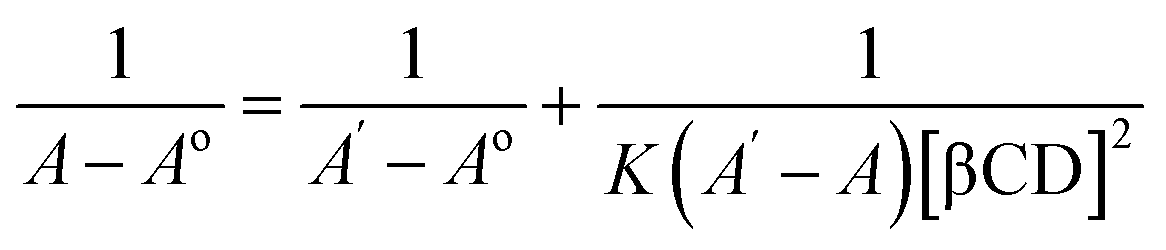
Spectroscopic studies were carried out to determine the absorption spectrum, stoichiometry, and formation constant of the inclusion complexes. Absorption spectra were recorded in the range of 300 to 500 nm using Nanodrop 2000 UV-Vis spectrophotometer (Wilmington, DE, USA).27:1 or 2:2 ratio complexes; X = 0.33 for 1:2 ratio complexes).31:1 complexation and eqn (2) for 1:2 complexation.32
 | (1) |
 | (2) |
 | (3) |
2.5. Differential scanning calorimetry (DSC) and thermo-gravimetric analysis (TGA)
The complexed nanoparticles were analyzed on Netzsch DSC 204 F1 instrument (Germany). The DSC patterns of the samples were obtained from 20 °C to 300 °C at a heating rate of 10 °C min−1, under a constant flow (100 mL min−1) of nitrogen gas. The samples weights were in the range of 3–6 mg.The TGA analysis was performed on Mettler Toledo Instrument (TGA/DSC 2, Switzerland) from 25 °C to 500 °C with a heating rate of 10 °C min−1. Alumina (aluminum oxide, ALU) crucibles, holding 1–2 mg of each sample, were used.
2.6. 1H-NMR spectroscopy
All NMR spectra were performed in d6-DMSO (99.0% atom, Across Organics, USA) using Bruker Avance III 500 mHz instrument (Bruker BioSpin, Switzerland) with a Broadband Observe (BBO) probe equipped with z-gradient and the temperature was controlled using a variable temperature unit (VTU) and held constant at 300 K. Chemical shift in parts per million (ppm) were referenced to tetramethylsilane (TMS) as an internal reference. Data processing and analysis of the data were performed with topspin framework (Bruker Biospin GmbH, Version 3.6.0).2.7. Mass spectrometry
High-resolution mass spectra (HRMS) were acquired (in positive or negative mode) using electrospray ion trap (ESI) technique by collision-induced dissociation on a Bruker APEX-4 (7 Tesla) instrument. The samples were infused using a syringe pump at a flow rate of 2 μL min−1.2.8. Liposomes preparation and active loading
:35 molar ratio) were dissolved in 3–4 mL chloroform, which was then evaporated under reduced pressure, down to 100 mbar (IKA RV 05 Basic Rotary Evaporator combined with VacuuBrand CVC2000, Germany) at 20 rpm and 35 °C water bath until a dried, homogeneous thin film was obtained. The film was then hydrated with 2 mL of 300 mM citrate buffer, pH 4.0 at ∼50 °C for 30–60 min with vigorous vortexing every 2–3 min.17 The vesicle suspension was extruded successively through a polycarbonate membrane (100 nm, Whatman®) using Mini-Extruder (Avanti Polar Lipids, Inc. USA) at 50 °C for 13 times to obtain the final liposomes with low polydispersity and the desired size, which were stored at 4 °C for further use. The transmembrane pH gradient was achieved by re-dispersing the liposomes pellets, after 15300 rpm centrifugation at 4 °C for 1.5 h, with an external 20 mM (pH = 10.5) HEPES buffer.300 rpm and 4 °C centrifugation for 15 min. The supernatant was measured on UV-Vis spectrophotometer at 420 nm for the loaded CRM: βCD complexes.17,36
 | (4) |
3. Results and discussion
3.1. Characterization of modified β-cyclodextrins
The formation of mono-6-deoxy-6-(p-tolylsulfonyl)-β-cyclodextrin (6-OTs-βCD) (Fig. S3†) was confirmed using 1H-NMR and mass spectrometry. HRMS (ESI) on the negative mode ([M − H]−) confirmed 6-OTs-βCD (C49H75O37S) synthesis, where the calculated and the found values are 1287.37134 and 1287.29928, respectively, in addition to the isotope peaks (Fig. S4†).Compared to 1H-NMR spectrum of βCD (Fig. S5†), new doublet peaks of the proton signal appeared around 7.45 and 7.77 ppm, which belongs to the C9-H and C8-H proton of the aromatic ring, respectively (Fig. S6†). A singlet peak arises at 2.45 ppm for the para-methyl group (C11-3H) of the aromatic ring.
1H NMR (d6-DMSO, δ, ppm) for 6-OTs-βCD: 2.45 (s, 3H, –CH3), 3.23–3.38 (m, 14H, H-2,4), 3.60–3.75 (m, 28H, H-3,5,6), 4.79 (d, 2H, H-1), 4.86 (t, 5H, H-1), 5.74 (m, 14H, OH-2,3), 7.45 (d, 2H, H-9), 7.77 (d, 2H, H-8).
The preparation of the two modified amino βCDs, mono-6-deoxy ethanolamine-βCD (E-βCD) and mono-6-deoxy diethylamine-βCD (D-βCD) were also confirmed using 1H-NMR and mass spectrometry (Fig. 1a and b). Positive mode HRMS (ESI) ([M − H]+) for E-βCD (C44H76NO35) gives a calculated and found values of 1178.41924 and 1178.42008, respectively. The calculated and found values for D-βCD (C46H80NO34) in the HRMS (ESI) positive mode ([M − H]+) were 1190.45563 and 1190.45450, respectively.
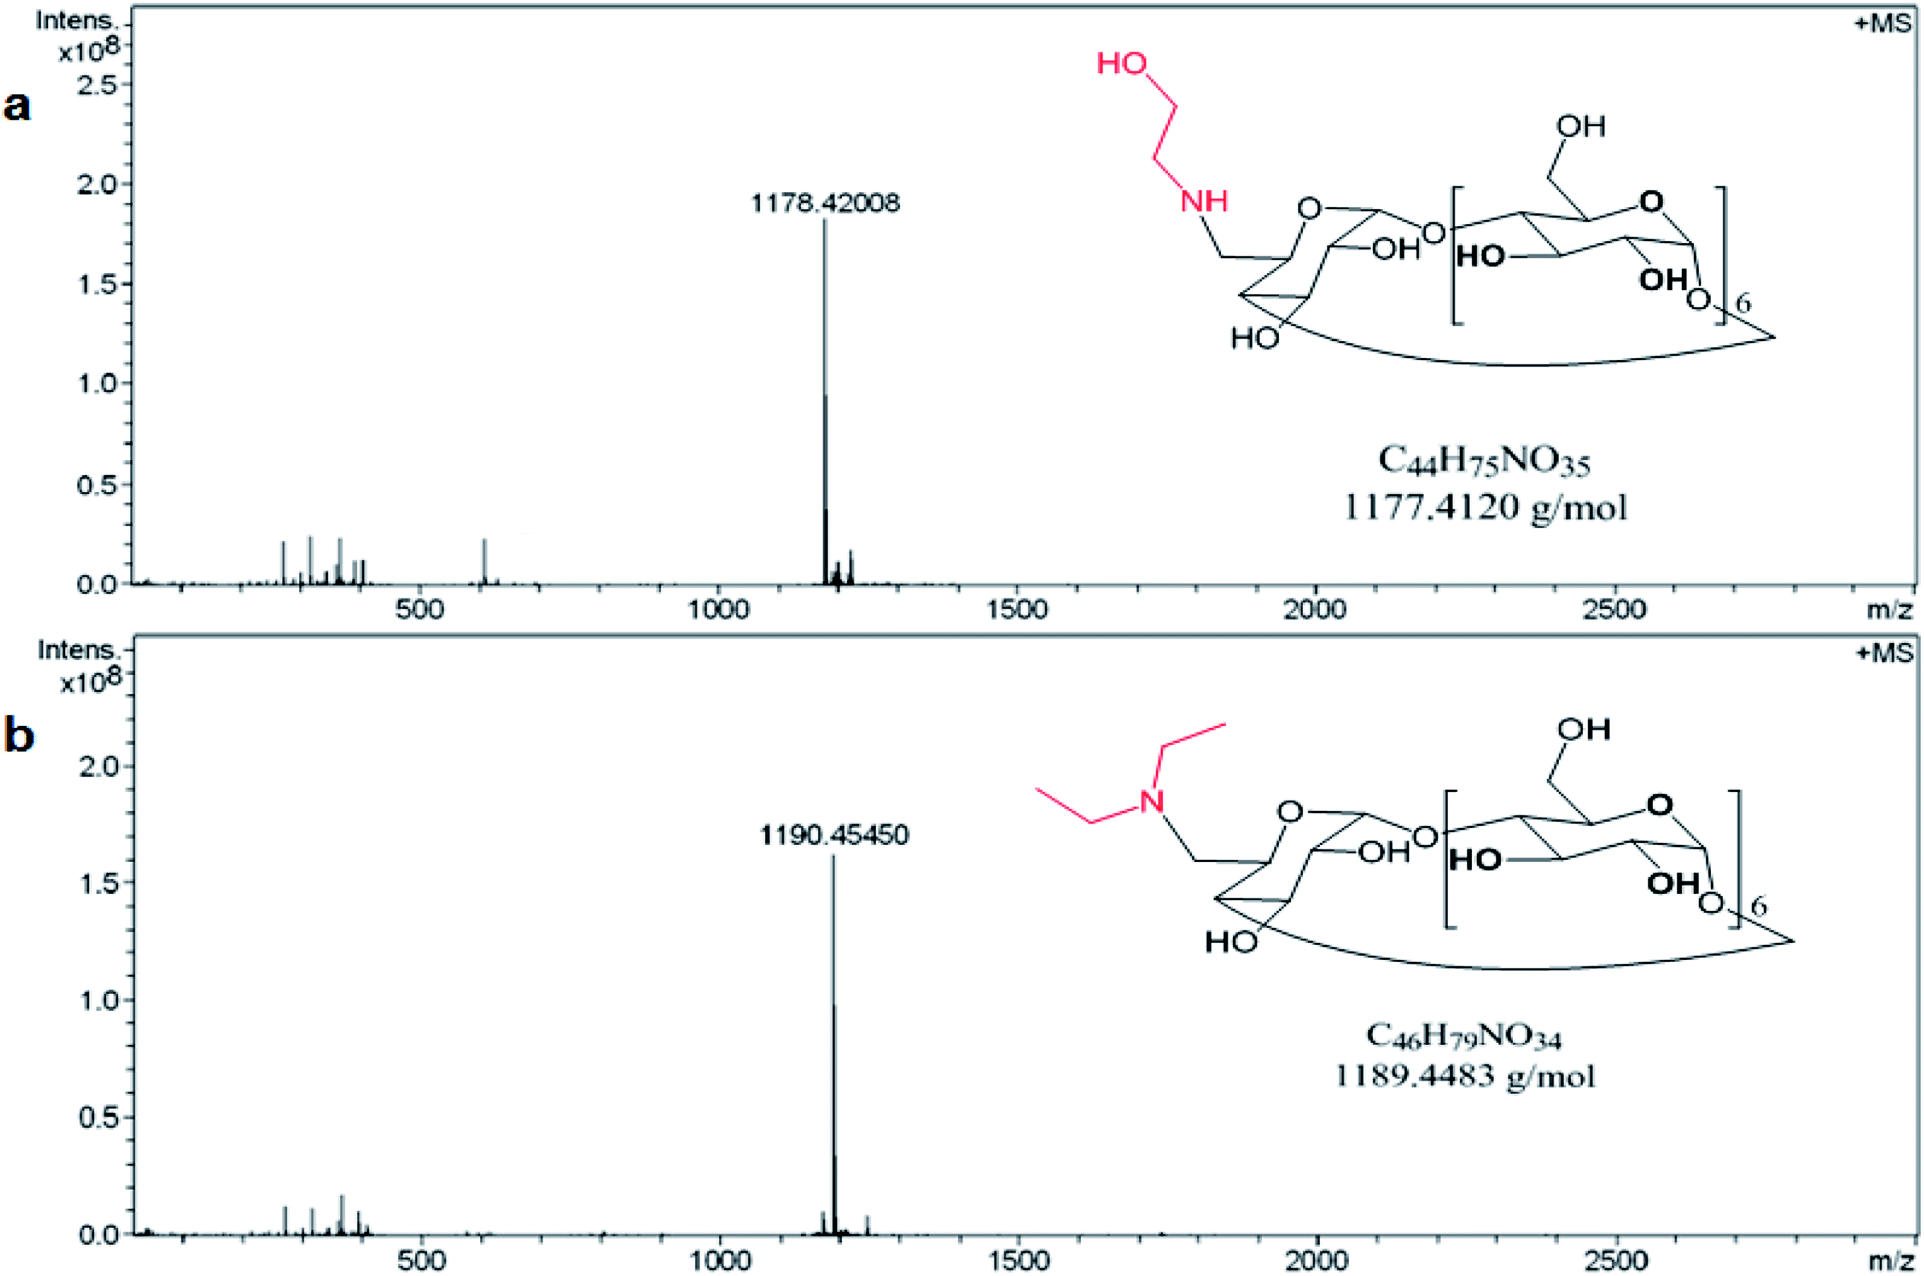 | ||
| Fig. 1 Mass spectrum of (a) E-βCD and (b) D-βCD one the positive mode. | ||
Fig. 2 shows a new peaks of the proton signal appeared around 2.75 and 2.85 ppm belongs to the C8′-H and C7′-H proton, and other peaks at 2.0 and 3.35 ppm for N–H and O9′-H proton, respectively, of the ethanolamine substitution in E-βCD compared to 1H-NMR spectrum of βCD (Fig. S5†).
 | ||
| Fig. 2 1H-NMR spectrum of E-βCD in the d6-DMSO solvent. | ||
1H NMR for E-βCD (d6-DMSO, δ, ppm): 2.01 (m, 1H, N–H), 3.35 (m, 1H, O′–H) 2.75 (d, 2H, H-8′), 2.85 (d, 2H, H-7′), 3.23–3.38 (m, 14H, H-2,4), 3.60–3.75 (m, 28H, H-3,5,6), 4.79 (d, 2H, H-1), 4.86 (t, 5H, H-1), 5.74 (m, 14H, OH-2,3).
New triplet peak of the proton signal appeared around 0.848 ppm belongs to the C8′′-H proton of the methyl substituted in D-βCD in addition to the quartet peak around 2.450 ppm for the C7′′-H (Fig. 3).
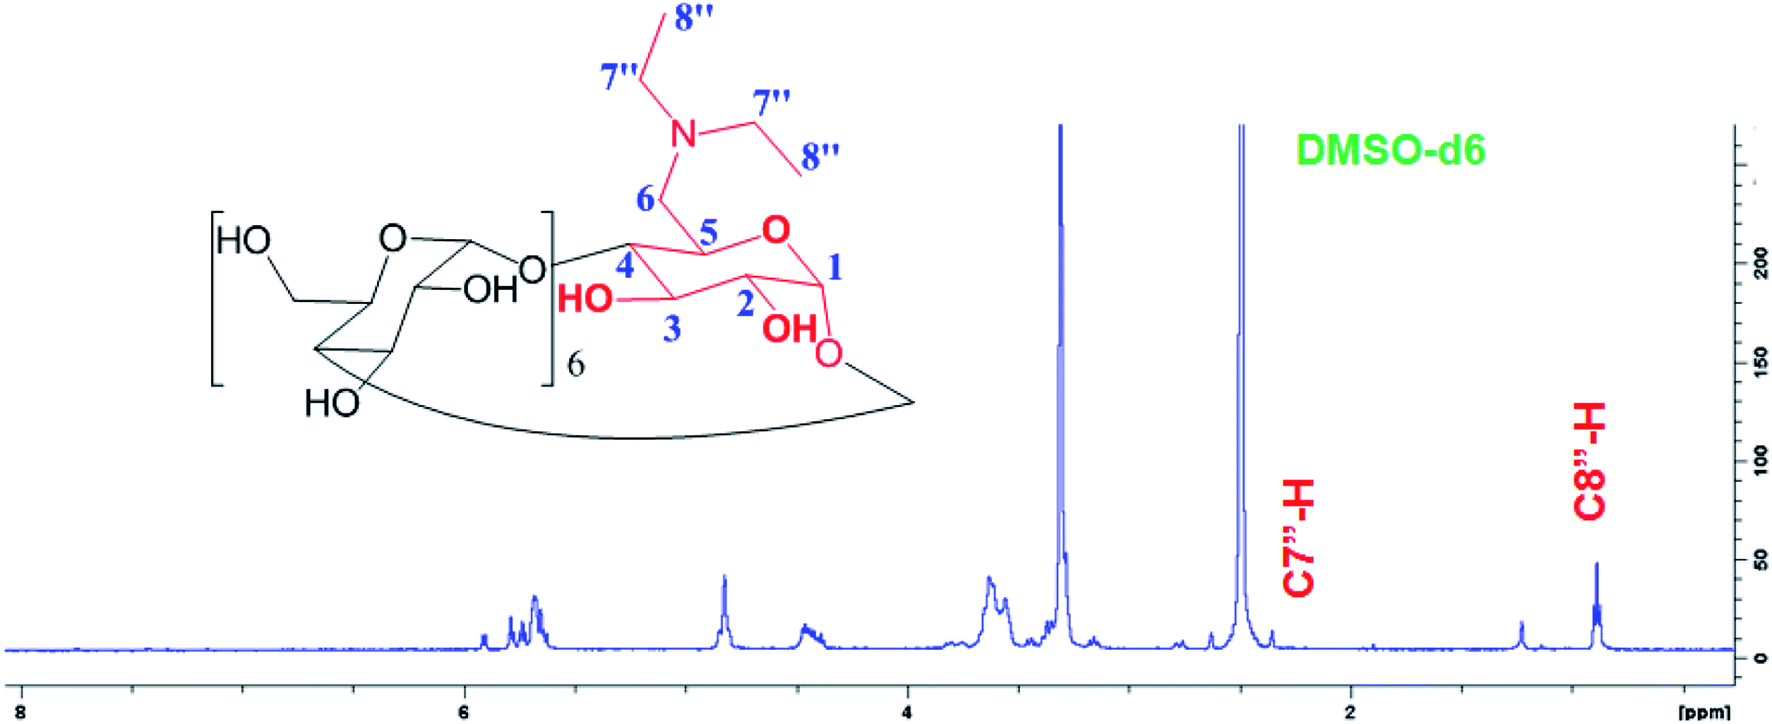 | ||
| Fig. 3 1H-NMR spectrum of D-βCD in the d6-DMSO solvent. | ||
1H NMR for D-βCD (d6-DMSO, δ, ppm): 0.848 (m, 3H, H-8′′), 2.45 (m, 2H, H-7′′), 3.23–3.38 (m, 14H, H-2,4), 3.60–3.75 (m, 28H, H-3,5,6), 4.79 (d, 2H, H-1), 4.86 (t, 5H, H-1), 5.74 (m, 14H, OH-2,3).
3.2 Absorption spectra
Spectroscopy is one of the methods usually used to confirm inclusion complex formation. βCD has no absorption in the range of 300–500 nm, while CRM has a maximum absorption at 420 nm (Fig. S7†), hence this wavelength was used for the study. The absorption spectra of CRM, βCDs and their corresponding complexes were studied in accordance with the procedure mentioned above.The effect of increasing the concentration of βCDs (0.00–0.63 mM) on the absorption spectrum of CRM was studied with a constant concentration of CRM (0.18 mM). As a result of the complexation, the chromophore, CRM, is transferred from the aqueous environment into the hydrophobic environment of the cyclodextrin's cavity. Hypsochromic or bathochromic shift, as well as increased absorption, are the commonly reported effects of the complex formation.38
Fig. S8† shows a remarkable increase in CRM absorbance upon continuous addition of βCD. This is maybe attributed to the transference of the two aromatic rings (chromophores) in CRM from the aqueous medium to the non-polar cavity of the βCD. In addition, shielding of the excited species from non-radiative processes occurring in the bulk solution and may be due to the increase in the molar absorption coefficient of the inclusion complexes.39 The same results were obtained for CRM absorption spectrum in the complexes formed with E-βCD and D-βCD as shown in Fig. S8b and c.†
3.3. Determination of the complexation stoichiometry and formation constants
Continuous variation method (Job's method) was employed to determine the complexation stoichiometry. Job's plots are shown in Fig. 4, where the CRM mole fraction (χ) was varied from 0.0 to 1.0 and plotted against χ multiplied with absorbance difference. As shown in Job's plot the maximum peak was obtained at χ = 0.5, which points to a 1:1 inclusion complex between CRM with native and modified βCDs.
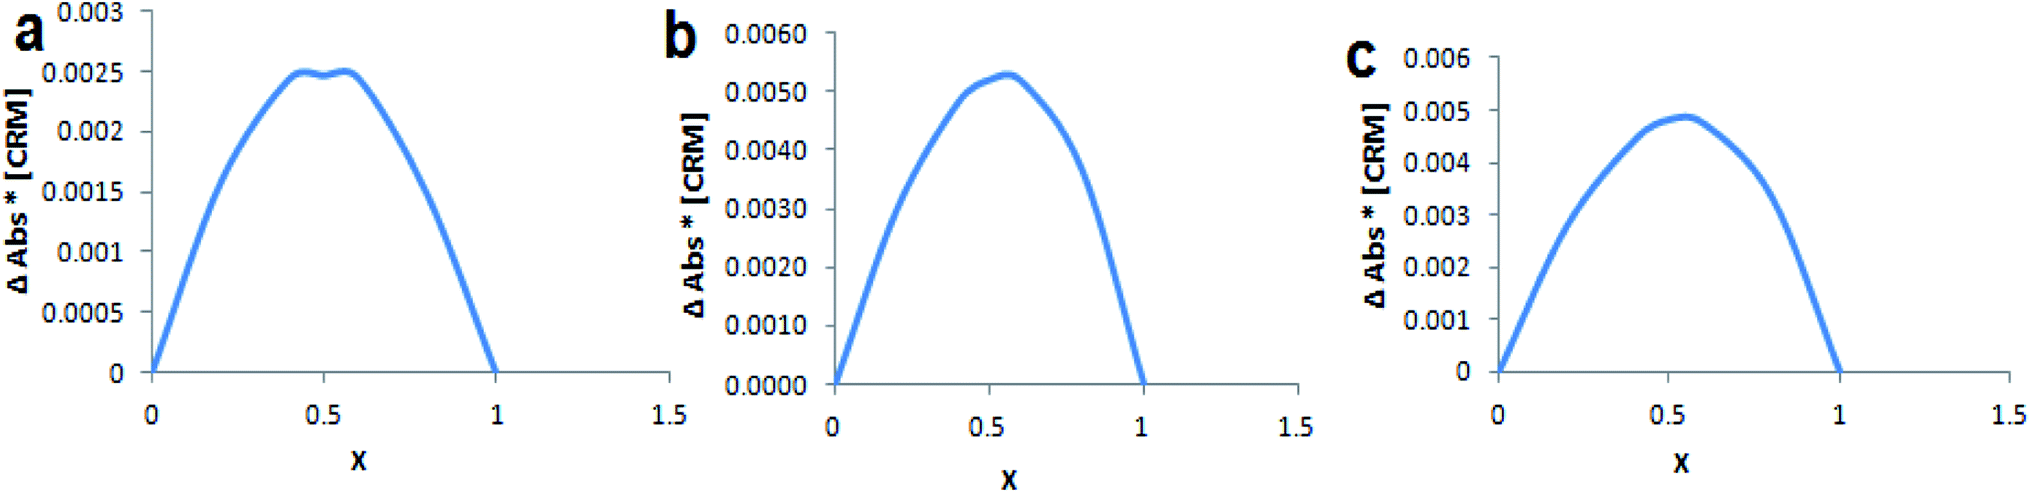 | ||
| Fig. 4 Job's plot for (a) CRM-βCD, (b) CRM-D-βCD and (c) CRM-E-βCD, where x is the mole fraction of CRM. | ||
The stoichiometry of the complexes was also determined using the Benesi–Hildebrand equations (Eqn (1) and (2)). A linear dependence of the type 1/(A − Ao) vs. 1/[CD]n, with n = 1 or 2, indicates the presence of complexes of 1:1 or 1:2 stoichiometry, respectively.32 Fig. 5a and b represent the Benesi–Hildebrand plot of 1/ΔA versus 1/[βCD] and 1/[βCD]2 for native and modified CRM-βCD. A good linear correlation was obtained for plotting 1/ΔA versus 1/[βCD], which indicates a 1:1 stoichiometry with a formation constant (Kf) equal to 1.3, 5.2 and 1.4 mM−1 for CRM-βCD, CRM-E-βCD and CRM-D-βCD complexes, respectively. Another good linear correlation with a possibility of 1:2 stoichiometry appears from plotting of 1/ΔA versus 1/[1/βCD]2 with a Kf of 51.6, 100.9 and 55.4 mM−2 for CRM-βCD, CRM-E-βCD, and CRM-D-βCD complexes, respectively. These result are consistent with Jahed et al. and Patro et al. conclusions of 1:1 or 1:2 stoichiometry based on phase solubility diagram, NMR results and molecular modelling calculations.40,41 In addition, 1:2 ratio of CRM with hydroxyl propyl derivatives of βCD (HP-βCD) also strongly reported based on NMR studies.42 Moreover, CRM forms strong 2:1 host:guest inclusion complexes with βCD and HP-βCD, according to Baglole et al., without eliminating the occurrence of 1:1 stoichiometry as confirmed by the fluorescence enhancement titration study of CRM upon complexation with increasing ratios of CDs.43 Thus the formation of inclusion complexes with 1:2 (guest:host) stoichiometry is possible as well as the 1:1 complexes. The presence of the two stoichiometric possibilities may be due to solvent effects (buffer type) and CRM quality, but either ratios will not affect the spectrophotometric investigations of the inclusion complex.44 Therefore, the 1:2 stoichiometry is more acceptable regarding higher formation constant and due to the large structure of CRM with two identical terminal aromatic rings that can be entrapped in two βCD molecules. The stoichiometric data show clearly that the modification on βCD did not affect it's guest–host interaction modes with CRM, and hence can be used in remote loading into liposomes.
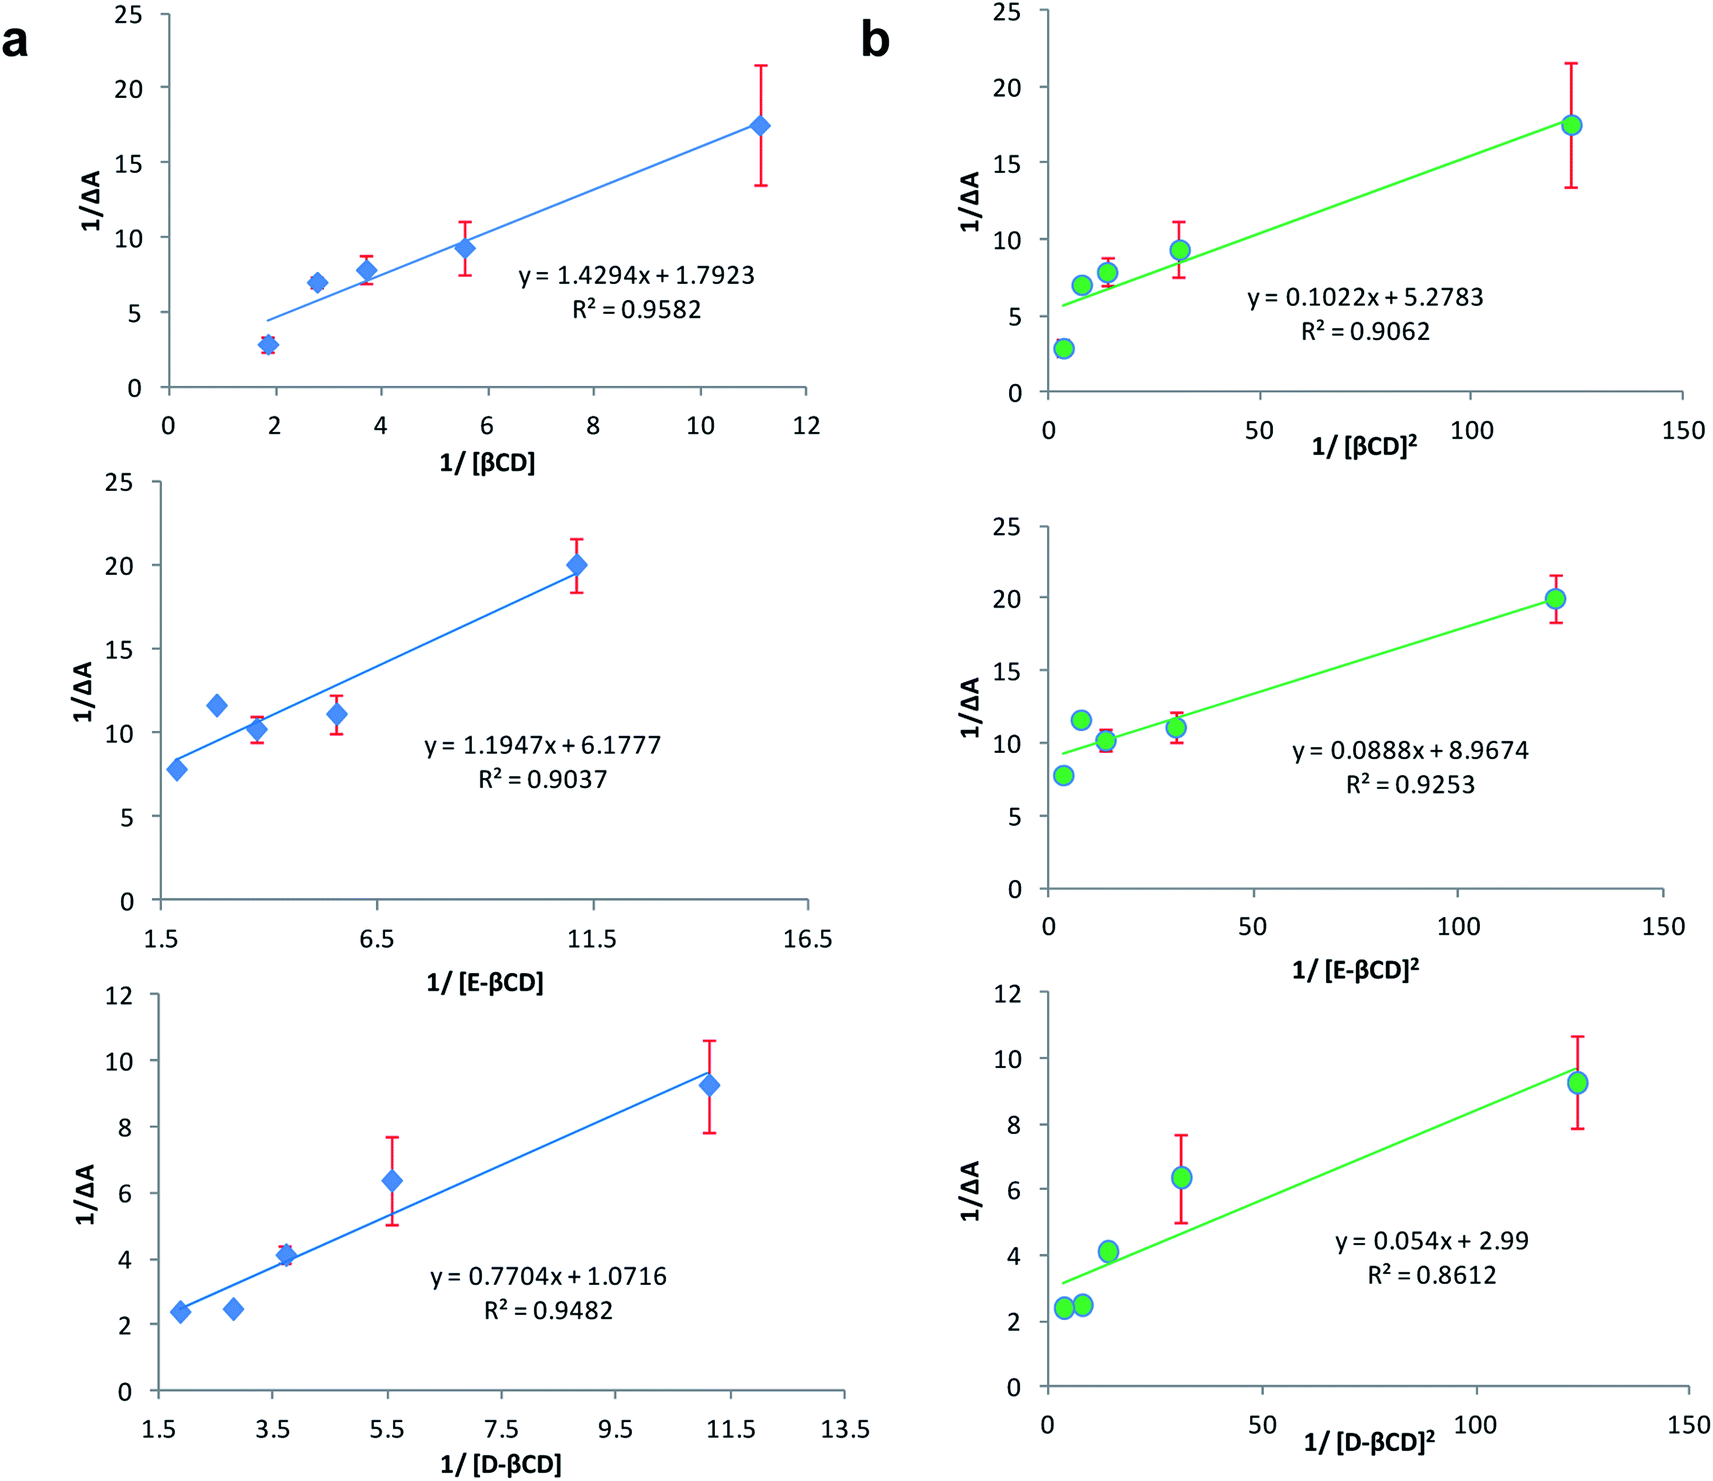 | ||
| Fig. 5 Benesi–Hildebrand plot of (a) 1/ΔA versus 1/[1/βCD] and (b) 1/ΔA versus 1/[1/βCD]2 for CRM – βCD different complexes. | ||
3.4. Differential scanning calorimetry (DSC) and thermo-gravimetric analysis (TGA)
DSC method was used to determine the phase changes in the βCDs melting temperature due to the inclusion of CRM. Table S1† represents a summary of DSC endothermic peaks of CRM with various βCD complexes. CRM, βCD, E-βCD and D-βCD have shown individual exothermic peaks at 177.3, 131.7, 96.6 and 96.0 °C, respectively, due to their melting points. DSC curves of CRM, βCDs, their physical mixture, and the inclusion complex were shown in Fig. 6. The thermal profile of the physical mixture was actually a combination of characteristics of CRM and different βCDs without noticeable alteration in the βCDs endothermic peaks and CRM showed a sharp endothermic peak around 177.3. In contrast, the thermograms of CRM-βCDs inclusion complexes did not show any peak of CRM in the 177.3 region and mainly showed features of βCDs with a decreasing in the melting points of CRM-βCD, CRM-E-βCD and CRM-D-βCD to 122.0, 93.6 and 86.7, respectively. These data should confirm the formation of the inclusion complex and CRM molecules being included in the βCDs cavities by replacing water molecules, and this behavior is an indication of stronger interactions between CRM and βCDs in the solid-state.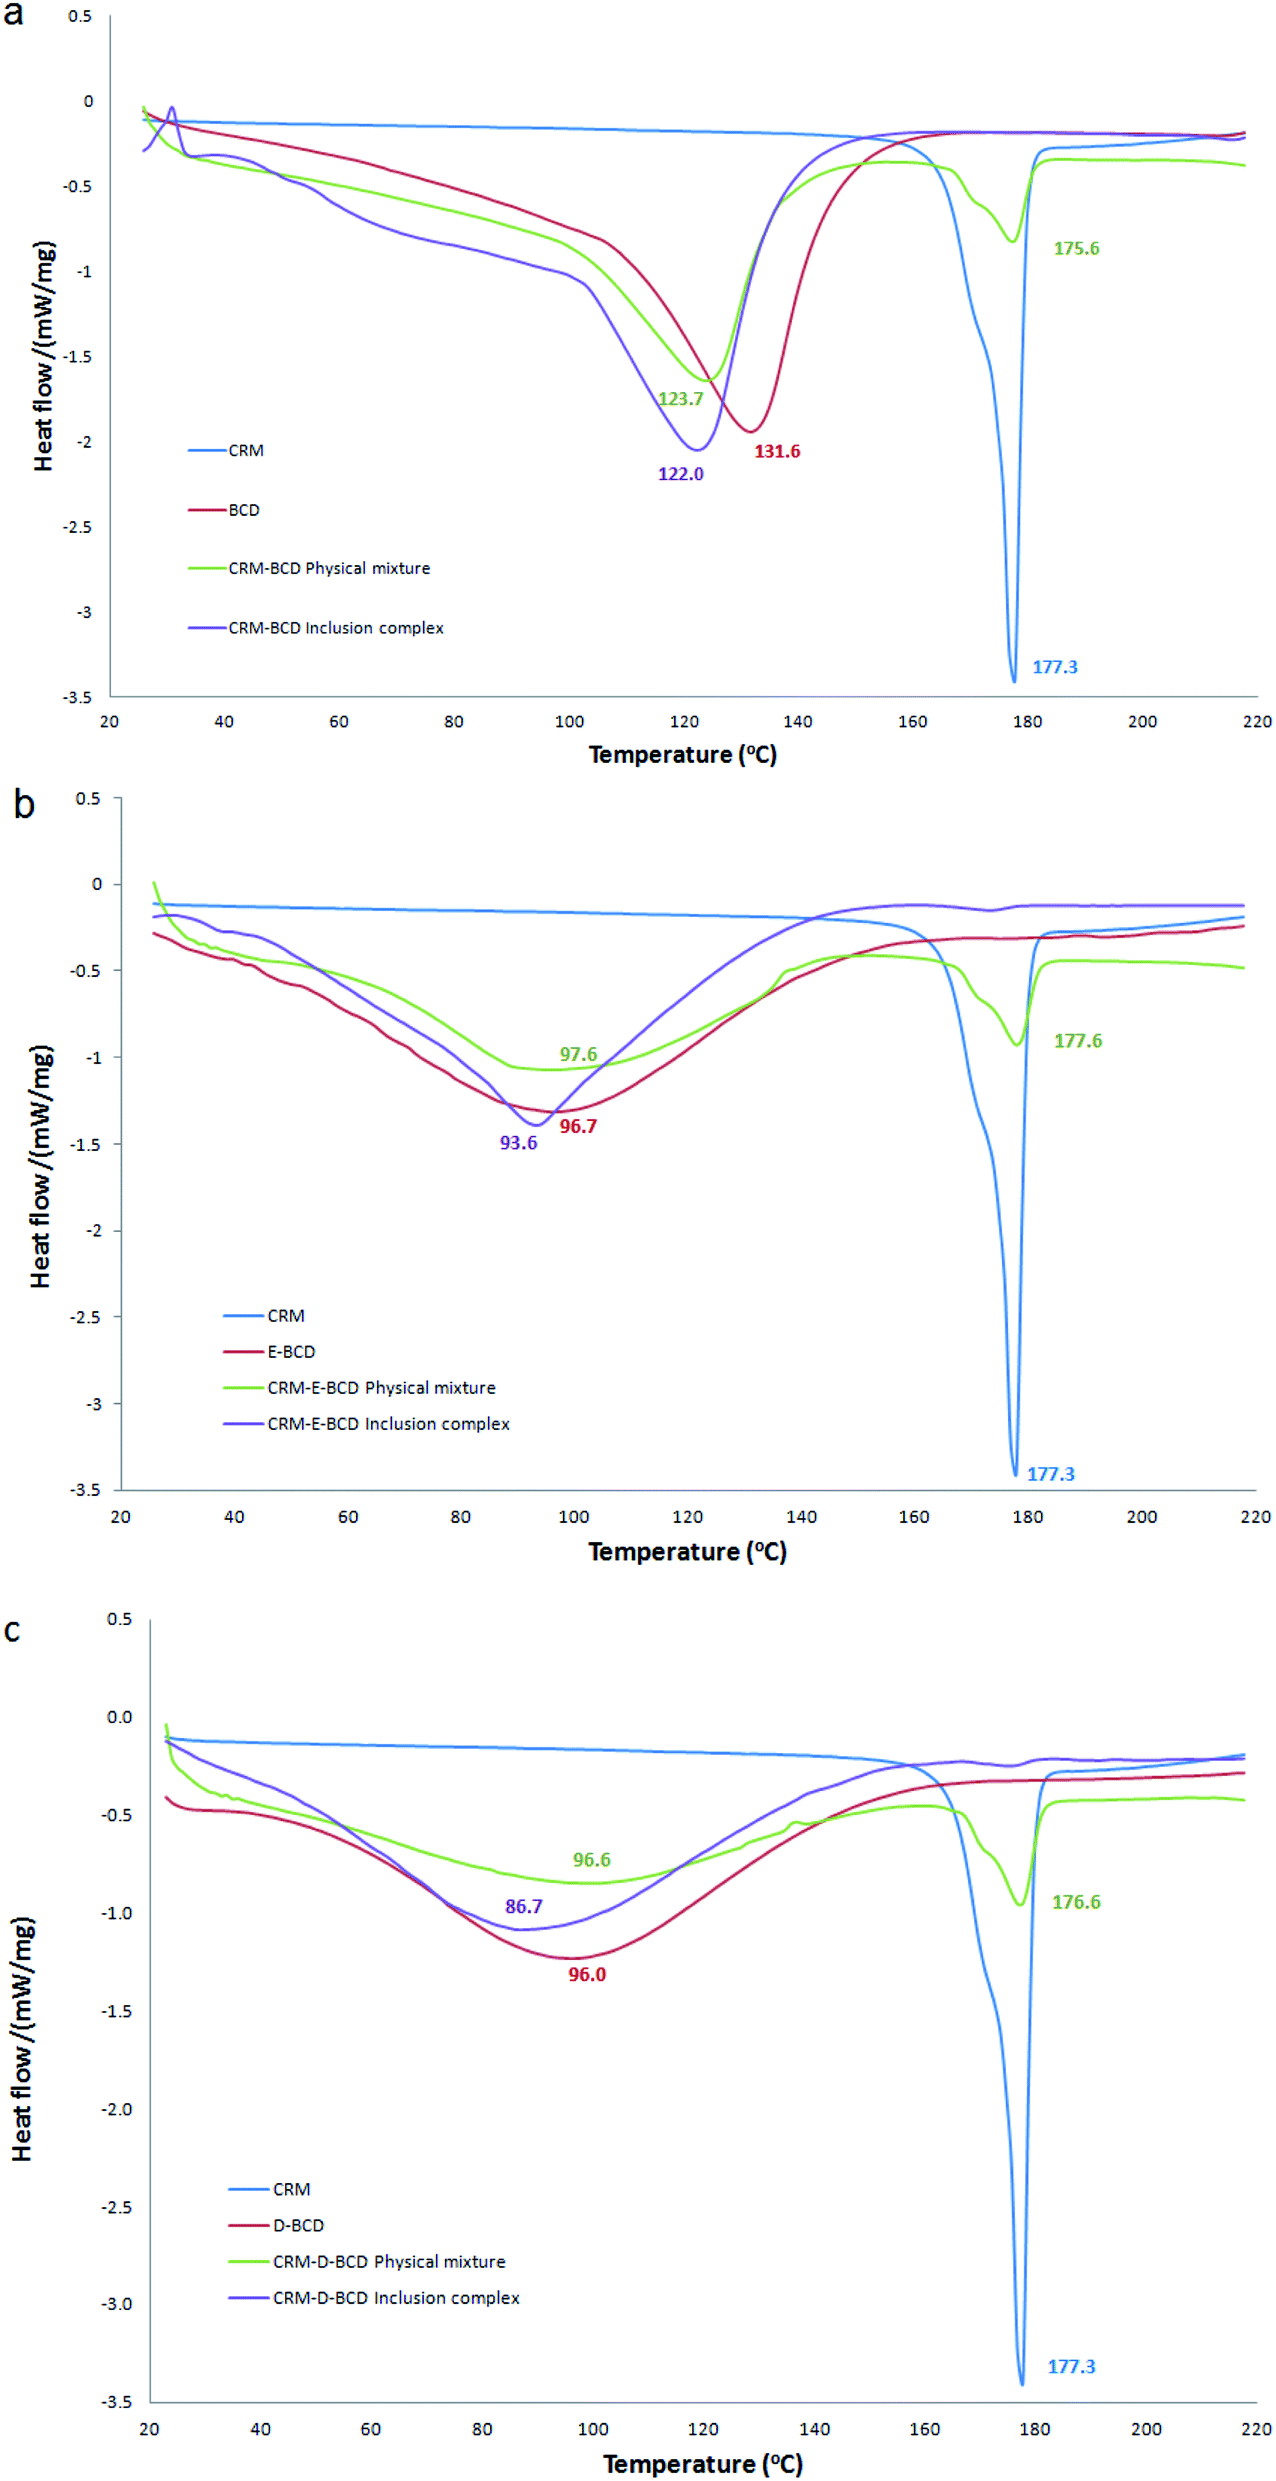 | ||
| Fig. 6 DSC thermograms for (a) CRM-βCD, (b) CRM-E-βCD, and (c) CRM-D-βCD compared to their precursors and physical mixtures. | ||
The thermal stability of CRM-βCD, CRM-E-βCD and CRM-D-βCD complexes were studied using TGA.45 Fig. S9† shows the thermograms of the weight loss curves for CRM-βCD, CRM-D-βCD, CRM-E-βCD and their precursors in the temperature range of 25–600 °C. βCD, D-βCD, and E-βCD start to decompose at 289, 261 and 224 °C, respectively. The chemical modification on βCD decrease the decomposition temperature of βCD. The thermal change occurred between 40 to 75 °C in different βCDs due to the endothermic behavior which corresponded to the loss of water molecules in βCDs cavities. CRM exhibited a major weight loss at 230.3 °C. CRM inclusion complexes underwent weight loss in two major stages. The first stage is due to the dehydration of water molecules between 40 to 60 °C, while the second stage is due to decomposition of the complexes. Moreover, TGA thermograms (Fig. S9†) show a 63.5% weight loss and slight degradation of CRM at 600 °C and almost complete degradation with 91.02% weight loss for native βCD compared to the higher stability of modified βCD, E-βCD and D-βCD with 73.81 and 78.03% weight loss respectively, at 600 °C. In addition, the inclusion complexes enhance the thermal stability of CRM and decrease the weight loss of βCD, E-βCD and D-βCD to 78.34, 61.41 and 63.77%, respectively, which is probably due to the formation of CRM inclusion complexation with various βCDs.
3.5. 1H-NMR spectroscopy
The complexation pattern was further evaluated by 1H-NMR spectroscopy. This technique provides direct evidence of inclusion complex formation. Chemical shift (δ) changes, either for the host or the guest, can verify due to the formation of inclusion complex in solution.11,46 Fig. 7 represents the chemical structure of βCD and CRM with all hydrogen atoms that may be involved in complex formation. An overview of the complexation induced 1H-NMR chemical shifts of hydrogen atoms of free native, modified βCDs and CRM in d6-DMSO compared to their respective complexes are presented in Tables S2–S4† and their corresponding detailed 1H-NMR spectrum are shown in Fig. S10–S12,† respectively. CRM has two terminal aromatic rings that, theoretically, supposed to involve in the complex formation with the hydrophobic cavity of βCDs. The major shifts of Hd and Hg prove this hypothesis. In addition, CRM specific peaks between 6 and 7.5 ppm show low intensity and secondary hydroxyl proton, Hf, almost invisible which is a typical pattern of inclusion complexes.21 Another noticeable chemical shift for CRM was for Hc which suggests the inclusion may go beyond the aromatic rings of CRM toward nearby atoms. The variation in the values of chemical shifts differences, and whether the shift occurs in the high or low field region, indicates the different types of βCD host.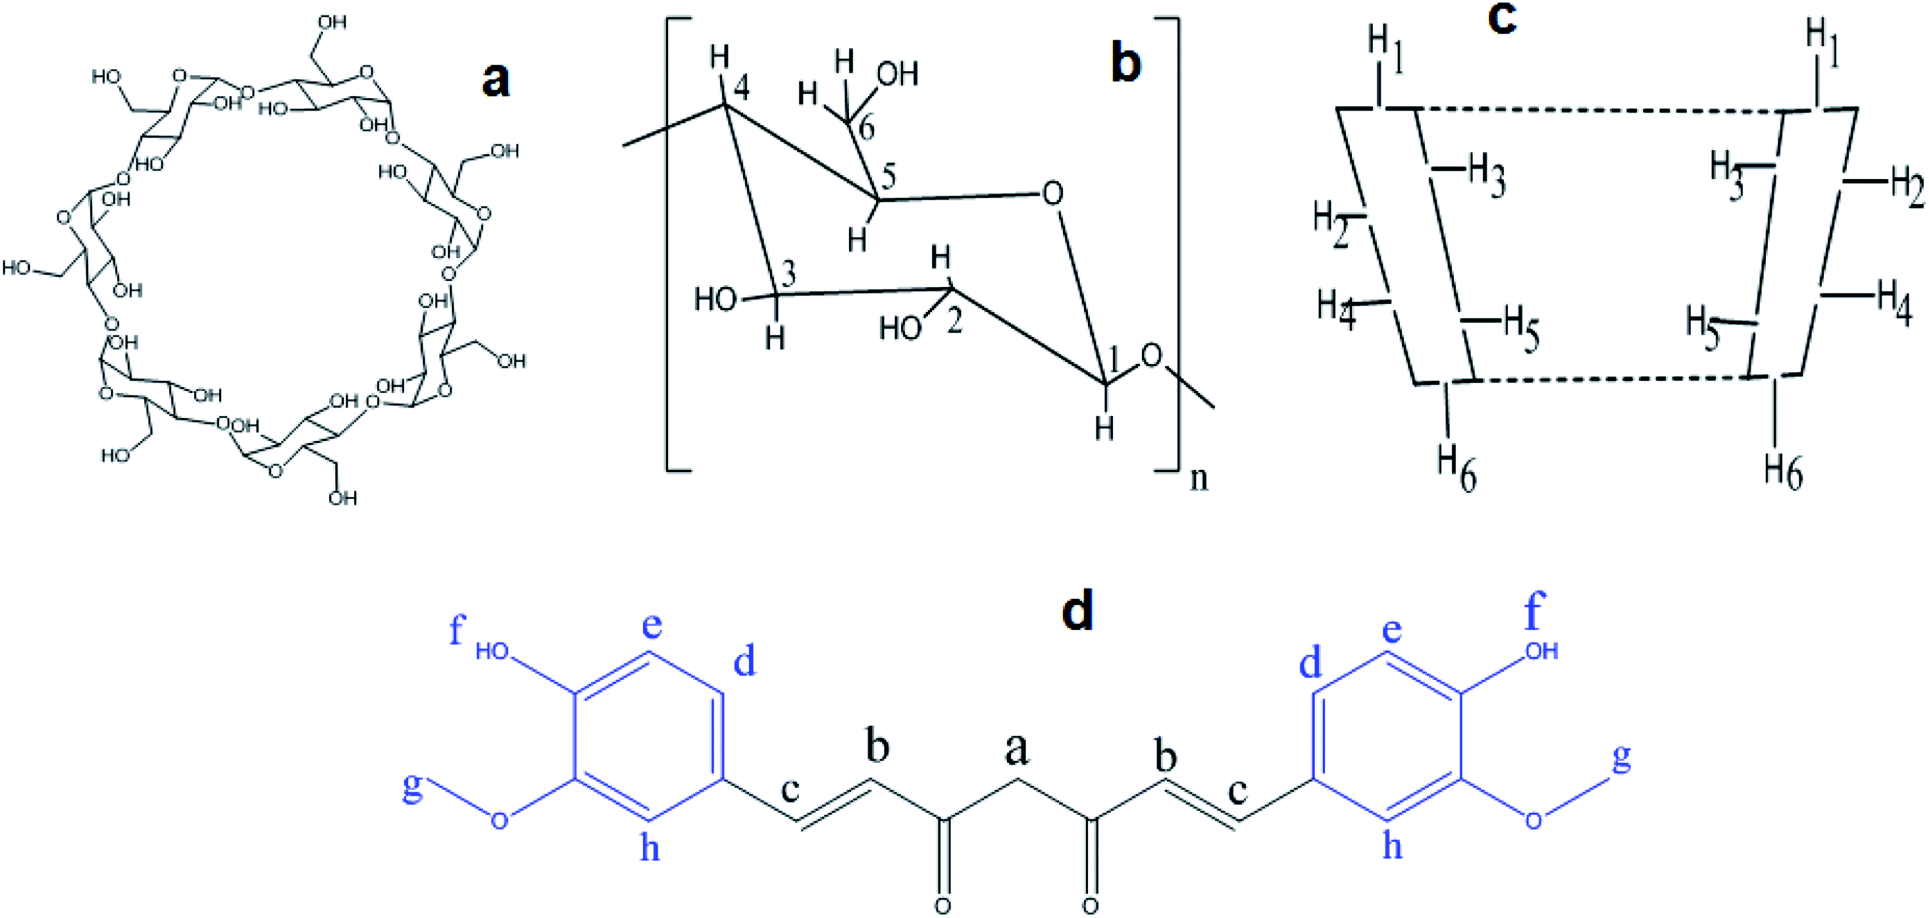 | ||
| Fig. 7 The conformational structure βCD, (a and b). The major hydrogen atoms of βCD, (c). The chemical structure of curcumin, (d). | ||
Obvious chemical shifts for native and modified βCDs occurred at H3 and H5, as expected since these atoms are located inside the cavity of the βCD, which confirms the formation of an inclusion complex.40 A noticeable chemical shift in H2 and H4, especially in the modified cyclodextrin, indicate the effect of these modified fragments (ethanol amine or diethyl amine) that located outside the cavity of βCD on the 6-position (easily rotate towered H2 and H4) on the chemical shifts of outside βCD protons. The large size of CRM may partially contact the outside protons of the nearby βCD and alter their chemical shifts. Cross-peaks observed in some cases also with the outside cyclodextrin proton H4 were ascribed to intramolecular scalar spin saturation transfers from the cyclodextrin protons H3 and/or H5.47 These observations may give evidence of the formation of partial or complete inclusion since H5 showed higher shifts than H3 for all complexes. All these data indicate the successful formation of inclusion complexes between CRM with native or modified βCD.
3.6. Liposome characterization and active loading
Following the chemical modifications of βCDs and the complexation with CRM, we have investigated the encapsulation of CRM into liposomes by active loading via trans-membrane pH gradient. The liposomes were prepared by hydrating lipid films with 300 mM citrate buffer (pH 4), or with PBS (pH 7.4) for comparison. To achieve a pH gradient liposomes, the citrate liposomes were centrifuged and the liposomes pellets were then dispersed in 20 mM HEPES buffer (pH 10.5), then the CRM-βCD complexes were incubated with the preformed liposomes at 65 °C for 1 h for entrapment.17 The unloaded CRM complexes were removed by centrifugation followed by liposomes disruption to measure the encapsulation efficiency using UV spectroscopy (Fig. 8). Two types of control experiments were performed, the modified βCD complexes with PBS buffer liposome and native βCD with citrate pH gradient liposome.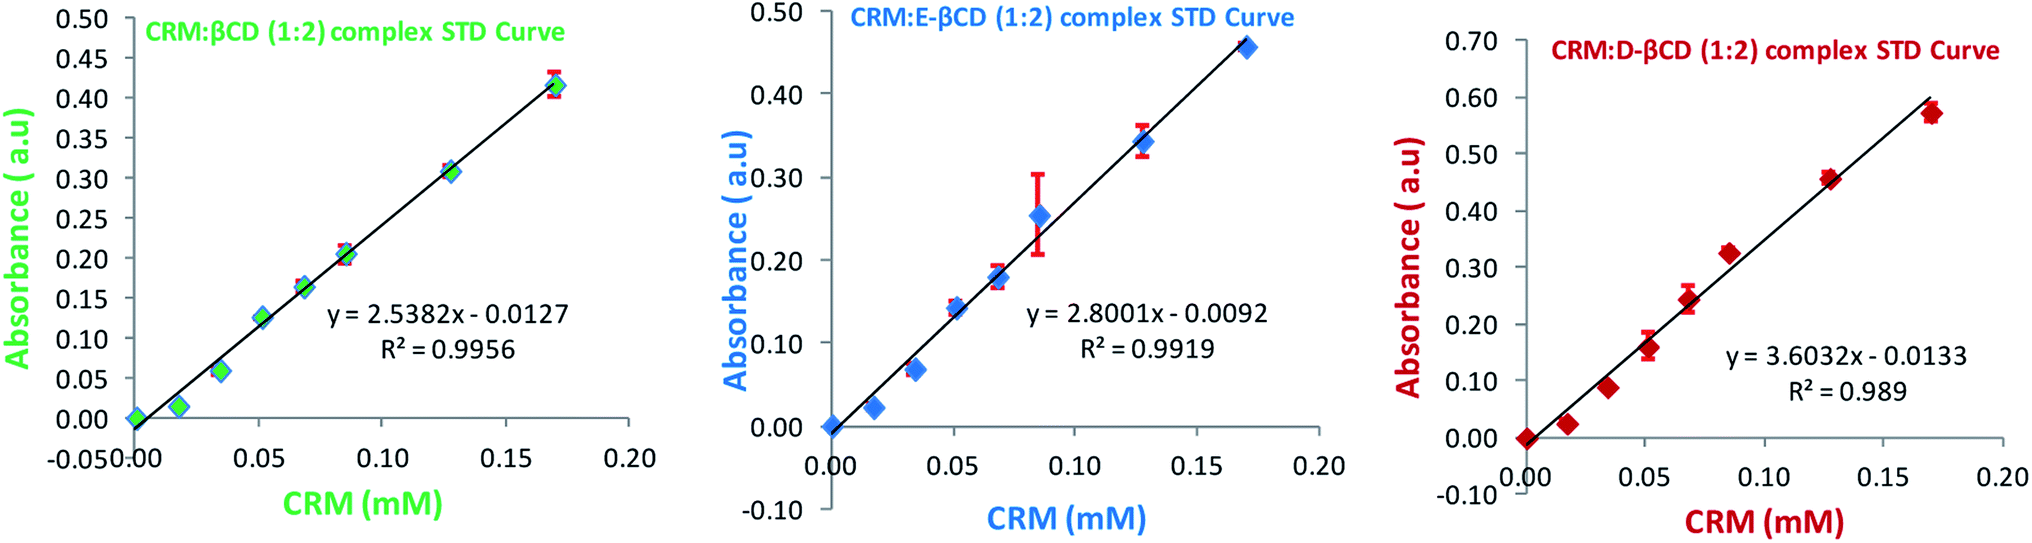 | ||
| Fig. 8 Standard curves (STD) of different CRM-βCD complexes. | ||
In the absence of a pH gradient, there was little entrapment into the liposomes using native βCD complex as shown in Fig. 9. Dynamic light scattering experiments showed that free liposomes diameter was in the ranging 139.39–151.33 nm with a narrow PDI (<0.10). Complex loading just slightly increased the diameter up to 163 nm, without affecting the PDI (Fig. 10). Table 1 represents liposome characteristics before and after active loading with different liposomes and CRM complexes. The zeta potential also varied among different formulations. The decreasing in zeta potential was due to the effect of external buffer and the capacity of modified amino βCD to alter phospholipids ionization.
 | ||
| Fig. 9 Active loading of modified β-cyclodextrin using a transmembrane pH gradient. (a and b) represent the absorbance of CRM-E-βCD and CRM-D-βCD complexes, respectively, in absorption unit loaded into liposomes with a pH gradient (citrate liposomes) compared with that of the same complex loaded into liposomes in the absence of a pH gradient (PBS liposomes). (b) Absorbance of CRM-βCD, CRM-E-βCD and CRM-D-βCD complex in absorption unit loaded into liposomes with a pH gradient (citrate liposomes). | ||
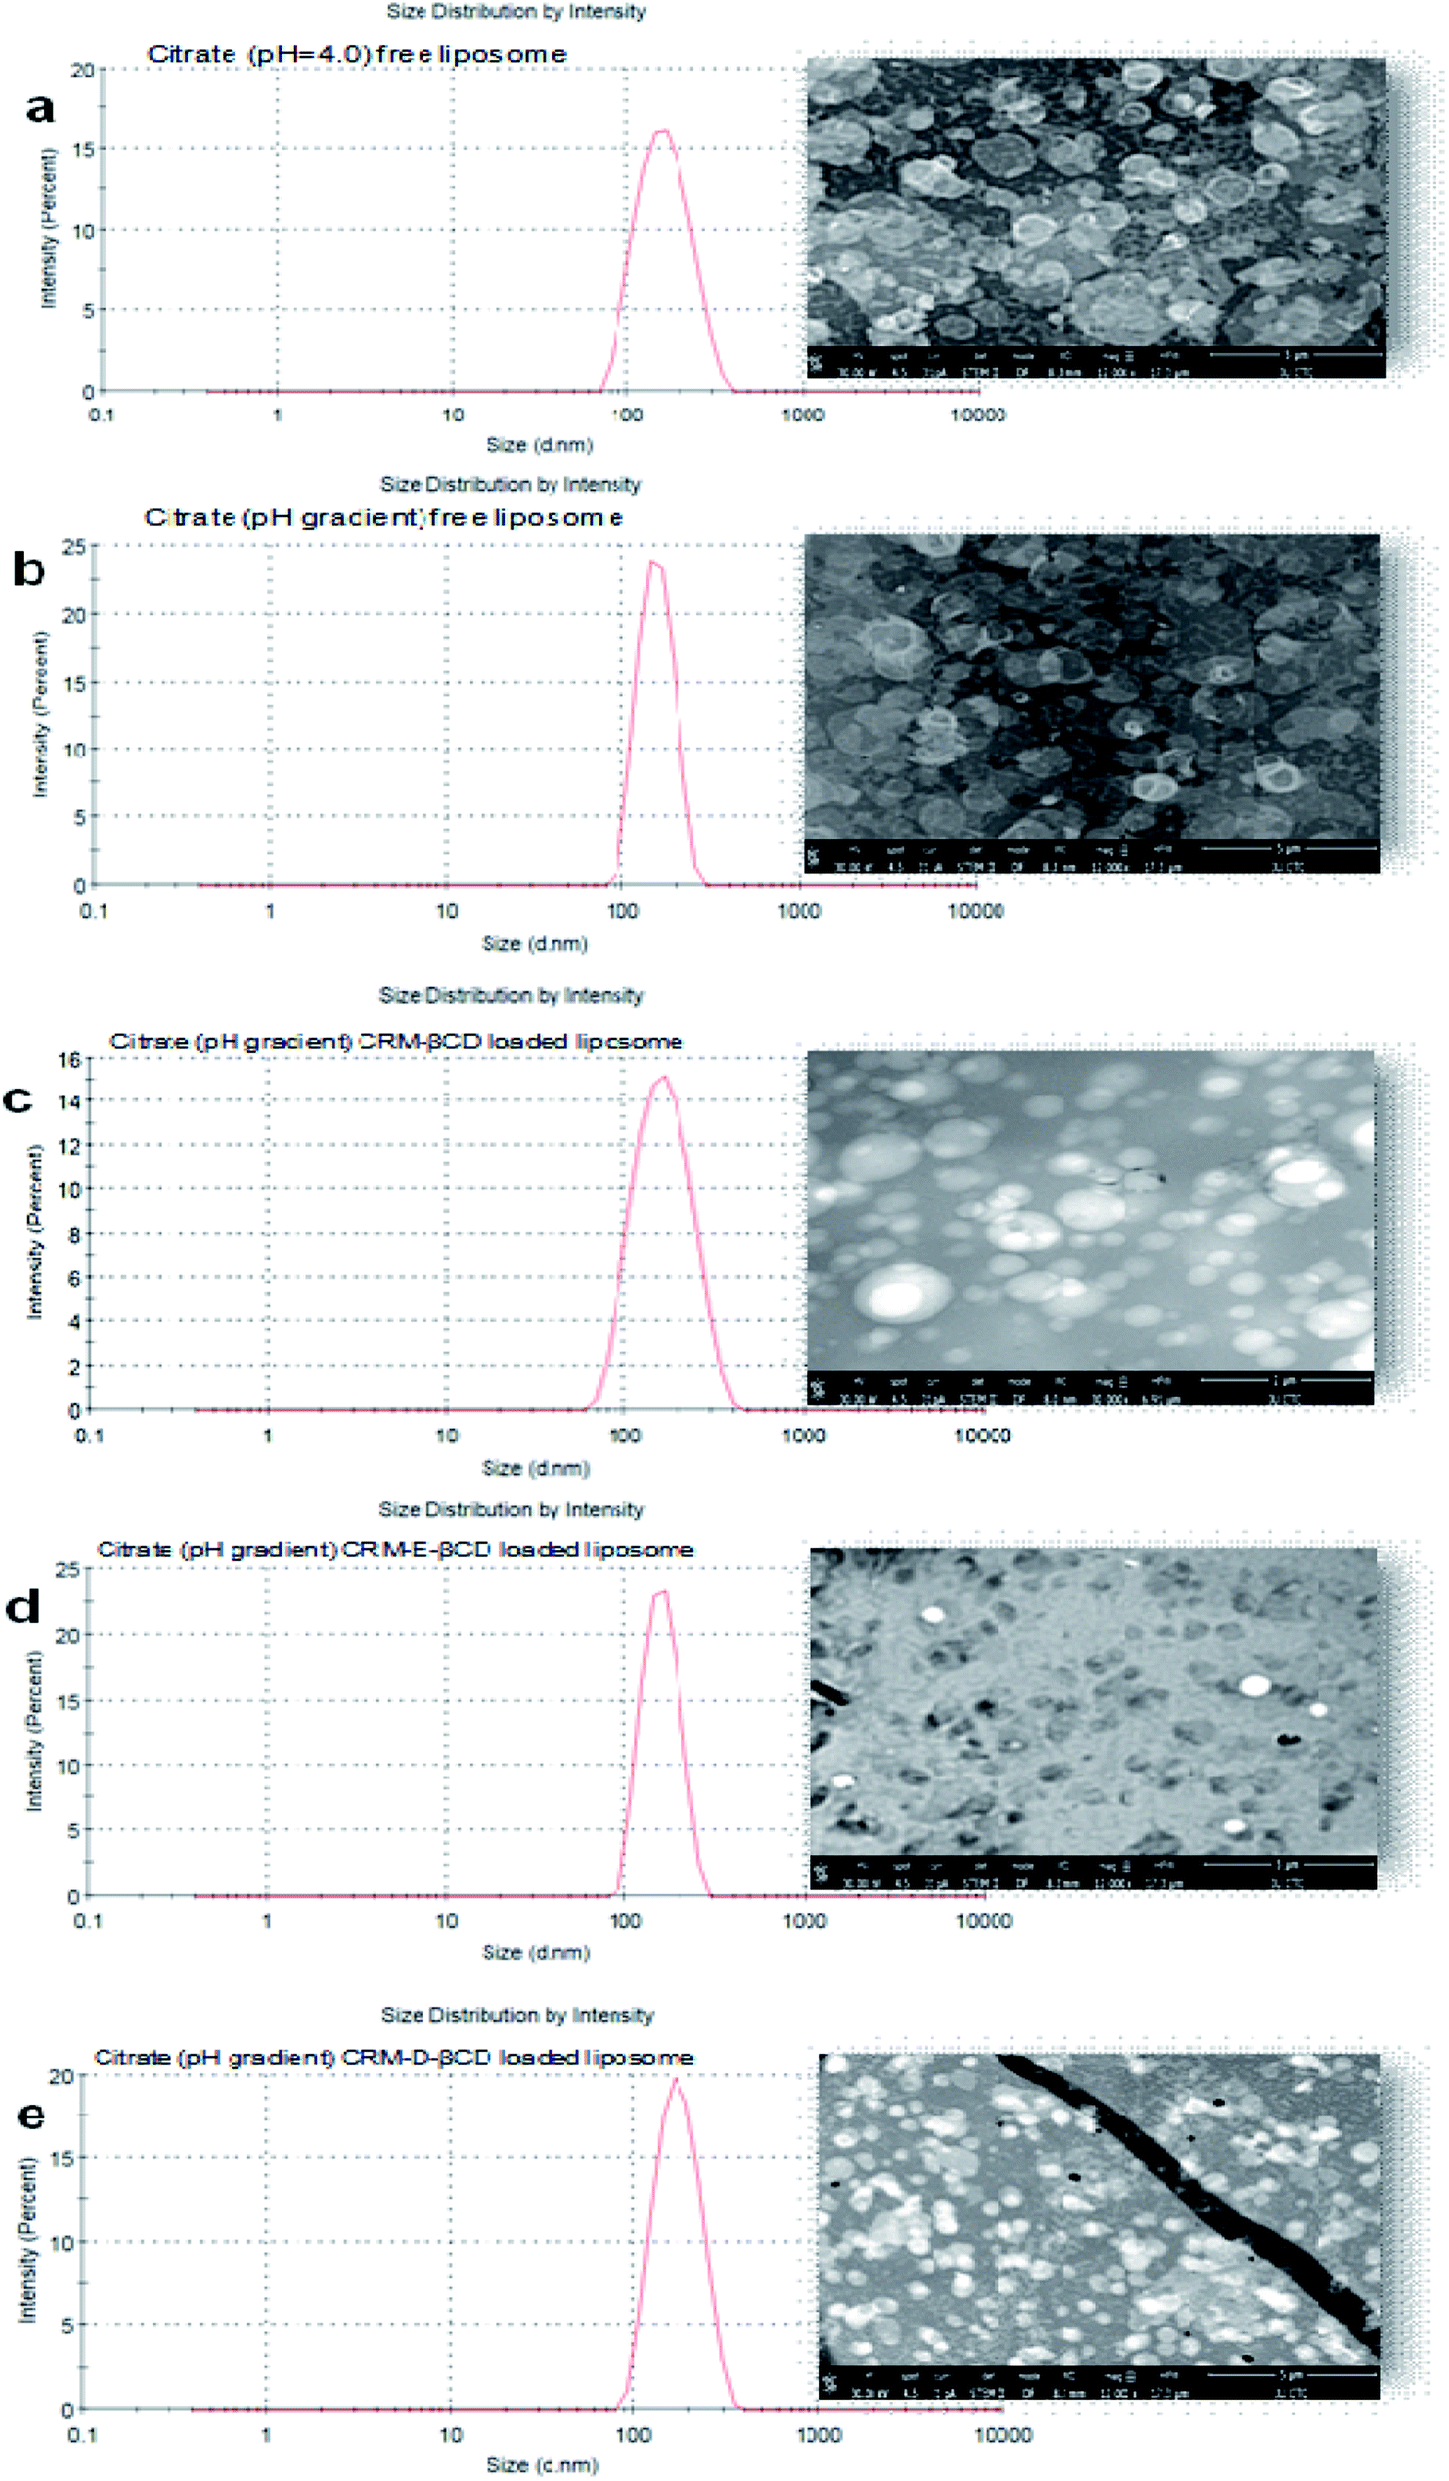 | ||
| Fig. 10 Size distribution by DLS and TEM micrographs (a) pH = 4 blank liposomes, (b) pH gradient blank liposomes, (c) CRM -βCD loaded liposomes, (d) CRM-E-βCD loaded liposomes and (e) loaded CRM-D-βCD liposomes. | ||
| Liposome | Complex type | Average particle size (Zavg) (d nm ± SD) | (PDI ± SD) | Zeta potential (mV ± SD) | (EE% ± SD) |
|---|---|---|---|---|---|
| PBS liposome | Free | 139.39 ± 3.00 | 0.05 ± 0.04 | −0.70 ± 2.94 | — |
| CRM-E-βCD | 146.13 ± 2.20 | 0.08 ± 0.01 | −1.78 ± 2.60 | 10.74 ± 2.27 | |
| CRM-D-βCD | 148.07 ± 2.49 | 0.09 ± 0.01 | −4.74 ± 0.72 | 7.72 ± 2.33 | |
| Citrate liposome | Free | 151.33 ± 2.03 | 0.04 ± 0.02 | −7.00 ± 0.74 | — |
| CRM-βCD | 151.13 ± 1.42 | 0.03 ± 0.02 | −8.93 ± 3.34 | 16.56 ± 7.38 | |
| CRM-E-βCD | 152.40 ± 3.22 | 0.05 ± 0.02 | −12.33 ± 0.21 | 51.16 ± 6.19 | |
| CRM-D-βCD | 163.20 ± 1.05 | 0.04 ± 0.04 | −18.07 ± 0.21 | 41.73 ± 1.53 |
TEM, the most frequently used imaging method for the evaluation of the structure of nanoparticles,11,48 was employed to confirm the size and morphological characteristics of liposomes before and after active loading. TEM observations (Fig. 10) revealed that the liposomes were homogeneously formed in the intended formulation. The prepared liposomes almost maintained their spherical shape with uniformed dispersion and showed good stability in citrate buffer over the wide transmembrane pH gradient range. No noticeable changes or disruption were observed after liposomes active loading at 65 °C.49
Encapsulation efficiency is an expression of the amount of drug complex incorporated into the liposome and is normally defined as the percentage of drug complex entrapped in liposomes relative to the total amount of drug complex. Different factors affect the encapsulation efficiency such as pH gradient, aqueous media type, buffer concentration and the type of the ionized functional group.50 We found that CRM-E-βCD complex showed higher encapsulation efficiency in pH gradient liposomes compared to other formulation. E-βCD, with its secondary amine, has a moderate pKa that enables them to be in neutral form outside the liposome prior active loading. While in the case of D-βCD, with its tertiary amine, the external 10.5 pH maybe not high enough to neutralize all the tertiary amino groups of D-βCD, and some of them were protonated prior active loading which limited their active loading.
4. Conclusions
In conclusion, our results support the new active loading strategy for hydrophobic drugs into liposomes. This approach uses modified cyclodextrins with ionizable groups as a carrier and solubilizer. We have encapsulated a promising pharmaceutical agent, CRM, into the modified βCDs. The stoichiometry of 1:1 or 1:2 of the inclusion complex was determined by job's plot and modified Benesi–Hildebrand equation as well as the formation constant of complexes. Entire complex characterization was also done, which confirms predominantly that the aromatic rings of the CRM have entrapped into the βCD cavity. This inclusion allowed CRM to be remotely loaded into liposomes and masking the undesirable characteristics of CRM with high encapsulation efficiency. Previous studies to incorporate CRM with liposomes were limited to passive loading. Passive loading often leads to undesirable membrane incorporation, lowering liposome stability, and is much less efficient than active loading. Since most promising drugs are hydrophobic, this strategy will enhance the solubility and the selectivity of drug delivery systems despite each drug requires a different approach to manage all of its properties. The type of cyclodextrin modification plays an important role in encapsulation efficiency in addition to the pH gradient range and the incubation temperature. This strategy opens the way for the entrapment of various hydrophobic drugs into the biocompatible liposomes with high entrapment efficiency. Our study brings the idea to support the use of βCDs as a key tool to improve CRM characteristics for using this widely available natural product into effective drugs. Other forms of cyclodextrins, as γ-CD, have a pocket of larger size, can be used to encapsulate larger or additional compounds.
Conflicts of interest
The authors declare no conflict of interest.References
- T. Loftsson, S. B. Vogensen, M. E. Brewster and F. Konradsdottir, J. Pharm. Sci., 2007, 96(10), 2532–2546 CrossRef CAS PubMed.
- J. W. Park, Breast Cancer Res., 2002, 4(3), 95–99 CrossRef CAS PubMed.
- S. S. Dhule, P. Penfornis, T. Frazier, R. Walker, J. Feldman, G. Tan, J. He, A. Alb, V. John and R. Pochampally, Nanomedicine, 2012, 8(4), 440–451 CrossRef CAS PubMed.
- G. T. Noble, J. F. Stefanick, J. D. Ashley, T. Kiziltepe and B. Bilgicer, Trends Biotechnol., 2014, 32(1), 32–45 CrossRef CAS PubMed.
- A. Hafner, J. Lovric, G. P. Lakos and I. Pepic, Int. J. Nanomed., 2014, 9, 1005–1023 Search PubMed.
- J. Gubernator, Expert Opin. Drug Delivery, 2011, 8(5), 565–580 CrossRef CAS PubMed.
- S. H. Hwang, Y. Maitani, X. R. Qi, K. Takayama and T. Nagai, Int. J. Pharm., 1999, 179(1), 85–95 CrossRef CAS PubMed.
- A. Ascenso, M. Cruz, C. Euleterio, F. A. Carvalho, N. C. Santos, H. C. Marques and S. Simoes, J. Liposome Res., 2013, 23(3), 211–219 CrossRef CAS PubMed.
- Y. Deng, J. Ling and M. H. Li, Nanoscale, 2018, 10(15), 6781–6800 RSC.
- T. M. Allen and P. R. Cullis, Adv. Drug Delivery Rev., 2013, 65(1), 36–48 CrossRef CAS PubMed.
- W. Alshaer, M. Zraikat, A. Amer, H. Nsairat, Z. Lafi, D. A. Alqudah, E. Al Qadi, T. Alsheleh, F. Odeh, A. Alkaraki, M. Zihlif, Y. Bustanji, E. Fattal and A. Awidi, RSC Adv., 2019, 9(53), 30976–30988 RSC.
- X. Zhang and C. Wang, Chem. Soc. Rev., 2011, 40(1), 94–101 RSC.
- E. M. M. Del Valle, Process Biochem., 2004, 39(9), 1033–1046 CrossRef CAS.
- T. R. Thatiparti and H. A. von Recum, Macromol. Biosci., 2010, 10(1), 82–90 CrossRef CAS PubMed.
- G. Astray, C. Gonzalez-Barreiro, J. C. Mejuto, R. Rial-Otero and J. Simal-Gándara, Food Hydrocolloids, 2009, 23(7), 1631–1640 CrossRef CAS.
- P. Purkayastha, S. S. Jaffer and P. Ghosh, Phys. Chem. Chem. Phys., 2012, 14(16), 5339–5348 RSC.
- S. Sur, A. C. Fries, K. W. Kinzler, S. Zhou and B. Vogelstein, Proc. Natl. Acad. Sci. U. S. A., 2014, 111(6), 2283–2288 CrossRef CAS PubMed.
- D. B. Fenske and P. R. Cullis, Expert Opin. Drug Delivery, 2008, 5(1), 25–44 CrossRef CAS PubMed.
- D. C. Drummond, C. O. Noble, Z. Guo, K. Hong, J. W. Park and D. B. Kirpotin, Cancer Res., 2006, 66(6), 3271–3277 CrossRef CAS PubMed.
- G. Bar-Sela, R. Epelbaum and M. Schaffer, Curr. Med. Chem., 2010, 17(3), 190–197 CrossRef CAS PubMed.
- M. M. Yallapu, M. Jaggi and S. C. Chauhan, Colloids Surf., B, 2010, 79(1), 113–125 CrossRef CAS PubMed.
- T. L. Lapenda, W. A. Morais, F. J. Almeida, M. S. Ferraz, M. C. Lira, N. P. Santos, M. A. Maciel and N. S. Santos-Magalhaes, J. Biomed. Nanotechnol., 2013, 9(3), 499–510 CrossRef CAS PubMed.
- H. Arima, Y. Hagiwara, F. Hirayama and K. Uekama, J. Drug Targeting, 2006, 14(4), 225–232 CrossRef CAS PubMed.
- N. Wang, X. Yu, K. Zhang, C. A. Mirkin and J. Li, J. Am. Chem. Soc., 2017, 139(36), 12354–12357 CrossRef CAS PubMed.
- H.-M. Shen and H.-B. Ji, Carbohydr. Res., 2012, 354, 49–58 CrossRef CAS PubMed.
- M. M. Yallapu, M. Jaggi and S. C. Chauhan, Colloids Surf., B, 2010, 79(1), 113–125 CrossRef CAS PubMed.
- H. Y. Wang, J. Han and X. G. Feng, Spectrochim. Acta, Part A, 2007, 66(3), 578–585 CrossRef PubMed.
- J. S. Negi and S. Singh, Carbohydr. Polym., 2013, 92(2), 1835–1843 CrossRef CAS PubMed.
- C. Nicolazzi, S. Abdou, J. Collomb, A. Marsura and C. Finance, Bioorg. Med. Chem., 2001, 9(2), 275–282 CrossRef CAS PubMed.
- T. Cardoso, C. I. C. Galhano, M. F. Ferreira Marques and A. Moreira da Silva, Spectros. Int. J., 2012, 27(5–6), 329–336 CrossRef CAS.
- R. Rajaram, K. N. Sundararajalu and S. Meenakshisundaram, J. Fluoresc., 2011, 21(2), 521–529 CrossRef CAS PubMed.
- C. Tablet, I. Matei and M. Hillebrand, The Determination of the Stoichiometry of Cyclodextrin Inclusion Complexes by Spectral Methods: Possibilities and Limitations, INTECH Open Access Publisher, 2012 Search PubMed.
- K. Srinivasan, T. Stalin and K. Sivakumar, Spectrochim. Acta, Part A, 2012, 94, 89–100 CrossRef CAS PubMed.
- F. Odeh, S. I. Ismail, R. Abu-Dahab, I. S. Mahmoud and A. Al Bawab, Drug Delivery, 2012, 19(8), 371–377 CrossRef CAS PubMed.
- A. D. Bangham, M. M. Standish and J. C. Watkins, J. Mol. Biol., 1965, 13(1), 238–252 CrossRef CAS PubMed.
- S. G. M. Ong, L. C. Ming, K. S. Lee and K. H. Yuen, Pharmaceutics, 2016, 8(3), 25 CrossRef PubMed.
- P. Panwar, B. Pandey, P. C. Lakhera and K. P. Singh, Int. J. Nanomed., 2010, 5, 101–108 CAS.
- S. Hashimoto and J. K. Thomas, J. Am. Chem. Soc., 1985, 107(16), 4655–4662 CrossRef CAS.
- S. Mohamad, H. Surikumaran, M. Raoov, T. Marimuthu, K. Chandrasekaram and P. Subramaniam, Int. J. Mol. Sci., 2011, 12(9), 6329–6345 CrossRef CAS PubMed.
- V. Jahed, A. Zarrabi, A.-k. Bordbar and M. S. Hafezi, Food Chem., 2014, 165, 241–246 CrossRef CAS PubMed.
- N. M. Patro, A. Sultana, K. Terao, D. Nakata, A. Jo, A. Urano, Y. Ishida, R. N. Gorantla, V. Pandit, K. Devi, S. Rohit, B. K. Grewal, E. M. Sophia, A. Suresh, V. K. Ekbote and S. Suresh, J. Inclusion Phenom. Macrocyclic Chem., 2014, 78(1–4), 471–483 CrossRef CAS.
- Z. Aytac and T. Uyar, Int. J. Pharm., 2017, 518(1), 177–184 CrossRef CAS PubMed.
- K. N. Baglole, P. G. Boland and B. D. Wagner, J. Photochem. Photobiol., A, 2005, 173(3), 230–237 CrossRef CAS.
- A. B. Hegge, M. Masson, S. Kristensen and H. H. Tonnesen, Pharmazie, 2009, 64(6), 382–389 CAS.
- K. P. Sambasevam, S. Mohamad, N. M. Sarih and N. A. Ismail, Int. J. Mol. Sci., 2013, 14(2), 3671–3682 CrossRef CAS PubMed.
- B. Cwiertnia, T. Hladon and M. Stobiecki, J. Pharm. Pharmacol., 1999, 51(11), 1213–1218 CrossRef CAS PubMed.
- H.-J. Schneider, F. Hacket, V. Rüdiger and H. Ikeda, Chem. Rev., 1998, 98(5), 1755–1786 CrossRef CAS PubMed.
- J. Kuntsche, J. C. Horst and H. Bunjes, Int. J. Pharm., 2011, 417(1–2), 120–137 CrossRef CAS PubMed.
- M. Placzek and M. Kosela, Acta Pharm., 2016, 66(1), 1–22 CAS.
- S. Du and Y. Deng, Drug Dev. Ind. Pharm., 2006, 32(7), 791–797 CrossRef CAS PubMed.
Footnotes |
| † Electronic supplementary information (ESI) available. See DOI: 10.1039/c9ra07560g |
| ‡ Authors contributed equally to this work. |
| This journal is © The Royal Society of Chemistry 2019 |