 Open Access Article
High ion adsorption densities of site-selective nitrogen doped carbon sheets prepared from natural lignin†
Yosuke Ishii *a,
Koki Ishigamea,
Yusuke Kidoa,
Yuichiro Katoa,
Kengo Yamamotoa,
Kento Sagisakab,
Yoshiyuki Hattorib,
Ayar Al-zubaidi
 a,
Kohei Kondoa and
Shinji Kawasaki
 *a
*a
aDepartment of Life Science and Applied Chemistry, Nagoya Institute of Technology, Gokiso-cho, Showa-ku, Nagoya 466-8555, Japan. E-mail: ishii.yosuke@nitech.ac.jp; kawasaki.shinji@nitech.ac.jp
bDepartment of Chemistry and Materials, Faculty of Textile Science and Technology, Shinshu University, 3-15-1 Tokida, Ueda 386-8567, Japan
First published on 18th December 2019
Abstract
Carbon fibers and sheets were prepared from jet-milled natural chitin and cellulose samples, and from natural lignin sample using ice-templating technique, respectively. Nitrogen doping treatments using melamine were also performed for the carbon fibers and sheets. Electric double layer capacitor (EDLC) electrode properties of the prepared carbon fibers and sheets including the nitrogen doped samples were investigated with aqueous (sulfuric acid) and organic (tetraethylammonium tetrafluoroborate in propylene carbonate) electrolytes. It was found that the nitrogen doped lignin carbon sheets having very small specific surface area of 66 m2 g−1 show very high EDLC capacitances of 227 F g−1 and 80 F g−1 determined by charge–discharge measurements at current density of 50 mA g−1 for aqueous and organic electrolytes, respectively. X-ray photoelectron spectroscopy (XPS) measurements revealed that nitrogen atoms of the nitrogen doped lignin carbon sheets exist dominantly in pyridinic sites unlike other chitin and cellulose carbon fibers. We discussed that this site-selective nitrogen doping gives exceptionally high ion adsorption density per unit surface area of the nitrogen doped lignin carbon sheets.
Introduction
The energy paradigm shift from fossil fuels to renewable energy has been a long sought-after goal to solve energy and environmental problems, including the issue of global warming.1 However, renewable energy such as solar energy and wind power energy usually cannot generate constant electric power. Therefore, the electric power generated by renewable sources should be stabilized by using energy storage devices. Secondary batteries represented by Li ion batteries are used as such load-leveling devices. However, since secondary batteries store electric energy by chemical reactions at electrodes, they require quite a long charging time and they are not appropriate for a short-time load-leveling. For such a purpose, electric double-layer capacitors (EDLCs) present a more effective solution.2–4Unlike the secondary batteries, EDLCs store electric energy just by adsorbing electrolyte ions on the surface of electrodes without any chemical reactions. Therefore, it is possible to charge and discharge EDLCs in a short time. On the other hand, the energy densities of EDLCs are much less than those of secondary batteries, because only the surface of EDLC electrode materials acts as ion adsorption sites, while ions can be stored inside of the electrode materials in secondary batteries. To increase energy density of EDLC, it is necessary to use electrode materials having large specific surface area. Activated carbons are used in conventional EDLCs, because activated carbons have very large specific surface area and good chemical stability.5
However, next generation EDLCs having much larger energy densities have been demanded for the renewable energy applications discussed above. Considerable research to develop new electrode materials instead of the conventional activated carbons has been conducted. Among many candidates, nanocarbon materials such as carbon nanotubes and graphene that have high surface area and good chemical stability similar to activated carbons have attracted plenty of attention owing to their superior EDLC properties.6–11 Recently, many researchers have reported the improvement in the performance of nano-carbon EDLC electrodes by doping with nitrogen atoms (N-doping).12,13 However, since natural energy back-up devices require a considerably high mass loading of the active material to be used in the EDLC electrode, nanocarbon materials should be excluded for such purposes because of their extremely high synthesis costs.
We consider in the present study the development of nanocarbon-like materials from natural materials. Namely, we tried to prepare carbon fibers and sheets having structures similar to those of carbon nanotubes and graphene from natural materials. Specifically, we prepared carbon fibers from crab shells and wood cellulose, and prepared carbon sheets from wood lignin. Crab shells, wood cellulose, and wood lignin are naturally abundant low-cost polymer materials. According to recent reports,14 cellulose nanofiber and chitin nanofibers can easily be obtained from wood cellulose and natural crab shells, respectively. Such bio-nanofibers should ideal source for low-cost carbon nanofiber. Lignin is a well known and well-used carbon source for EDLC electrodes. However, nano-structured material cannot be obtained by simple carbonization treatments, because lignin composed of 3-dimensionally cross-linked phenolic polymers (Fig. S1(c)†). In order to obtain nanosheet-shape material, we tried to use an ice templating method. We expected the polymer chain of lignin could to be cut by the 2-dimentional ice crystals formed at rapid quenching condition, and the ice crystal prevent aggregation of the individual lignin block. Furthermore, and considering that nitrogen atom doping is very effective in improving the EDLC properties of nano-carbon materials, we performed nitrogen atom doping treatments for those carbon materials, and examined the EDLC properties of the obtained products.
In this paper, we first describe how we prepared nanocarbon-like materials from natural materials: chitin, cellulose, lignin. Then, we explain about N-doping procedures for the prepared nano-carbon-like materials. The EDLC electrode properties of the obtained nanocarbon-like materials were thoroughly investigated. We found very interesting property that N-doped carbon sheets derived from lignin show extremely high ion adsorption density per unit surface area. We discuss how this high ion density relates to an N-doping site and describe that the selective N-doping to the site would be explained by the original molecular structure of lignin.
Experimental
Preparation of chitin and cellulose fibers
The chitin sample used in the present study was prepared from crab shells of Penaeus monodon. First, the shells were soaked in 2 M HCl aqueous solution overnight to remove CaCO3. Then, the proteins and dyes were removed by alkali treatment using 1 M NaOH solution. After washing with deionized water, the acid and alkali treatments were repeated to remove the impurities completely. These treatments also promoted deacetylation of chitin polymers hence the partial conversion of chitin polymers into chitosan form. However, while including both chitin and chitosan forms, the sample will be referred to in this paper as the “chitin” sample for simplicity. Chitin fibers were obtained by jet milling (Star Burst Mini of Sugino Machine Limited) of the chitin sample as follows: the chitin powder sample (2 g) was dispersed in distilled water (148 g). Jet milling at 200 MPa was repeated 20 times. Cellulose fibers from cellulose powder sample were also prepared by the same way as the chitin sample. The mean degree of polymerization of the cellulose fibers and viscosity of the cellulose fiber dispersion (2 wt%) were 650 and 3000 mPa s, respectively.Preparation of lignin sheets
Lignin extracted from conifer wood (Nacalai Tesque Co.; isolated by the soda process) was used as the starting material. 31P NMR and FT-IR spectra of the lignin powder are shown in Fig. S2 and S3.† A lignin powder sample (1 g) dispersed in pure water (100 ml) was sonicated by a homogenizer (Branson sonifier 250) then frozen using liquid nitrogen. The ice templates were removed by sublimation of water molecules using a freeze-dry machine (Tokyo Rikakikai Co. EYELA FDU-1200). Lignin sheets were obtained by this freeze-dry treatment.Carbonization and nitrogen doping
The carbonization of chitin and cellulose fibers, and lignin sheets was done by heat treatment at 800 °C under Ar flow (30 sccm) for 2 h. The heating and cooling rate were set to 5 °C min−1 and 10 °C min−1, respectively. For cellulose and lignin carbon samples, N-doping treatments using melamine powders were performed. Melamine powders were added to water-dispersed cellulose fibers after the jet milling and to water-dispersed lignin before the sonication treatment, respectively. The weight ratio of the carbon sources melamine![[thin space (1/6-em)]](https://www.rsc.org/images/entities/char_2009.gif) :
:![[thin space (1/6-em)]](https://www.rsc.org/images/entities/char_2009.gif) carbon sources (cellulose or lignin) was set to 1
carbon sources (cellulose or lignin) was set to 1![[thin space (1/6-em)]](https://www.rsc.org/images/entities/char_2009.gif) :
:![[thin space (1/6-em)]](https://www.rsc.org/images/entities/char_2009.gif) 1. After drying the melamine-cellulose and melamine-lignin samples by freeze-drying, the samples were heated at 800 °C under Ar flow (30 sccm) for 2 h. The heating and cooling rate were set to 5°C min−1 and 10°C min−1, respectively.
1. After drying the melamine-cellulose and melamine-lignin samples by freeze-drying, the samples were heated at 800 °C under Ar flow (30 sccm) for 2 h. The heating and cooling rate were set to 5°C min−1 and 10°C min−1, respectively.
Characterization
The lignin sample before carbonization treatment was characterized by FTIR (JASCO FT/IR-6300), 31P NMR (Bruker AV500) spectroscopy. The 31P NMR spectroscopy was conducted as previously reported,15 using 2-chloro-4,4,5,5-tetramethyl-1-3-2-dioxaphospholane as a phosphitylating agent. The prepared carbon samples were characterized by SEM (JEOL JSM-6510, 6010LA), XPS (ULVAC-PHI PHI5000), Raman (JASCO, NRS-3300), synchrotron radiation XRD (KEK in Tsukuba, Japan) and N2 adsorption isotherm (Shimadzu 2375) measurements.EDLC electrode properties
Charge–discharge and cyclic voltammetry (CV) experiments were performed in a three-electrode cell. The working electrode was prepared by kneading of a mixture of 8![[thin space (1/6-em)]](https://www.rsc.org/images/entities/char_2009.gif) :
:![[thin space (1/6-em)]](https://www.rsc.org/images/entities/char_2009.gif) 1
1![[thin space (1/6-em)]](https://www.rsc.org/images/entities/char_2009.gif) :
:![[thin space (1/6-em)]](https://www.rsc.org/images/entities/char_2009.gif) 1 of the synthesized carbon sample: carbon black: polytetrafluoroethylene (PTFE). The carbon mixtures were formed into a sheet shape (diameter: 1 cm; thickness: 4 μm), and wrapped with a Pt-mesh (current corrector). An excess amount of activated carbon fibers was used for the counter electrode. Two kinds of electrolyte were used: 1 M H2SO4 aqueous electrolyte, and 1 M tetraethylammonium tetrafluoroborate (TEMA-BF4) in propylene carbonate (PC) organic electrolyte. Ag/AgCl and Ag/Ag+ were used as reference electrodes for the aqueous and organic electrolytes, respectively.
1 of the synthesized carbon sample: carbon black: polytetrafluoroethylene (PTFE). The carbon mixtures were formed into a sheet shape (diameter: 1 cm; thickness: 4 μm), and wrapped with a Pt-mesh (current corrector). An excess amount of activated carbon fibers was used for the counter electrode. Two kinds of electrolyte were used: 1 M H2SO4 aqueous electrolyte, and 1 M tetraethylammonium tetrafluoroborate (TEMA-BF4) in propylene carbonate (PC) organic electrolyte. Ag/AgCl and Ag/Ag+ were used as reference electrodes for the aqueous and organic electrolytes, respectively.
Results & discussion
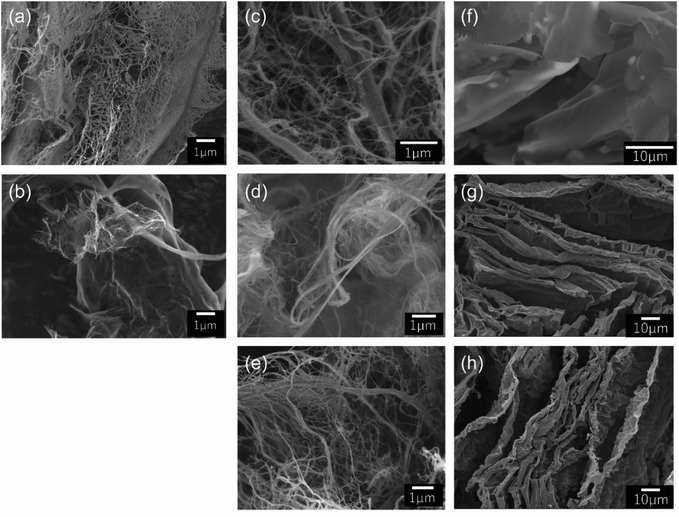
We obtained fiber form chitin and cellulose samples by jet milling (Fig. 1(a) and (c)). Chitin and cellulose have similar molecular structures having linearly connected hetero-rings consisting of oxygen and carbon atoms (Fig. S1(a) and (b)†). Jet milling breaks the hydrogen bonds of chitin and cellulose linear hetero-ring chains by physical power, and changes them to fiber forms. The linear hetero-ring chains are connected with each other by relatively strong hydrogen bonds. Therefore, if chitin and cellulose are carbonized at high temperature without jet milling, carbon materials having no structural feature and low specific surface area are produced. Recently, many papers reported the preparation of cellulose fibers by TEMPO (2,2,6,6-tetramethylpiperidine 1-oxyl) treatments that substitute hydroxyl groups of cellulose by carboxyl groups.16 Unlike TEMPO treatments, jet milling is an easier way to obtain chitin and cellulose fibers. We could obtain carbon fibers by heating the chitin and cellulose fibers in inert atmosphere (Fig. 1(b) and (d)). On the other hand, lignin, which is a kind of polymer having aromatic rings (Fig. S1(c)†), has quite different molecular structure from chitin and cellulose. It is expected that graphene-like structure would be obtained by fusing the aromatic rings of lignin during the carbonization process. However, if lignin is carbonized without pre-treatment, lignin is converted to carbon materials having no structural feature (Fig. S4†). In this work, we have freeze-dried the lignin sample in ice templates prior to the carbonization step, and thereby obtained graphene-like carbon sheets (Fig. 1(g)). For the carbonized cellulose and lignin samples, N-doping treatments using melamine17 were performed. Judging from the observed SEM pictures of the N-doped cellulose and lignin carbons, the N-doping treatment caused no significant structural damage for the two carbon materials.As shown in Fig. 1, we could prepare carbon fibers from chitin and cellulose, and sheets from lignin. The specific surface area and pore size distribution curves of the prepared materials were investigated by N2 adsorption experiments. The observed N2 adsorption isotherms are shown in Fig. 2. Adsorption amounts shown in Fig. 2 are not very high for all the samples. The calculated specific surface area of carbon fibers derived from chitin and cellulose are 260.8 and 425.3 m2 g−1, respectively and no significant pore structural features are observed for them. On the other hand, specific surface area of the carbon sheets from lignin is only 73.6 m2 g−1 which is much less than those of the chitin and cellulose carbon fibers. Since lignin has many aromatic rings, smooth growth of graphene-like structure is promoted in the carbonization process. This would be the reason of quite low specific surface area. It should be noted that the surface area value does not change very much by the N-doping treatment from 73.6 to 66.3 m2 g−1. It means that the N-doping treatment does not give much damage to the graphene-like structure of the lignin carbon sheets (Fig. S5†).
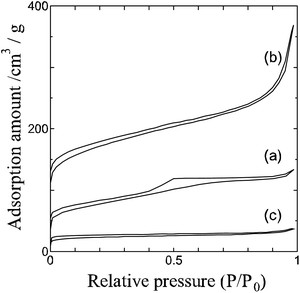 | ||
| Fig. 2 Nitrogen gas adsorption isotherm curves of (a) carbonized chitin, (b) carbonized cellulose, (c) carbonized lignin samples. | ||
Since nitrogen atoms are included in chitin polymer, the carbonized chitin sample also includes nitrogen atoms. The nitrogen amount of the carbonized chitin sample was evaluated to be 6.5% by XPS measurements (Fig. 3(a)). On the other hand, we doped nitrogen atoms to cellulose and lignin carbon samples using melamine. Melamine is decomposed through g-C3N4 at high temperature. During the decomposition of melamine, the released NH3 molecules react with carbon materials and some nitrogen atoms are doped in the carbon materials. XPS measurements were also done for the N-doped cellulose and lignin carbons. The doped nitrogen content for cellulose and lignin carbons is 8.1 and 4.5%, respectively. The observed N 1s XPS spectrum of the N-doped cellulose carbon has two main peaks at around 398 eV and 401 eV (Fig. 3(b)), and is very similar as that of the carbonized chitin sample, while the N 1s spectrum of the N-doped lignin carbon shows a single peak at around 398 eV (Fig. 3(c)). The higher energy peak observed at around 401 eV for chitin and cellulose samples corresponds to graphitic-N site which is surrounded by three sp2 carbon atoms.18,19 Graphitic-N occupies substitutionary one carbon atom site of graphene. Since a part of electrons of graphitic-N flows to the neighbouring carbon atoms, graphitic-N atom has partial positive charge and its 1s electron energy shifts toward higher energy side. The other N 1s peak observed at 398 eV is assigned as pyridinic-N which connects to two sp2 carbon atoms. Pyridinic-N attracts electron from the two neighbour carbon atoms by its stronger electron affinity than carbon and has partial negative charge. Therefore, the N 1s energy position of pyridinic-N is about 3 eV lower than that of graphitic-N. Many researchers have tried to deconvolute the N 1s spectrum of N-doped carbon materials to many N-doping site peaks. However, such deconvolution with many peaks sometimes seems to be unreasonable. To avoid such ambiguity, we have performed in this work curve fitting analysis for the observed N 1s spectra only with graphitic and pyridinic N peaks. As mentioned above, both graphitic and pyridinic N peaks were observed for the prepared chitin carbon sample and the N-doped cellulose carbon sample, while only a pyridinic N peak was observed for the N-doped lignin carbon sample. C 1s spectral profiles of cellulose and lignin carbon samples changed by N-doping treatments and peak shoulder at higher energy side of C 1s peak appears after the treatments. The shoulder peak corresponds to the carbon atoms connected with nitrogen atom.
 | ||
| Fig. 3 N 1s XPS spectra of (a) carbonized chitin, (b) N-doped carbonized cellulose, (c) N-doped carbonized lignin samples. | ||
We have measured EDLC electrode properties of the five samples: the carbonized chitin, cellulose, and lignin samples, and the N-doped cellulose and lignin carbon samples. For convenience, the five samples are abbreviated as Chitin-C, Cellulose-C, Lignin-C, N-Cellulose-C, N-Lignin-C, respectively. In this paper, we discuss the EDLC properties of the five samples carbonized at 800 °C. When we discuss EDLC capacitance in this paper, we will use the capacitance value of each sample evaluated from cyclic voltammogram (CV) measured at 5 mV s−1 or charge–discharge (CD) curve measured at constant current density of 50 mA g−1, because the measured capacitance values highly depend on the charging rate. In order to avoid confusion, capacitance values will be shown along with the measuring method (e.g. 30 F g−1 (CV) or 50 F g−1 (CD)).
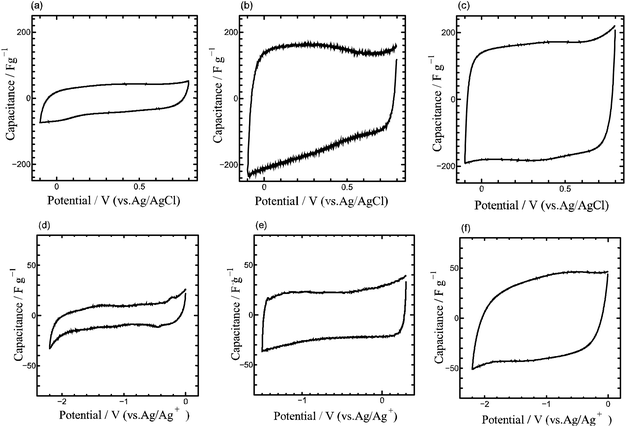
As shown in Fig. 4, Chitin-C shows EDLC capacitance of 20–30 F g−1 (CV) in 1 M H2SO4 electrolyte and 5–10 F g−1 (CV) in organic electrolyte, which are much smaller values than those of conventional EDLC electrode materials (e.g. activated carbons). The observed CV shape of Chitin-C in relatively narrow potential range is rectangular and no redox peaks suggestive of pseudocapacitance were observed even in the wider potential range (Fig. 4(a) and (d)).
Since the specific surface area of Cellulose-C is greater than that of Chitin-C, Cellulose-C shows much greater EDLC capacitances than Chitin-C. However, the observed values are still much less than those of activated carbons. The EDLC capacitance of Cellulose-C in H2SO4 electrolyte was greatly improved by N-doping from about 80 F g−1 (CV) to 180 F g−1 (CV). On the other hand, for the organic electrolyte, N-Cellulose-C showed small capacitance of about 20 F g−1 (CV) which is almost the same value as Cellulose-C (Fig. S6†).
Unlike Cellulose-C, the EDLC capacitances of Lignin-C were greatly increased by N-doping both in the cases of the acid electrolyte and the organic electrolyte. The capacitance of N-Lignin-C in acid and organic electrolytes is about 180 and 40 F g−1 (CV), respectively (Fig. 4(c) and (f)). These values are about twice as high as those of Lignin-C (Fig. S7†). It should be noted that the specific surface area of Lignin-C does not change so much by N-doping treatment. The observed BET area of N-Lignin-C (66.3 m2 g−1) is smaller rather than that of Lignin-C (77.6 m2 g−1), probably because the heat treatment with melamine removes some kinds of functional groups of Lignin-C. Therefore, the increase of the capacitance by N-doping is not due to the increase of ion adsorption area. Furthermore, as far as we know, the EDLC capacitance per unit specific surface area of N-Lignin-C is extremely greater than that of any other carbon materials. This huge EDLC capacitance per unit area is discussed in the next paragraph. Here, we summarize the common EDLC properties of Chitin-C, Cellulose-C and Lignin-C. For all the samples including the N-doped samples, the observed open circuit voltage (OCV) values are almost the same. The observed OCV values are 400–450 mV for the acid electrolyte and about −200 mV for the organic electrolyte (potential values are referred to each reference electrode). Adsorption ions change at OCV potential from anion to cation or vice versa. Since the observed CV shapes of the five samples are rectangular, the samples do not have a significant difference of ion adsorption property for anion and cation. N-doping treatments did not give pseudocapacitance, because we did not observe any redox peaks in CVs. The doping treatments did not give any increase of specific surface area, rather gave some decrease probably by removing the surface functional groups of the carbonized materials.
Here-in-after, we discuss the extremely large EDLC capacitance per unit surface area of N-Lignin-C. Table 1 summarizes the observed capacitances of Cellulose-C, N-Cellulose-C, Lignin-C and N-Lignin-C. Fig. 5 summarizes the relation between capacitances and surface area of some kinds of carbon materials including N-Cellulose-C and N-Lignin-C. It is shown in Fig. 5 that the capacitance per unit surface area of N-Lignin-C is extremely large. Recently, some papers have reported that some kinds of carbon materials having relatively small surface area show high EDLC capacitances by electrolytic activation. In order to check the possibility of this activation of N-Lignin-C, we have done CV experiments with increasing potential range. However, the observed CVs (Fig. S8†) dismisses that possibility. Namely, we should think about the reason why N-Lignin-C have unusual surface giving extremely huge ion adsorption density. As shown in XPS spectra, N-Cellulose-C have two nitrogen atom doping sites of graphitic- and pyridinic-N. Graphitic-N, which occupies substitutionary one carbon atom site of graphene, improves electric conductivity of carbon materials by transferring a part of electrons of graphitic-N to the neighbouring carbon atoms. Therefore, graphitic-N atoms improve mainly the rate performance of carbon EDLC electrodes. On the other hand, pyridinic-N breaks carbon six-member ring structure and connects with two neighbour carbon atoms. Contrary to graphitic-N, pyridinic-N breaks pi-conjugation system of graphene and thereby the electric conductivity of graphene should be decreased. However, by breaking the carbon atom network and introducing the inhomogeneous electron distribution, some papers discuss that pyridinic-N sites would work as good ion adsorption sites. Chitin-C and N-Cellulose-C took nitrogen atoms in their carbon networks during their carbonization process when carbon six-member ring network was formed. In this process, nitrogen atoms are introduced in several doping sites including graphitic- and pyridinic-N sites. As mentioned above, since graphitic- and pyridinic-N sites have opposite effects on the electric conductivity, it is not easy to predict the conductivity change of carbon materials by N-doping. In fact, N-Cellulose-C showed almost the same magnitude of IR drop in charge–discharge curves as Cellulose-C.
| BET surface area (m2 g−1) | Capacitance (F g−1) | ||
|---|---|---|---|
| Aqueous electrolyte | Organic electrolyte | ||
| Cellulose-C | 425.3 | 134.4 | 13.7 |
| N-Cellulose-C | 376.9 | 162.1 | 21.2 |
| Lignin-C | 73.6 | 137.7 | 14.3 |
| N-Lignin-C | 66.3 | 227.2 | 80.3 |
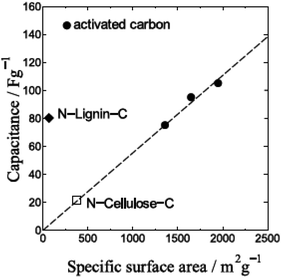 | ||
| Fig. 5 EDLC capacitance of some carbon materials for organic electrolyte as a function of specific surface area. The dashed line is an eye guide. | ||
As lignin has aromatic rings in the starting materials unlike chitin and cellulose, the network structure of carbon six-member ring is formed more easily during the carbonization process of lignin compared to chitin and cellulose. This easier aromatic ring formation might restrain the substitutional N-doping of graphitic-N in the case of N-Lignin-C. Consequently, pyridinic-N site is the dominant doping site of N-Lignin-C. However, the pyridinic-N site of N-Lignin-C should be considered to be slightly different from usual pyridinic-N site. As mentioned above, usual pyridinic-N site breaks carbon six-member ring structure and thereby decreases the electric conductivity. However, in the case of N-Lignin-C, after graphene-like structure is formed, nitrogen atoms are doped. Namely, nitrogen atoms would be doped mainly at the edge part of graphenes. Therefore, the electric conductivity of N-Lignin-C is as the same as that of Lignin-C and it is confirmed by the IR drop values of the two samples (Fig. S9†). It is plausible that the pyridinic-N atoms would increase the ion adsorption at the edge parts of N-Lignin-C.
Fig. 6 shows the rate and cycle performances of N-Lignin-C. The rate performance of N-Lignin-C is not greatly improved from Lignin-C, although the absolute capacitance of N-Lignin-C is much larger than that of Lignin-C (Fig. 6(A)). It is consistent that the electric conductivity of N-Lignin-C is almost the same as that of Lignin-C. We did not observe significant capacitance decrease of N-Lignin-C after 1000 cycles (Fig. 6(B)). This good cycle performance indicates that the nitrogen atoms doped in N-Lignin-C are not chemically unstable.
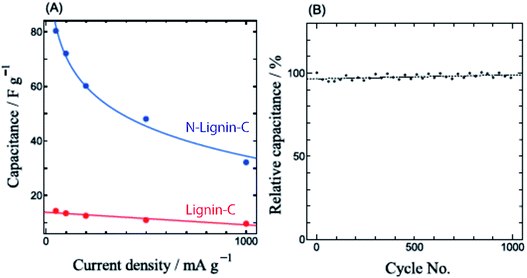 | ||
| Fig. 6 (A) EDLC capacitance values of N-Lignin-C (blue) and Lignin-C (red) for organic electrolyte as a function of charging rate. (B) Cycle performance of N-Lignin-C. | ||
Conclusion
Carbon fibers were prepared from jet-milled natural chitin and cellulose samples. The prepared carbon fibers have relatively high specific surface area. The observed BET surface area of Chitin-C and Cellulose-C are 260.8 and 425.3 m2 g−1, respectively. Carbon sheets were obtained from natural lignin sample using ice-templating technique. Nitrogen doping treatment using melamine was performed for Cellulose-C and Lignin-C. The nitrogen-doped carbon sheet sample from natural lignin (N-Lignin-C) has almost the same sheet structure as Lignin-C and a very small BET surface area of 66.3 m2 g−1. In spite of the small surface area, N-Lignin-C showed very high EDLC capacitances of 227.2 F g−1 and 80.3 F g−1 (CD) for aqueous and organic electrolytes, respectively. XPS measurements revealed that nitrogen atoms of the nitrogen doped lignin carbon sheets exist dominantly in pyridinic sites unlike other chitin and cellulose carbon fibers. We discussed that this site-selective nitrogen doping gives exceptionally high ion adsorption density per unit surface area of the nitrogen doped lignin carbon sheets.Conflicts of interest
There are no conflicts to declare.Acknowledgements
The authors thank the Naito Science and Engineering Foundation, Hibi Science Foundation, Hitachi Global Foundation, Tanikawa Fund promotion of Thermal Technology, and JSPS KAKENHI Grant Numbers 17K14543, 19K15502 and 19H02809 for their financial support to the present study. The synchrotron XRD measurements were performed under the approval of the Photon Factory Program Advisory Committee (Proposal No. 2018G088).References
- G. Martin and E. Saikawa, Nat. Clim. Change, 2017, 7, 912–919 CrossRef CAS.
- T. Kinjo, T. Senjyu, K. Uezato and H. Fujita, Electr. Eng. Jpn., 2006, 154, 34–41 CrossRef.
- A. Allagui, T. J. Freeborn, A. S. Elwakil and B. J. Maundy, Sci. Rep., 2016, 6, 38568 CrossRef CAS PubMed.
- K. Urita, C. Urita, K. Fujita, K. Horio, M. Yoshida and I. Moriguchi, Nanoscale, 2017, 9, 15643–15649 RSC.
- Y. Wang, A. Du Pasquier, D. Li, P. Atanassova, S. Sawrey and M. Oljaca, Carbon, 2018, 133, 1–5 CrossRef.
- S. Shiraishi, H. Kurihara, K. Okabe, D. Hulicova and A. Oya, Electrochem. Commun., 2002, 4, 593–598 CrossRef CAS.
- Y. Taniguchi, Y. Ishii, A. Al-zubaidi and S. Kawasaki, J. Nanosci. Nanotechnol., 2017, 17, 1901–1907 CrossRef CAS.
- A. Al-zubaidi, Y. Ishii, S. Yamada, T. Matsushita and S. Kawasaki, Phys. Chem. Chem. Phys., 2013, 15, 20672–20678 RSC.
- A. Al-zubaidi, T. Inoue, T. Matsushita, Y. Ishii, T. Hashimoto and S. Kawasaki, J. Phys. Chem. C, 2012, 116, 7681–7686 CrossRef CAS.
- Q. Cheng, J. Tang, J. Ma, H. Zhang, N. Shinya and L.-C. Qin, Phys. Chem. Chem. Phys., 2011, 13, 17615–17624 RSC.
- T. Inoue, S. Mori and S. Kawasaki, Jpn. J. Appl. Phys., 2011, 50, 01AF07 CrossRef.
- Z. Zhou, Z. Zhang, H. Peng, Y. Qin, G. Li and K. Chen, RSC Adv., 2014, 4, 5524–5530 RSC.
- Z. Jiang, A. Al-Zubaidi and S. Kawasaki, Mater. Express, 2014, 4, 331–336 CrossRef CAS.
- A. Kafy, H. C. Kim, L. Zhai, J. W. Kim, L. V. Hai, T. J. Kang and J. kim, Sci. Rep., 2017, 7, 17683 CrossRef PubMed.
- T. You, L. Zhang, S. Guo, L. Shao and F. Xu, J. Agric. Food Chem., 2015, 63, 10747–10756 CrossRef CAS PubMed.
- A. Isogai, T. Saito and H. Fukuzumi, Nanoscale, 2011, 3, 71–85 RSC.
- X. Li, J. Zhang, L. Shen, Y. Ma, W. Lei, Q. Cui and G. Zou, Appl. Phys. A, 2009, 94, 387–392 CrossRef CAS.
- T. Schiros, D. Nordlund, L. Pálová, D. Prezzi, L. Zhao, K. S. Kim, U. Wurstbauer, C. Gutiérrez, D. Delongchamp, C. Jaye, D. Fischer, H. Ogasawara, L. G. M. Pettersson, D. R. Reichman, P. Kim, M. S. Hybertsen and A. N. Pasupathy, Nano Lett., 2012, 12, 4025–4031 CrossRef CAS PubMed.
- T. Kondo, S. Casolo, T. Suzuki, T. Shikano, M. Sakurai, Y. Harada, M. Saito, M. Oshima, M. I. Trioni, G. F. Tantardini and J. Nakamura, Phys. Rev. B: Condens. Matter Mater. Phys., 2012, 86, 035436 CrossRef.
Footnote |
| † Electronic supplementary information (ESI) available. See DOI: 10.1039/c9ra07546a |
| This journal is © The Royal Society of Chemistry 2019 |

