 Open Access Article
Creative Commons Attribution 3.0 Unported Licence
A novel microwave dielectric ceramic Li2NiZrO4 with rock salt structure
Pengbo Jianga,
Yongda Hu *a,
Shengxiang Baoa,
Jie Chenb,
Zongzhi Duanb,
Tao Honga,
ChengHao Wua and
Gang Wanga
aUniversity of Electronic Science and Technology of China, Chengdu, 610054, China. E-mail: 3097213743@qq.com
bChengdu Yaguang Electronics Co. Ltd., Microwave Circuit & System Institute, Chengdu, 610054, China
First published on 15th October 2019
Abstract
Low loss Li2NiZrO4 ceramics with rock salt structure were successfully prepared by the solid-phase reaction method. The relationship between sintering temperature, phase composition and dielectric properties of Li2NiZrO4 ceramics was reported for the first time. The grain size gradually increased and the porosity decreased with the sintering temperature increasing. When the sintering temperature exceeds 1300 °C, the grains grow abnormally and some grains begin to melt. The XRD patterns indicated the second phase ZrO2 appeared due to the volatilization of lithium. The grains grow abnormally and a second phase of ZrO2 increased the loss of Li2NiZrO4 ceramics. The samples sintered at 1300 °C possessed the best dielectric properties: εr = 12.3, Qf = 20000 GHz, τf = −23.4 ppm °C−1, which would make the ceramic a possible candidate for millimeter-wave applications.
1. Introduction
Due to the rapid development of wireless communication systems, dielectric ceramics have been widely investigated as resonators, dielectric substrates and dielectric waveguide circuits in contemporary communications. It performs a significant function in millimeter wave communication as the substrate materials of microwave integrated circuits.1 To satisfy the demand of the fast-paced expansion of communications, these materials need to have a suitable dielectric constant to meet miniaturization of the device. In order to reduce the loss of the device at high frequencies, the quality factor is also required to be as large as possible.2 At the same time, in order to ensure temperature stability, a temperature coefficient of the resonance frequency close to zero is also required.3In recent years, it has been extensively indicated that the mixed Li2O-AO-BO2 (A = Mg, Zn and Ni; B = Ti, Zr and Sn) system is quite appropriate for microwave communication. Out of these microwave dielectric ceramics, The Li-containing Li2MgTiO4 ceramic is adopted as a perfect microwave dielectric material, which is an appropriate candidate for the component miniaturization and integration.4–6 Li2MgTiO4 with the microwave dielectric characteristics of εr = 15.07, Qf = 97629 GHz (at 8.2 GHz) and τf = 3.81 ppm °C−1 was reported by Pan et al.7 Additionally, Zhang et al. investigated the phase composition of (1 − x)Li2TiO3-xNiO (0 ≤ x ≤ 0.5) ceramics and obtained excellent microwave dielectric characteristics: εr = 19, Qf = 62252 GHz and τf = −1.65 ppm °C−1 for x = 0.2.8 The Li2ZrO3-AO ceramic system was investigated. Ma et al. indicated the impact of ZnO addition on the microwave dielectric characteristics of Li2ZrO3 ceramics and obtained microwave dielectric characteristics of 0.7Li2ZrO3-0.3ZnO ceramics: εr = 14.8, Qf = 26800 GHz and τf = 1 ppm °C−1.9 Bi et al. reported the microwave dielectric characteristics of Li2MgZrO4 ceramics: εr = 12.30, Qf = 40900 GHz, besides τf = −12.31 ppm °C−1 when it was sintered at 1175 °C for 4 h.10 Cheruku et al. synthesized Li2NiZrO4 materials with LiNO3, Ni(NO3)2·6H2O, ZrN2O7 and C6H6O7 by solution combustion technique in phase pure nanocrystalline form for the first time. They found the electrical relaxation is essentially non-Debye and temperature independent. This material exhibits considerable conductivity at room temperature and is a possible candidate for electrode material in solid-state batteries.11,12 Nevertheless, there have no report about the microwave dielectric characteristics of Li2NiZrO4 materials. In the present work, the sintering temperature, density as well as microwave dielectric properties of Li2NiZrO4 ceramics were investigated. Besides, the relationship existing between phase composition, sintering temperature, microstructure and microwave dielectric characteristics of Li2NiZrO4 ceramic was also investigated.
2. Experiment
The starting materials Li2CO3(99.99%, Aladdin), ZrO2(99.9%, Aladdin) and NiO (99.99%, Aladdin) were used to fabricate Li2NiZrO4 ceramic by solid state reaction methodology. First, the prepared powder is put into a nylon can and ball milled for 5 h with alcohol as the medium. Thereafter, the powder was dried and pre-sintered at 1050 °C for 4 hours. The calcined powder milling was carried out again for 7 h and followed by drying. In addition, the dried powder was mixed with polyvinyl alcohol for the purpose of forming a pellet. The pellets were pressed into a cylinder shape (diameter: 12 mm, thickness: 6 mm) under the pressure of 10 MPa. Eventually, the specimens were muffled with the same material powder and sintered at 1250–1350 °C for 5 h.The measurement of the density of the dielectric ceramic was carried out with the help of the Archimedes method. In addition, the testing for the phase formation was carried out by X-ray diffractometer (XRD) (Tongda TDM-20) with Cu-Kα radiation. The microstructure of the specimen was observed by scanning electron microscope (SEM) (AURA-100, Seron, South Korea). The measurement of the dielectric constant (εr) as well as quality factor (Qf) was carried out by network analyzer (E5061B, KEYSIGHT) on the basis of the Hakki–Coleman dielectric resonator methodology.13–15 The calculation of the temperature coefficient of resonant frequency (τf) is performed in accordance with the formula:
3. Results and discussion
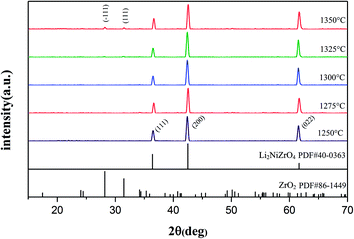
The XRD patterns of Li2NiZrO4 ceramics sintered between 1250–1350 °C are presented in Fig. 1. As seen, pure phase Li2NiZrO4 (PDF#40-0363) ceramics with rock salt structure was formed. When the sintering temperature reached 1325–1350 °C, the presence of the ZrO2 (PDF#86-1449) secondary phase is observed.16 Y. Iida et al. indicated the fact that the volatilization of lithium is obvious upon sintering at 1000 °C.17 This situation was also observed in LiMO3 (M = Nb, Ta) crystals.18–20 Therefore, it is taken into account that the volatilization of lithium gives rise to the formation of ZrO2 with the sintering temperature exceeding 1300 °C.10The SEM micrographs of Li2NiZrO4 sample sintered at different temperatures for 5 h are shown in Fig. 2. It is seen that the grain size of Li2NiZrO4 ceramics gradually increases as the sintering temperature is higher. A number of intergranular pores can be observed in the Fig. 2(a) and (b).With the sintering temperature growth, the grain size increased substantially and few pores are observed in Fig. 2(c). These pores are caused by lithium volatilizing. As the sintering temperature ranged from 1325 to 1350 °C, the grains showed abnormal growth. Moreover, some grains start melting, and a small amount of pores is still existed owing to the lithium volatilization.10,21,22
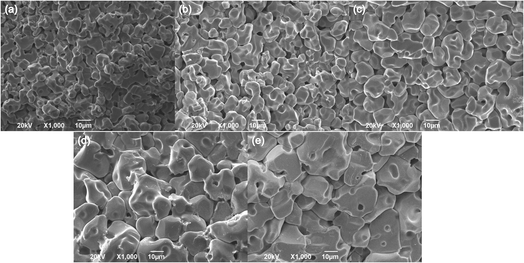 | ||
| Fig. 2 Fracture SEM images of Li2NiZrO4 ceramics with different sintering temperatures for 5 h (a–e corresponds to 1250 °C, 1275 °C, 1300 °C, 1325 °C and 1350 °C). | ||
Fig. 3 presents the variation of the apparent density as well as relative density of Li2NiZrO4 ceramics. With the sintering temperature increase from 1250 to 1325 °C, the apparent density increased from 4.32 to 4.57 g cm−3. When the sintering temperature was 1350 °C, the apparent density was 4.52 g cm−3. The theoretical density of Li2NiZrO4 crystal is 4.9 g cm−3. As the sintering temperature amounted to 1300 °C, the relative density was 92.8%. As the sintering temperature becomes higher, there is a gradual growth of the grain size, together with the pore declining, which is in appropriate relation to the variation in density.
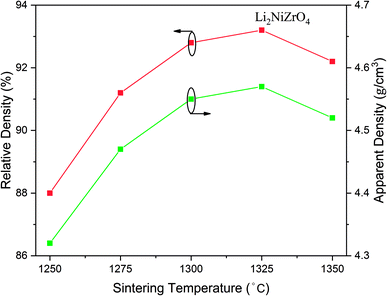 | ||
| Fig. 3 Apparent density and relative density of Li2NiZrO4 ceramics sintered at different temperatures for 5 h. | ||
The variation in dielectric constant of Li2NiZrO4 ceramics as a function of sintering temperature is given in Fig. 4. With the sintering temperature increasing from 1250 to 1300 °C, the εr value continuously increased. The variation in εr value was consistent with that in the apparent density. Ordinarily, many factors affect the dielectric constant, such as ionic polarizability, density and second phase.23 In the present work, the dielectric constant increases with increasing sintering temperature, which is related to relative density, polarizability and the second phase. The relationship between relative permittivity, polarizability and relative density can be described by Clausius–Mosotti equation (see eqn (1)).24
 | (1) |
| αtheo = 2α (Li+) + α (Ni2+) + α (Zr4+) + 4α (O2−) | (2) |
 | (3) |
 | (4) |
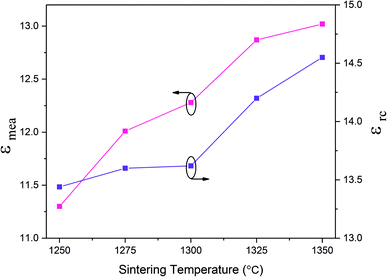 | ||
| Fig. 4 Measured permittivity (εmea) and porosity-corrected permittivity (εrc) of Li2NiZrO4 ceramics sintered at different temperatures for 5 h. | ||
In Fig. 5, the variations of the quality factor and temperature coefficient of the resonant frequency are presented. There is an increase in the Qf value from 16![[thin space (1/6-em)]](https://www.rsc.org/images/entities/char_2009.gif) 000 to 20
000 to 20![[thin space (1/6-em)]](https://www.rsc.org/images/entities/char_2009.gif) 000 GHz with the sintering temperature increasing from 1250 to 1300 °C. The Qf value reached the topmost value of 20
000 GHz with the sintering temperature increasing from 1250 to 1300 °C. The Qf value reached the topmost value of 20![[thin space (1/6-em)]](https://www.rsc.org/images/entities/char_2009.gif) 000 at 1300 °C. Nonetheless, the Qf value sharply declined with the sintering temperature ranging from 1325 to 1350 °C and the Qf value is merely 10
000 at 1300 °C. Nonetheless, the Qf value sharply declined with the sintering temperature ranging from 1325 to 1350 °C and the Qf value is merely 10![[thin space (1/6-em)]](https://www.rsc.org/images/entities/char_2009.gif) 200 GHz at 1350 °C. In general, dielectric loss can be divided into two categories. One component is a result of the bulk crystal phase, termed as intrinsic dielectric loss while the other component is termed as extrinsic dielectric loss, such as the grain boundaries, flaws and so on. With the sintering temperature increasing from 1250 to 1300 °C, there is an increase in the grain size as well as the apparent density, which shares a similarity with the variation of Qf value. When the sintering temperature kept rising, the abnormal grain growth and second phase precipitation led to the decline of Qf value.32 The trend of τf with the sintering temperature is also shown in Fig. 5. With the sintering temperature ranging from 1250 and 1350 °C, the τf value fluctuates between −22.29 and −25.92 ppm °C−1.
200 GHz at 1350 °C. In general, dielectric loss can be divided into two categories. One component is a result of the bulk crystal phase, termed as intrinsic dielectric loss while the other component is termed as extrinsic dielectric loss, such as the grain boundaries, flaws and so on. With the sintering temperature increasing from 1250 to 1300 °C, there is an increase in the grain size as well as the apparent density, which shares a similarity with the variation of Qf value. When the sintering temperature kept rising, the abnormal grain growth and second phase precipitation led to the decline of Qf value.32 The trend of τf with the sintering temperature is also shown in Fig. 5. With the sintering temperature ranging from 1250 and 1350 °C, the τf value fluctuates between −22.29 and −25.92 ppm °C−1.
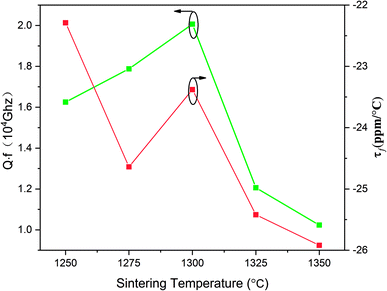 | ||
| Fig. 5 Quality factor (Qf) and temperature coefficient of the resonant frequency (τf) of Li2NiZrO4 ceramics sintered at different temperatures for 5 h. | ||
4. Conclusion
The Li2NiZrO4 ceramic was successfully prepared by solid-state reaction method. The phase composition, microstructure and microwave dielectric properties of Li2NiZrO4 ceramics were studied. With the sintering temperature exceeding 1300 °C, the ZrO2 second phase was formed owing to the lithium volatilization. The εr is dependent on second phases and density. The εr gradually increases as the density increases with the sintering temperature ranging 1250–1325 °C. When the sintering temperature reaching 1350 °C, the ZrO2 second phase possess a significant effect on the εr. The Qf value was primarily constrained by the microstructure and second phase. The samples sintered at 1300 °C showed the optimal dielectric characteristics: εr = 12.3, Qf = 20![[thin space (1/6-em)]](https://www.rsc.org/images/entities/char_2009.gif) 000 GHz, τf = −23.38 ppm °C−1 that made the ceramic promising for millimeter-wave applications.
000 GHz, τf = −23.38 ppm °C−1 that made the ceramic promising for millimeter-wave applications.
Conflicts of interest
There are no conflicts to declare.References
- Y. K. Yang, H. L. Pan and H. T. Wu, J. Electron. Mater., 2019, 48, 2712–2717 CrossRef CAS.
- G. Wang, H. W. Zhang, C. Liu, H. Su, L. J. Jia, J. Li, X. Huang and G. W. Gan, J. Electron. Mater., 2018, 47, 4672–4677 CrossRef CAS.
- M. T. Sebastian and H. Jantunen, Int. Mater. Rev., 2008, 53, 57–90 CrossRef CAS.
- H. Wu and E. Soo Kim, RSC Adv., 2016, 6, 47443–47453 RSC.
- J. Chang, Z. Liu, M. Ma and Y. Li, J. Eur. Ceram. Soc., 2017, 37, 3951–3957 CrossRef CAS.
- H. Zhou, X. Tan, J. Huang, K. Wang, W. Sun and X. Chen, J. Mater. Sci. Mater. Electron., 2017, 28, 6475–6480 CrossRef CAS.
- H. L. Pan, C. F. Xing, X. S. Jiang and H. T. Wu, J. Alloy. Comp., 2016, 688, 416–421 CrossRef CAS.
- J. Zhang and R. Zuo, J. Mater. Sci. Mater. Electron., 2016, 27, 7962–7968 CrossRef CAS.
- J. Ma, Z. Fu, P. Liu and X. Tang, J. Mater. Sci. Mater. Electron., 2016, 27, 232–236 CrossRef CAS.
- J. X. Bi, C. F. Xing, X. S. Jiang, C. H. Yang and H. T. Wu, Mater. Lett., 2016, 184, 269–272 CrossRef CAS.
- R. Cheruku, L. Vijayan and G. Govindaraj, Mater. Sci. Eng., B, 2012, 177, 771–779 CrossRef CAS.
- R. Cheruku, L. Vijayan and G. Govindaraj, AIP, 2011, 1349, 1013–1014 CAS.
- J. X. Bi, C. F. Xing, C. H. Yang and H. T. Wu, J. Eur. Ceram. Soc., 2018, 38, 3840–3846 CrossRef CAS.
- G. Wang, D. Zhang, F. Xu, X. Huang, Y. Yang, Y. Gan and L. Jin, Ceram. Int., 2019, 45, 10170–10175 CrossRef CAS.
- J. Iqbal, H. Liu, H. Hao, A. Ullah, M. Cao, Z. Yao and J. Iqbal, et al., J. Electron. Mater., 2018, 47, 7380–7385 CrossRef CAS.
- H. Yang, B. Tang, Z. Fang, J. Luo and S. Zhang, J. Am. Ceram. Soc., 2018, 101, 2202–2207 CrossRef CAS.
- Y. Iida, J. Am. Ceram. Soc., 1960, 43, 171–172 CrossRef CAS.
- V. V. Atuchin, Opt. Spectrosc., 1989, 67, 771–772 Search PubMed.
- V. V. Atuchin and T. Khasanov, Opt Spectrosc., 2009, 107, 212–216 CrossRef CAS.
- I. S. Steinberg, A. V. Kirpichnikov and V. V. Atuchin, Opt. Mater., 2018, 78, 253–258 CrossRef CAS.
- G. Kaur, K. Pubby, S. Bahel and S. B. Narang, Ceram. Int., 2018, 44, 20484–20489 CrossRef CAS.
- C. H. Yang, Q. Q. Liu, J. X. Bi, W. H. Tao and H. T. Wu, Ceram. Int., 2018, 44, 5982–5987 CrossRef CAS.
- Z. Zhou, H. Su and X. Tang, et al., Ceram. Int., 2016, 42, 11161–11164 CrossRef CAS.
- K. Maex, M. R. Baklanov, D. Shamiryan, F. Lacopi, S. H. Brongersma and Z. S. Yanovitskaya, J. Appl. Phys., 2003, 93, 8793–8841 CrossRef CAS.
- R. D. Shannon and G. R. Rossman, Am. Mineral., 1992, 77, 94–100 CAS.
- S. J. Penn, N. M. Alford, A. Templeton, X. Wang, M. Xu and M. Reece, et al., J. Am. Ceram. Soc., 1997, 80, 1885–1888 CrossRef CAS.
- R. D. Shannon, J. Appl. Phys., 1993, 73, 348–366 CrossRef CAS.
- C. L. Huang, W. R. Yang and P. C. Yu, J. Eur. Ceram. Soc., 2014, 34, 277–284 CrossRef CAS.
- Y. Oh, V. Bharambe and B. Mummareddy, et al., Addit. Manuf., 2019, 27, 586–594 CrossRef CAS.
- G. Wang, H. Zhang, X. Huang, F. Xu, G. Gan, Y. Yang and L. Jin, Ceram. Int., 2018, 44, 20539–20544 CrossRef CAS.
- G. Wang, H. W. Zhang, C. Liu, H. Su, J. Li, X. Huang, G. W. Gan and F. Xu, Mater. Lett., 2018, 217, 48–51 CrossRef CAS.
- M. Du, L. Li, S. Yu, Z. Sun and J. Qiao, J. Am. Ceram. Soc., 2018, 101, 4066–4075 CrossRef CAS.
| This journal is © The Royal Society of Chemistry 2019 |


