
 Open Access Article
 This Open Access Article is licensed under a Creative Commons Attribution-Non Commercial 3.0 Unported Licence
DNA/lysozyme binding propensity and nuclease properties of benzimidazole/2,2′-bipyridine based binuclear ternary transition metal complexes†
Ahmed M.
Mansour
 * and
Mona S.
Ragab
* and
Mona S.
Ragab
Department of Chemistry, Faculty of Science, Cairo University, Gamma Street, Giza, Cairo 12613, Egypt. E-mail: mansour@sci.cu.edu.eg
First published on 30th September 2019
Abstract
In the present contribution, new binuclear ternary complexes; [M2(bpy)4L](ClO4)4 (M = Co(II) (1) and Ni(II) (2); bpy = 2,2′-bipyridine; L = 1,1′-(hexane-1,6-diyl)bis[2-(pyridin-2-yl)1H-benzimidazole] and [Cu2(bpy)2(OH2)2L](BF4)4 (3) were synthesized, characterized and screened for their antimicrobial activity and cytotoxicity against human liver carcinoma cells (HepG-2) as well as non-malignant human embryonic kidney cells (HEK-293). The structural studies were complemented by density functional theory (DFT) calculations. DNA binding of 1–3 was spectrophotometrically studied. The DNA cleavage ability of 1–3 towards the supercoiled plasmid DNA (pBR322 DNA) was examined through gel electrophoresis. Compound 3 has the highest cytotoxic activity (IC50 = 3.5 μg mL−1) against HepG-2 among the investigated complexes and is non cytotoxic to noncancerous HEK-293. Complexes (1 and 2) exhibited toxicity to HEK-293 with IC50 values of 30.3 and 23.5 μg mL−1 in that order. While compound 1 showed antifungal activity against Cryptococcus neoformans, complex 2 exhibited its toxicity against Candida albicans.
Introduction
DNA and proteins are the chief molecular targets to design suitable structures of metal-based drugs to exercise their effect against various common diseases.1 Chemotherapeutic drugs based on coordination compounds2 play a significant role in the control of the growth of the malignant cells. The cytotoxicity of the metal complexes arises normally from both metal ion and ligand system. First row transition metal complexes received attention because of their interesting promising cytotoxicity against the malignant cells. For example, a family of copper(II) complexes known as CasiopeìnasR had reached clinical trials.3 Alternatively, the nitrogen containing heterocyclic ligands such as benzimidazole, bipyridine, terpyridine, phenanthroline, etc. and their coordination compounds were investigated for recognition of DNA,4 and proteins5 and were investigated as mimic models for the biological systems.6 Planar heterocyclic moieties can be stacked between the double helix base pairs of DNA and thus used as intercalators.7 It is noteworthy that binuclear metal complexes have greater tendency to interact with DNA/RNA than the mononuclear analogues.8–10 For example, the binuclear Cu(II) complexes based on terpyridine and bipyridine cleaved the 2,3-cyclic ribonucleotide monophosphates faster than the mononuclear analogues.10 Based on benzimidazole moiety, Co(II) complex of N,N,N′,N′-tetrakis(2-benzimidazolylmethyl)-2-hydroxyl-1,3-diaminopropane) was introduced as synthetic nucleases.11 Bridged binuclear complexes of the type [Cu2(hmdoxd)(H2O)(bpy4Me)](ClO4)·DMF and [Cu2(hmdoxd)(bpy)](ClO4)·CH3OH (H3hmdoxd = N-(2-hydroxy-5-methylphenyl))-N′-[2-(dimethyl amino)ethyl]oxamide and bpy4Me = 4,4′-dimethyl-2,2′-bipyridine) displayed higher anticancer activity against HepG-2 than cisplatin suggesting the essential to extend the focus on metal ions other than the noble transition metal ions.12a Mononuclear Ru(II) ternary complexes, bearing two bpy molecules and showing moderate activity on the cell proliferation in A549, HepG-2, SGC-7901 and HeLa cells, have been recently reported by Jiang.12b,12cIn the present work, we report synthesis and structural characterization of new binuclear ternary Co(II), Ni(II) and Cu(II) complexes bearing 1,1′-(hexane-1,6-diyl)bis[2-(pyridin-2-yl)]1H-benzimidazole as a primary ligand and 2,2′-bipyridine as a secondary ligand (Scheme 1). Local minimum structures were determined by density functional theory (DFT) calculations. Natural population analyses were performed to get some information about the natural charge of the metal ion after complexation, type of hybridization and strength of interactions between the coordination sites and the metal centre. Prior to study the DNA binding affinity of the complexes by UV-vis. method, time dependent DFT calculations were done to assign the observed electronic transitions. The susceptibility of some illustrative microbes towards 1–3 was evaluated by standard broth microdilution assay.13 Calf thymus DNA binding of the complexes was studied. Agarose gel electrophoresis was used to monitor the cleavage reaction of the complexes on the plasmid pBR322 DNA. On the other hand, the nature and magnitude of the drug–protein interactions may give some information about the absorption, excretion, and metabolism of typical drug,14 which are critical parameters to develop new therapeutic agent. For this propose, hen white egg lysozyme, a model protein, was used to investigate the protein affinity of the complexes. The complexes were evaluated for their potential cytotoxic activity against human Hepatocellular carcinoma cells (HepG-2) and noncancerous human embryonic kidney cells (HEK-293).
 | ||
| Scheme 1 Synthesis of Co(II), Ni(II) and Cu(II) binuclear ternary complexes. | ||
Results and discussion
Synthesis and structural characterization
The benzimidazole ligand L was prepared by deprotonation of 2-(2′-pyridyl)benzimidazole with NaH in dimethylformamide and treated the sodium salt solution with 1,6-dibromo hexane (Fig. S1†).15 The binuclear ternary complexes 1–3 were synthesized by refluxing L and the appropriate metal salts in acetone for 3 h. Then, 2,2′-bipyridine was added to the reaction mixture and the reflux was continued for 12 h. Solvent was removed, and the precipitates were washed with water, diethyl ether and dried. The complexes were characterized by elemental analysis, thermal analysis, IR (Figure S2†), ESI-MS (Fig. S3†), UV/vis., magnetic and conductance measurements. The obtained data support the following formula; [M2(bpy)4L](ClO4)4 (M = Co(II) (1) and Ni(II) (2)) and [Cu2(bpy)2(OH2)2L](BF4)4 (3) (Scheme 1). Compared to the conductance values reported for 1![[thin space (1/6-em)]](https://www.rsc.org/images/entities/char_2009.gif) :1 (65–90 Ω−1 cm2 mol−1) and 1:2 (130–170 Ω−1 cm2 mol−1) electrolytes in DMF,16 the conductance values of the DMF solutions of 1–3 are 280, 295 and 306 Ω−1 cm2 mol−1 reflecting the 1:4 electrolytic nature. The ESI-MS spectrum of 1 shows two characteristic peaks for the suggested formula of 1 at m/z 1256.2743 {[M2(bpy)3L](ClO4)}2+ and 1201.0764 {[M2(bpy)2L](ClO4)3}+. For 2, two peaks are observed at m/z 1215.4662 and 1199.1074 assigned to {[M2(bpy)4L] + H}4+ and {[M2(bpy)2L](ClO4)3}+, respectively. The ESI-MS spectrum of 3 displays a unique peak at m/z 967.2775 corresponding to {[Cu2(bpy)2(OH2)L]}+. The IR spectra of the metal complexes (Fig. S1†) were compared with those of free primary (L) and secondary (bpy) ligands. The ν(CN/CC) mode of L (1586 cm−1)15 moves to lower wavenumber values by complexation to metal ion, 1568–1572 cm−1. Observation of the ν(CN/CC) mode of bpy in the range of 1601–1605 cm−1 of the IR spectra of 1–3 supports the coordination of bpy to metal ion.17
:1 (65–90 Ω−1 cm2 mol−1) and 1:2 (130–170 Ω−1 cm2 mol−1) electrolytes in DMF,16 the conductance values of the DMF solutions of 1–3 are 280, 295 and 306 Ω−1 cm2 mol−1 reflecting the 1:4 electrolytic nature. The ESI-MS spectrum of 1 shows two characteristic peaks for the suggested formula of 1 at m/z 1256.2743 {[M2(bpy)3L](ClO4)}2+ and 1201.0764 {[M2(bpy)2L](ClO4)3}+. For 2, two peaks are observed at m/z 1215.4662 and 1199.1074 assigned to {[M2(bpy)4L] + H}4+ and {[M2(bpy)2L](ClO4)3}+, respectively. The ESI-MS spectrum of 3 displays a unique peak at m/z 967.2775 corresponding to {[Cu2(bpy)2(OH2)L]}+. The IR spectra of the metal complexes (Fig. S1†) were compared with those of free primary (L) and secondary (bpy) ligands. The ν(CN/CC) mode of L (1586 cm−1)15 moves to lower wavenumber values by complexation to metal ion, 1568–1572 cm−1. Observation of the ν(CN/CC) mode of bpy in the range of 1601–1605 cm−1 of the IR spectra of 1–3 supports the coordination of bpy to metal ion.17
The electronic absorption spectra of the metal complexes were recorded in DMF (Fig. S2†). Three spin allowed d → d transitions; 4T1g → 4T2g(F) (ν1), 4T1g → 2A2g (ν2) and 4T1g → 4T2g(P) (ν3) are expected to observe in high spin octahedral Co(II) complexes.18 The absorption electronic spectrum of 1 shows the intra-ligand transitions bands at 314 and 303 nm as well as a shoulder at 495 nm corresponding to MLCT.19 The effective magnetic moment (μeff) of 4.15 μB, per metal ion, for the homo binuclear Co(II) complex 1 suggests the absence of the intramolecular magnetic coupling between the Co(II) centres.20 In six coordinates octahedral Ni(II) complexes, 3A2g is the ground term with three expected allowed d → d transitions namely; 3A2g → 3T2g (ν1), 3A2g → 3T1g(F) (ν2), and 3A2g → 3T1g(P) (ν3).21 The absorption spectrum of 2 (Fig. S4†) is composed of six transitions at 875, 784, 533, 326, 310 and 299 nm. The weak bands at 875 and 784 nm may be assigned to 3A2g → 3T2g (ν1) and the spin forbidden 3A2g → 1Eg. The shoulder at 533 nm is ascribed to 3A2g → 3T1g(F) (ν2). Like 1, the intra-ligand transitions of 2 are observed at 310 and 299 nm. The μeff value of 2 is 2.90 μB, per metal ion. The complete separation between the Ni(II) ions induces no magnetic exchange interactions between the paramagnetic ions that might be arise from the direct interaction and/or the super exchange. The electronic spectrum (Fig. S4†) of Cu(II) complex showed four transitions at 700, 439, 313 and 287 nm. The broad band at 700 nm is assigned to dz2 → dx2−y2, and dxy → dx2−y2 in a distorted square-pyramidal geometry.22 The shoulder at 439 nm may be assigned to LMCT from the π-systems of bpy and L to the vacant orbitals localized on the coordinated copper(II) ion.23 The highest energy transitions in the UV range are allocated to the intra-ligand transitions.24 The μeff of 3 is 1.76 μB, per metal ion, revealing the lack of the magnetic coupling between the metal centres.
TG analysis
The thermogravimetric analysis (Fig. S5†) of 1–3 was investigated in nitrogen atmosphere using platinum crucible from the ambient temperature up to 1000 °C. The TG curve of 1 is composed of four decomposition steps maximally at 70, 311, 367 and 575 °C. In the temperature range of 40–100 °C, a mass loss (calcd, 1.10%, observed 1.00%) corresponding to dehydration of one water molecule is observed. The final step brings the total mass loss up to 88.99% (calcd 90.90%) of the parent complex; the metal residue may be assigned to CoO. For 2, the first thermal stage, in the temperature range of 50–100 °C, is accompanied by loss of four hydrated water molecules (calcd, 4.29%, observed 4.00%). Complex 2 is hardly to thermally decomposed in nitrogen atmosphere with total mass loss of 79.5% at 1000 °C.24 No plateau was noted in the TG curve of 2 although the thermal decomposition continued until 1000 °C, which reflected its high thermal stability in nitrogen atmosphere.25,26 Five complicated thermal decomposition steps were reported in the TG curve of 3 at 189, 213, 243, 258 and 396 °C with overall mass loss of 91.23% of the parent complex. The first stage may be assigned to elimination of two coordinated water molecules (calcd, 2.78%, observed 2.80%). The final residue, at 1000 °C, might be considered as metallic copper (calcd 9.80%, observed 8.76%).DFT/natural bond orbital (NBO) analysis
Ground state geometry optimization was performed on a model representing the mononuclear structural analogues of 1–3 having the formula of [M(bpy)2LETPY] (M = Co(II) and Ni(II)) and [Cu(OH2)(bpy)LETPY] (LETPY = 1-ethyl-2-(2′-pyridylbenzimidazole)) at B3LYP/LANL2DZ level of theory (Fig. 1). Selected optimized bond distances and angles are given in Table S1.† The coordination sphere around Co(II) ion in a model complex could be described as a distorted octahedral geometry, formed from bidentate LETPY and two bipyridine ligands. The distortion is attributed to the elongation of the axial Co–N bonds (Co–N(1) = 2.277 Å and Co–N(69) = 2.222 Å) with respect to the equatorial bonds (1.991–2.005 Å). Like 1, the axial bonds of 2 (Ni–N(1) = 3.165 Å and Ni–N(69) = 2.377 Å) in the octahedral geometry are longer than the metal bonds in the plane of the octahedral (1.928–1.974 Å). According to the natural population analyses27 the electronic configurations of Co(II) and Ni(II) ions in the mononuclear analogues of 1 and 2 are [Ar]4s0.223d7.674p0.44 4d0.015p0.01 and [Ar]4s0.253d8.674p0.385p0.01. Their 3d orbitals are occupied by the electrons as follows: dxy1.721dxz1.722 dyz1.349 dx2−y21.375 dz21.506 and dxy1.900dxz1.918 dyz1.470 dx2−y21.631 dz21.747. The natural charge of Co(II) and Ni(II) ion is reduced from +2 to +0.661 e and +0.70331 e, respectively, because of the electron density donation from the coordination sites to the metal ion. The calculation of Mulliken atomic charge plays an important role in the application of coordination compounds. Table S2† including the values of the Mulliken charge of nitrogen sites and metal ion is given in the ESI.† The atomic charges of Co(II) and Ni(II) in the mononuclear model structures are +0.430933 and +0.464320. Interestingly, the total charges of the nitrogen atoms on each ligand system (L or bpy) is nearly the same. The strength of the interactions between M(II) and coordination sites could be deduced from E2 values (the second order interaction energy between donor–acceptor orbitals in the complexes).28 The E2 values are 0.22, 0.20, 0.20, 0.19, 0.10, 0.10 kcal mol−1 for LP(1)N(68) → RY*(1)Co, LP(1)N(2) → RY*(1)Co, LP(1)N(67) → RY*(1)Co, LP(1)N(70) → RY*(1)Co, LP(1)N(1) → RY*(1)Co and LP(1)N(69) → RY*(1)Co, respectively. For 2, the E2 values are 0.54, 0.53, 0.50, 0.40, 0.29 and 0.04 kcal mol−1 for LP(1)N(68) → RY*(1)Ni, LP(1)N(2)→ RY*(2)Ni, LP(1)N(70) → RY*(1)Ni, LP(1)N(67) → RY*(1)Ni, σ(C(32)–N(69)) → RY*(1)Ni and σ(C(11)–N(1)) → RY*(1)Ni, in that order. In comparison, the bipyridine moieties interact strongly with Ni(II) than Co(II) ion.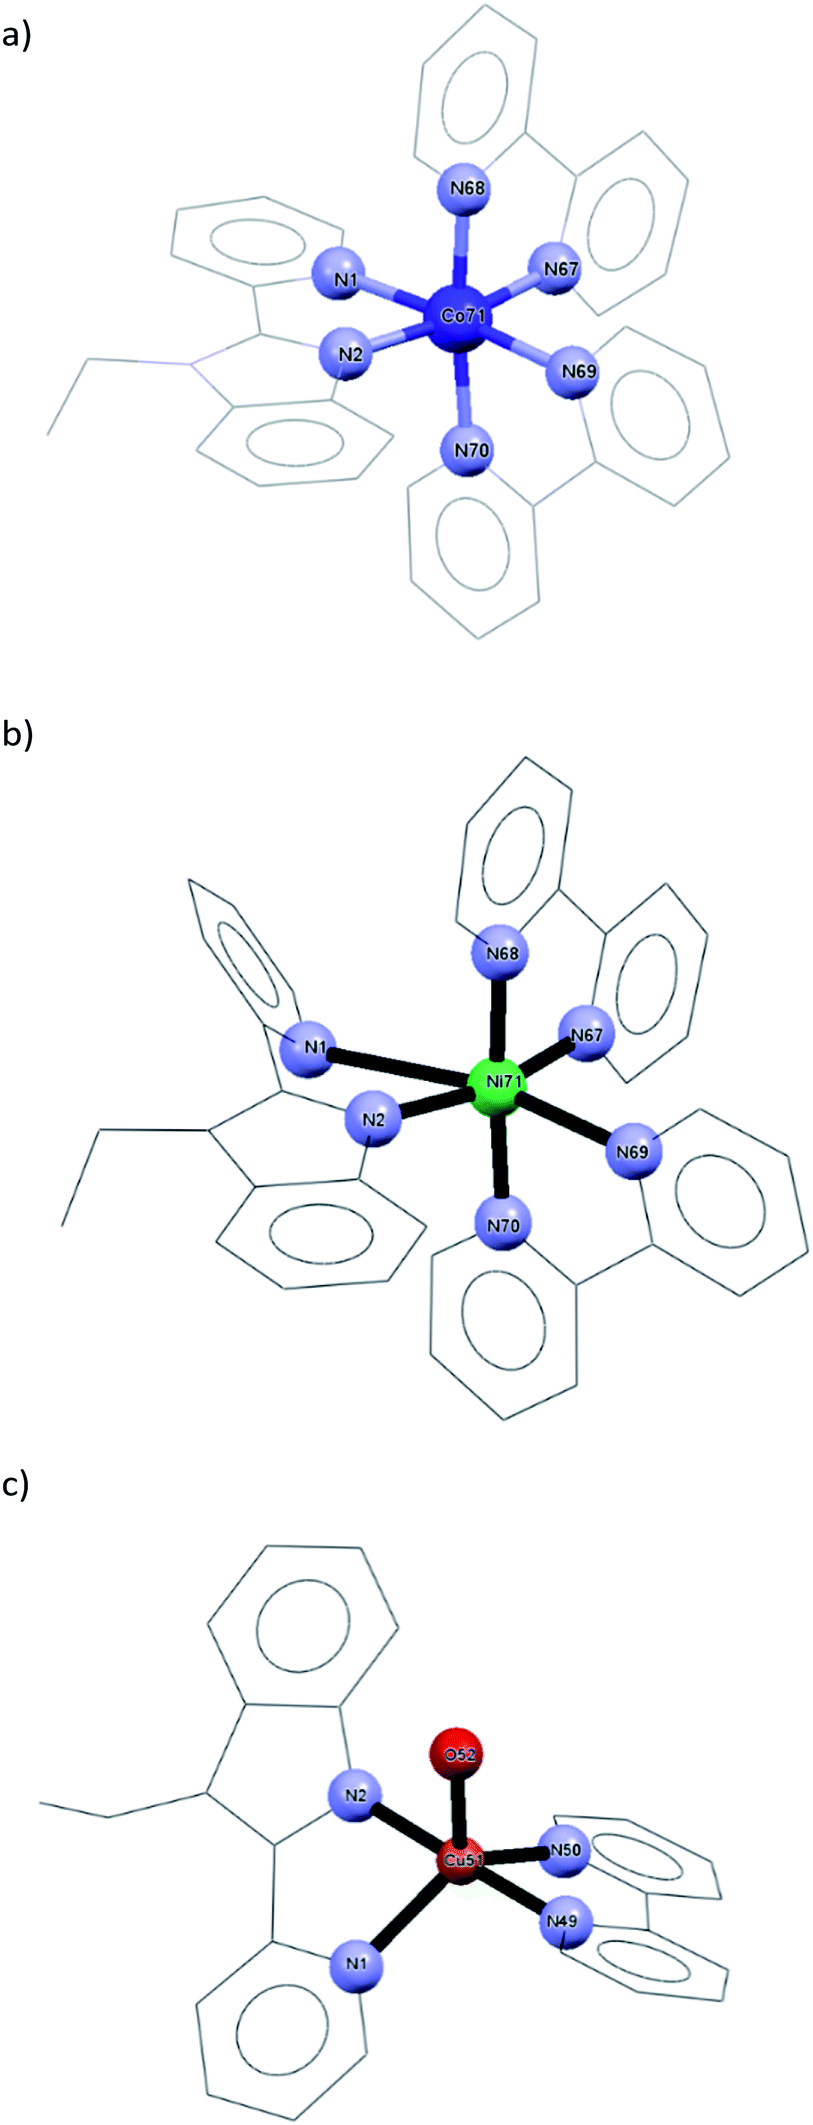 | ||
| Fig. 1 Local minimum structures of the model representing the mononuclear structural analogues of (a) 1, (b) 2 and (c) 3 calculated at B3LYP/LANL2DZ level of theory (hydrogen atoms were omitted for clarity). | ||
The square pyramidal geometry around Cu(II) ion is formed from N,N-bidentate LETPY (Cu–N(1) = 2.132 Å and Cu–N(2) = 1.973 Å), bipyridine [Cu–N(49) = 2.005 Å and Cu–N(50) = 2.079 Å] as well as one water molecule [Cu–O(52) = 2.191 Å]. The optimized bond lengths compare well with the crystal data of the previously published [Cu(TBZ)(phen)Cl]Cl·H2O (TBZ = 2-(4′-thiazolyl)benzimidazole, phen = 1,10-phenanthroline).29 According to the natural population analyses, the electronic arrangement of copper is [Ar]4s0.27 3d9.32 4p0.38 and its natural charge is +0.20396 e. The 3d populations are dxy1.823 dxz1.962 dyz1.992 dx2−y21.634 dz21.911. The Mulliken charge of Cu is +0.711931 and the highest negative charge on the coordination site is on oxygen atom (O(52) = −0.713220 e). In comparison, the Mulliken charges on N atoms of L system (N(1) = −0.269480 e and N(2) = −0.380299 e) are higher than the corresponding atoms in 1 [N(1) = −0.155821 e and N(2) = −0.281633 e] and 2 [N(1) = −0.100372 e and N(2) = −0.343720 e]. The E2 values are 2.17, 1.87, 0.97, 0.71 and 0.36 kcal mol−1 for LP(1)N(2)→RY*(2)Cu, LP(1)N(49)→RY*(2)Cu, LP(1)N(50)→RY*(2)Cu, LP(1)N(1)→ RY*(2)Cu and LP(2)O(52)→RY*(2)Cu, respectively. Because the steric hindrance around Cu(II) is lower than those of 1 and 2, the bipyridine interacts strongly with higher E2 values.
TDDFT calculations
The theoretical UV-vis spectra (Fig. S6†) of the mononuclear structural analogues of 1–3 and their assignments were obtained by CAM-B3LYP/LANL2DZ method. The spectrum of 1 showed five main transitions at 659, 647, 390, 364 and 292 nm corresponding to HOMO − 2(β) → LUMO + 16(β), HOMO − 3(β) → LUMO + 16(β), HOMO(α) → LUMO + 1(α), HOMO(α) → LUMO(α)/LUMO + 2(α) and HUMO − 3(β) → LUMO(β) transitions, respectively. The descriptions of selected Frontier molecular orbitals of 1–3 are given in the ESI (Fig. S7–9†). The band at 659 nm has a ground-state composed of π-system of the benzimidazole ligand and an excited state of d(Co)/π*(bpy) forming LLCT/LMCT. Three bands at 689, 329 and 280 nm, corresponding to HOMO − 5(α) → LUMO + 3(α), HOMO(α) → LUMO(α) and HUMO − 4(α) → LUMO(α), were observed in the calculated spectrum of 2. As shown in Fig. 2, the band at 689 nm may be assigned to LLCT/MLCT. Complex 3 has three main calculated transitions at 847, 280 and 241 nm with oscillator strength values of 0.004, 0.0002 and 0.0023 due to HOMO − 3(β) → LUMO(β), HOMO − 2(α) → LUMO + 4(α)/HOMO − 2(β) → LUMO + 5(β) and HOMO(α) → LUMO(α) in that order. As shown in Fig. 2, the LUMO orbital has Cu(dx2−y2) character with a minor contribution from the π-bonding of bpy systems. HOMO–3 is contained mainly upon Cu(dz2). Thus, the band at 847 nm is d → d transition. The highest energy transitions are allocated for π–π* within the bpy ligands. | ||
| Fig. 2 TD-DFT/B3LYP/LANL2DZ calculated electronic absorption transitions (1000–600 nm) and selected FMO orbitals of mononuclear analogues of 1–3. | ||
In vitro antimicrobial assay
The susceptibility of some representative microbes towards the synthesized binuclear ternary complexes was evaluated using two fungi (Cryptococcus neoformans and Candida albicans), Gram-positive bacterium (Staphylococcus aureus) as well as four Gram-negative bacteria (Pseudomonas aeruginosa, Klebsiella pneumoniae, Escherichia coli, and Acinetobacter baumannii). Primary screening was done at 32 μg mL−1. Compound 1 exhibited a promising inhibitory effect on the growth of Cryptococcus neoformans, while complex 2 had an interesting antifungal activity against Candida albicans. On the other hand, copper(II) complex was the least potent effective compound against the tested strains.DNA binding mode investigation
Information about the affinity of biologically active compounds towards DNA and their binding modes may give an idea about the ability to damage DNA and consequently inhibiting the growth of the microbial cell. The binding may be happened through either covalent and/or noncovalent interaction(s) (electrostatic, groove and intercalation).30,31 The strength of DNA interaction can be evaluated by determining the intrinsic binding constant (Kb).32 Compounds bearing heterocyclic moiety e.g. bipyridine, and phenanthroline may interact with DNA via the intercalative mode,33,34 which could be assigned and followed by change of the main absorption electronic band of the intercalators. Normally, hypochromic shift of the charge transfer band is the main feature observed in the DNA titration plot.35 The electronic spectral changes upon the addition of successive quantities of calf thymus DNA to solutions of 1–3 are shown in Fig. 3. The hypochromism shift observed in the DNA titration plots of 1–3 suggests intercalative mode of interaction. For 1, the hypochromism shift is accompanied by 2 nm blue shift of the main bands. The percentage of the hypochromism is 79.8%, 51.5% and 29.9%, for 1–3 in that order. Besides, an isosbestic point is monitored at 289 nm (Fig. 2b) during the addition of DNA to nickel complex (2). The Kb values of 1–3 were determined according to the following equation;36 [DNA]/(εa − εf) = [DNA]/(εb − εf) + 1/[Kb(εb − εf)], where [DNA] is the concentration of the DNA, εa is the extinction coefficient of the free complex, εf and εb are the extinction coefficients of the free and fully bound complexes to DNA in solution, respectively. Plotting [DNA]/(εa − εf) versus [DNA] yields Kb (Kb = slope/intercept). The Kb values are 1.8 × 10⁶ (1), 3.6 × 10⁵ (2) and 5.3 × 10⁴ (3). In comparison, the Kb of Co(II) complex is 5 times higher than its Ni(II) analogue. Changing the type of metal ion from Co(II) to Cu(II) and stereochemistry from octahedral to square pyramidal induces a decrease in the Kb by 34 times.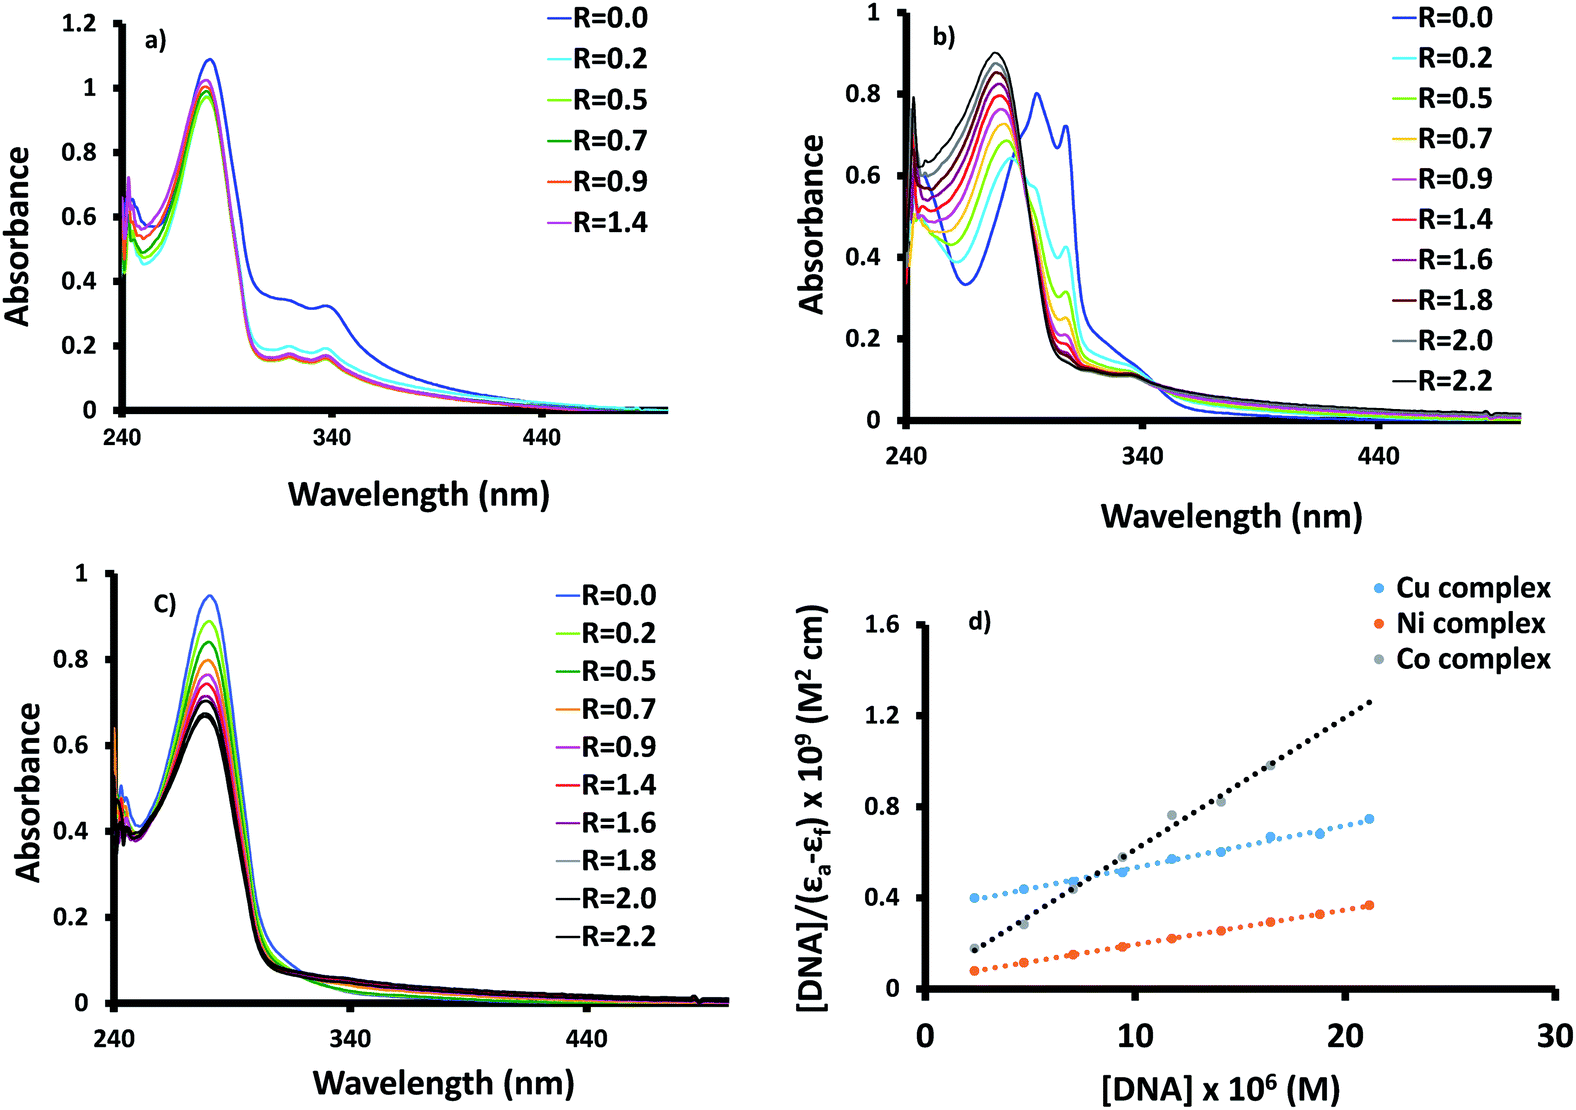 | ||
| Fig. 3 Absorption spectra of complexes (a) 1, (b) 2, and (c) 3 in Tris-buffer (20% DMSO) in absence (R = 0.0) and presence (R > 0.0) of increasing amounts of CT-DNA (R = [DNA]/[complex] and [complex] = 1 × 10⁻⁵ M) and (d) Plots of [DNA]/(εa − εf) vs. [DNA] for the titration of DNA with complexes. | ||
Lysozyme affinity
The HEWL scaffold, a relatively small globular protein, is particularly suitable to probe the fundamental interactions of proteins with metal complexes. It was reported that HEWL has tendency to interact with different metal ions e.g. Fe(II), Mn(II), Cu(II), Co(II), Ni(II), Ag(II), Au(II), Re(II), Pt(II), Ru(II) and some of their complexes,37 and can be used as a biocompatible carrier to deliver the biologically active compounds into tissues and cells. The existence of the selectively active His15 coordination site at the surface of HEWL facilitates its binding to metal complexes.38 The protein interaction may change the toxicity and biodistribution of drugs. Here, the interaction of HEWL with 1–3 was followed by recording the electronic spectral changes by adding successive amounts of HEWL to solutions of the complexes. The lysozyme affinity towards 1–3 and strength of interactions were investigated by determining the Kb constant. The HEWL titration plots of 1–3 are shown in Fig. 4. The Kb values are 1.32 × 10⁶ (1), 7.3 × 10⁵ (2) and 7.9 × 10³ (3). Therefore, lysozyme has higher binding to Co(II) complexes than the other synthesized complexes that compares well with the DNA binding studies. The protein Kb value of 1 is about two times higher than 2. Therefore, Co(II) complex has higher affinity to DNA and HEWL than its Ni(II) analogue. | ||
| Fig. 4 Absorption spectra of complexes 2 (up) and 3 (down) in Tris-buffer (20% DMSO) in absence (R = 0.0) and presence (R > 0.0) of increasing amounts of HEWL (R = [HEWL]/[complex] and [complex] = 1 × 10⁻⁵ M). | ||
Chemical nuclease activity
DNA cleavage ability of complexes 1–3 was investigated by gel electrophoresis using pBR322 plasmid DNA. The cleavage efficiency was measured by determining the ability of 1–3 to convert the naturally occurring supercoiled DNA (SC) to open circular relaxed (OC) form, which is formed when one of the strands is nicked. If both strands of the plasmid DNA are nicked, the linear (L) form will be generated.39 Along the agarose, the migration speeds of the three cleavage DNA forms are different; SC is faster than L and OC.40 As shown in Fig. 5a, the chemical nuclease activities of 1–3 towards the supercoiled pBR322 DNA were presented by gel electrophoresis after incubation of (0.4 μg) plasmid DNA with (10 μM) of each complex. The control supercoiled plasmid DNA in lane 1 showed only two forms (SC and NC). All complexes afforded a pronounced DNA cleavage evidenced by the disappearance of SC band (Form I) of plasmid on the expense of the appearance of NC (Form II) and L (Form III). As shown in Fig. 5, compounds 1 (lane 3) and 3 (lane 2) have almost the same cleaving ability. The more pronounced cleaving ability was observed by use complex 2 because of the extensive degradation of the supercoiled DNA (100% cleavage) and subsequently complete disappearance of all forms on agarose gel in lane 4.41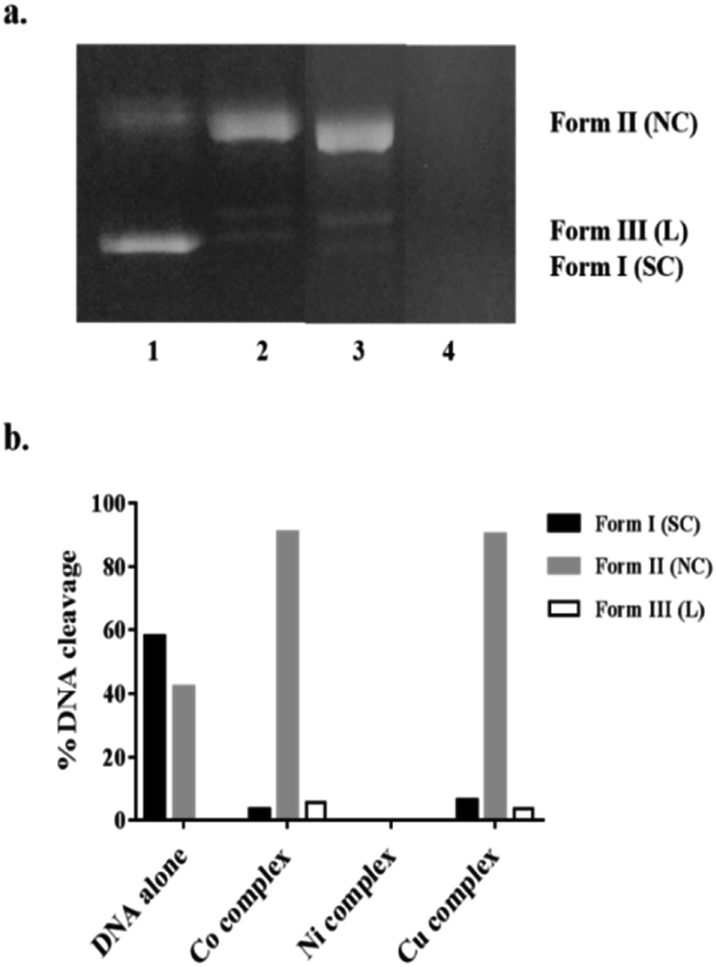 | ||
| Fig. 5 (a) Agarose gel electrophoresis pattern showing cleavage of pBR322 plasmid DNA (0.4 μg) incubated with complexes in Tris–HCl/NaCl buffer (pH 7.1) at 37 °C for 12 h (Lane 1: DNA control; Lane 2: DNA + 3; Lane 3: DNA + 1; Lane 4: DNA + 2). (b) Histogram showing the % DNA cleavage products for each complex. | ||
Cell viability assay
In vitro cytotoxic assay against human Hepatocellular carcinoma cell line (HepG-2 cells) as well as noncancerous HEK-293 was performed with the aid of MTT dye assay. The cytotoxic activity of 1–3 against HepG-2 cells is found to be in the following order 3 > 1 > 2. The binuclear ternary complexes 1–3 showed survival reduction to 50% at the following concentrations with IC50 values of 19.4, 32.5 and 3.5 μg mL−1 (Fig. 6). On the other hand, complex 3 exhibited excellent cell viability towards the noncancerous HEK-293. Compounds (1 and 2) exhibited cytotoxicity to HEK-293 with IC50 values of 30.3 and 23.5 μg mL−1 in that order. It is worthy to mention that the trend of DNA intercalation ability of the complexes discussed earlier was reversed in case of the MTT assay. This means that the cytotoxicity is not controlled with the DNA binding since there are many DNA intercalators, which are not able to work as cytotoxic agents.42 In other words, the cytotoxicity cannot be simply related to the binding to DNA.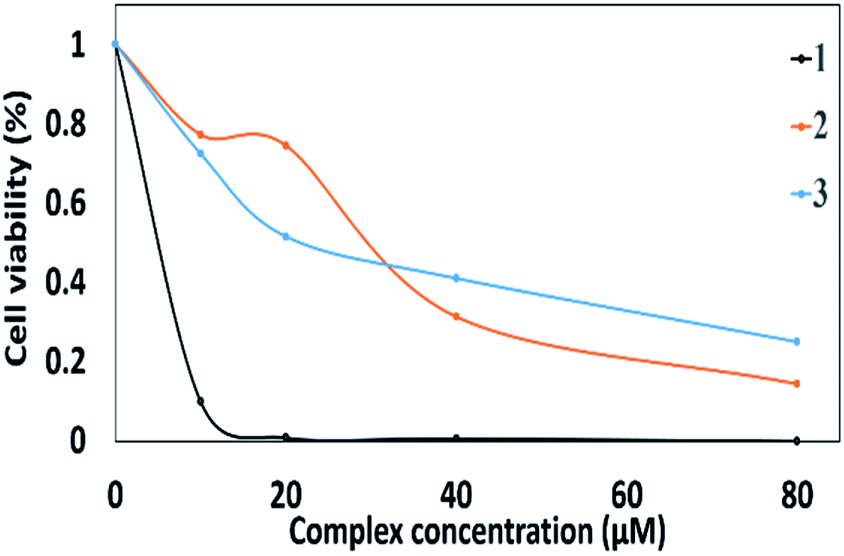 | ||
| Fig. 6 Cellular growth inhibition studied complexes against hepatocellular carcinoma (HepG2). The cell viability was measured by MTT assay after incubation 24 hours. | ||
Conclusions
In the present work, three new binuclear ternary Co(II), Ni(II) and Cu(II) complexes, bearing benzimidazole derivative as a primary ligand and bipyridine as a secondary ligand, were synthesized and characterized using different physicochemical tools. Prior to DNA and protein binding studies, the electronic structures of the complexes were investigated by doing some time dependent density functional theory calculations. The binding affinity of the complexes to calf thymus DNA followed the order Co(II) > Ni(II) > Cu(II). The hypochromism shift, observed in the DNA titration plot, suggested an intercalative mode of binding. In addition, hen egg white lysozyme, a model protein, exhibited high affinity towards Co(II) complex with respect to the other complexes. Co(II) complex exhibited higher affinity to DNA and lysozyme than its Ni(II) analogue. The metal complexes afforded a chemical nuclease activity towards pBR322 plasmid DNA; Ni(II) compound exhibited the maximum nuclease activity, while the Co(II) and Cu(II) complexes showed approximately the same behaviour. The complexes induced an obvious cytotoxic activity against HepG-2 cells. The cytotoxic activity of 1–3 against HepG-2 cells is found to be in the following order Cu(II) (3.5 μg mL−1) > Co(II) (19.4 μg mL−1) > Ni(II) (32.5 μg mL−1). Copper(II) complex had the highest inhibitory action on the proliferation on the cancer cell at low concentration with no cytotoxic effect to the normal human cell (HEK-293). The lack of correlation between the DNA/HEWL binding affinities and the cytotoxic IC50 values supports the idea that the mechanism of action is other than direct interaction with the DNA/protein. The Co(II) and Ni(II) complexes had an interesting antifungal activity against Cryptococcus neoformans and Candida albicans respectively, while Cu(II) complex showed no toxicity against all the tested strains. Based on the interesting inhibitory results, some preclinical evaluations for our synthesized complexes are highly recommended.Experimental
Materials and instruments
The benzimidazole ligand (L) was synthesized by following the previously published procedure.15 The transition metal salts [Co(ClO4)2·6H2O, Ni(ClO4)2·6H2O and Cu(BF4)2·6H2O] were received from Alfa Aesar, while 2,2′-bipyridine was purchased from sigma. IR spectra were recorded in the solid state on a Nicolet 380 FT-IR spectrometer equipped with a smart iFTR accessory. An Agilent 8453 diode array spectrophotometer were used to record the electronic spectra of the synthesized compounds. The elemental compositions were obtained by Elementer Vario EL III. The electrospray ionization (ESI) positive mode mass spectra were recorded using Bruker micrOTOF spectrometer with a flow rate of 4 μL leading finally to investigate the compounds. Molar conductance values were recorded on a digital Jenway 4310 conductivity meter with 1.02 cell constant. Magnetic susceptibility measurement was carried out on a Sherwood scientific magnetic balance using the Gouy method43 and Hg[Co(SCN)4] was used as a calibrant. Thermogravimetric analyses were carried out under nitrogen atmosphere (20 mL min−1) using a platinum crucible with a heating rate of 10 °C min−1 using a Shimadzu DTG-60H simultaneous DTG/TG apparatus.Synthesis of ternary complexes
The benzimidazole ligand L was prepared by deprotonation of 2-(2′-pyridyl)benzimidazole with NaH in dimethylformamide and treated the sodium salt solution with 1,6-dibromo hexane.15 The binuclear ternary complexes 1–3 were synthesized by refluxing L (0.4 mmol, 85 mg) and the appropriate metal salts (0.4 mmol; Co(ClO4)2·6H2O (143 mg), Ni(ClO4)2·6H2O (146 mg) and Cu(BF4)2·6H2O (138 mg)) in acetone for 3 h. Then, 2,2′-bipyridine (0.8 mmol, 125 mg) was added to the reaction mixture and the reflux was continued for 12 h. Solvent was removed, and the precipitates were washed with water, diethyl ether and then dried under vacuum.[Co2(bpy)4L](ClO4)4·H2O (1): colour: buff powder. IR (ATR, diamond): ν = 3081 (w, CH), 2933 (w, CH), 1601 (m, CNbpy), 1569 (CC/CN), 1439, 1247, 1077, 1017, 763. ESI-MS (positive mode, acetone): 1256.2743 {[M2(bpy)3L](ClO4)2}2+ and 1201.0764 {[M2(bpy)2L](ClO4)3}+. C70H60C14N14Co2O16·H2O: C 51.55, H 3.83, N 12.02, found C 51.50, H 4.09, N 12.45. UV-vis (DMF): 303, 314, and 490 nm. μeff (solid-state, room temperature, per metal ion): 4.15 μB. Molar Cond. (10−3 M, DMF): 280 Ω−1 mol−1 cm2.
[Ni2(bpy)4L](ClO4)4·4H2O: colour: pink powder. IR (ATR, diamond): ν = 3082 (w, CH), 2929 (w, CH), 1602 (m, CNbpy), 1572 (CC/CN), 1440, 1248, 1073, 1020, 762. ESI-MS (positive mode, acetone): 1215.4662 {[M2(bpy)4L] + H}4+ and 1199.1074 {[M2(bpy)2L](ClO4)3}+. C70H60Cl4N14Ni2O16·4H2O: C 49.91, H 4.07, N 11.64, found C 49.92, H 4.05, N 11.88. UV-vis (DMF): 299, 310, 326, 533, 784 and 875 nm. μeff (solid-state, room temperature, per metal ion): 2.90 μB. Molar cond. (10−3 M, DMF): 295 Ω−1 mol−1 cm2.
[Cu2(OH2)2(bpy)2L](BF4)4 (3): colour: blue powder. IR (ATR, diamond): ν = 3091 (w, CH), 1605 (m, CNbpy), 1568 (m, CC/CN), 1476, 1445, 1319, 1180, 1028, 770. ESI-MS (positive mode, acetone): 967.2775 {[Cu2(bpy)2(OH2)L]}+. C50H48B4Cu2F16N10O2: C 46.36, H 3.74, N 10.81, found C 46.54, H 3.65, N 10.69. UV-vis (DMF): 287, 313, 439, 700 nm. μeff (solid-state, room temperature, per metal ion): 1.76 μB. Molar Cond. (10−3 M, DMF): 306 Ω−1 mol−1 cm2.
DFT and TDDFT calculations
Ground-state geometry optimization of the complexes was performed using Becke 3 parameter (exchange) Lee–Yang–Parr (B3LYP) functional combined with LANL2DZ basis set.44–46 Time-dependent density functional theory calculations in DMSO were carried out at the same level of theory of the optimization process using the default polarizable continuum model (PCM).43,47 Natural population analyses and the analysis frontier molecular orbitals were performed by B3LYP/LANL2DZ method. Density functional theory calculations were carried out and visualized by Gaussian 0348 and Gauss-view programs, respectively.DNA binding study by absorption titration
The spectral changes associated the addition of calf thymus DNA to the complexes were spectrophotometrically followed. The calf thymus DNA solution was prepared as follows: CT-DNA was dissolved in Tris-HCl buffer (5 mM tris(hydroxymethyl) amino methane, 50 mM NaCl at pH = 7.5) and the absorbance, recorded at 260 and 280 nm, was in a ratio of 1.9:1 to be sure that DNA was free of protein. The concentration of CT DNA was measured from the band intensity at 260 nm (ε = 6600 M−1 cm−1). Calf-thymus DNA was added to the complexes in a successive quantity (V = 5–45 μL, 0.47 mM) to a constant amount of the complex (1 × 10⁻⁵ M) in a total volume of 1 mL. Subsequent mixing the CT DNA with DMSO solution of metal complexes, the solutions were incubated 10 min for equilibrium before recording the electronic spectrum.
Lysozyme binding study
The lysozyme binding affinity towards the complexes was investigated by following the same procedure used within DNA binding study.Biological activity testing
According to standard broth microdilution assays,13 the biological activity was assessed according to the procedure given in the ESI† as recommended by the NCCLS for bacteria and yeasts (M07-A8 and M27-A2), and the standards of European Committee on Antimicrobial Susceptibility Testing (EDef7.1) (ESI†).49 The benzimidazole L and complexes 1–3 that were screened at a fixed concentration (usually 32 μg mL−1 or 20 μM), with a maximum of 0.5% DMSO, final in assay concentration, against a series of bacterial and fungal pathogens; Staphylococcus aureus ATCC 43300, Escherichia coli ATCC 25922, Klebsiella pneumoniae ATCC 700603, Acinetobacter baumannii ATCC 19606, Pseudomonas aeruginosa ATCC 27853, Candida albicans ATCC 90028 and Cryptococcus neoformans var. grubii H99; ATCC 208821.DNA cleavage study by gel electrophoresis
The ability of complexes to cleave the supercoiled DNA is generally monitored by agarose gel electrophoresis. The supercoiled plasmid DNA was dissolved in (5 mM Tris-HCl/50 mM NaCl), buffer at pH 7.2, treated with different concentrations of the complexes (50, 100, 150 μM) and incubated for 12 h at 37 °C. After the incubation time, each sample was mixed with the loading buffer consisting of (25% bromophenol blue, 0.25% xylene cyanol and 30% glycerol) and loaded into 1% (w/v) agarose gel. Electrophoresis was carried out in tris-acetate-EDTA buffer for 1 h at 90 V. After electrophoresis, the gel was finally stained with ethidium bromide for about 5 min and then photographed under UV light. Percentage of each cleavage product were quantified using ImageJ software.50,51Cell viability assay
3-(4,5-dimethylthiazol-2-yl)-2,5-diphenyltetrazolium bromide (MTT) assay52 was used to test the abilities of the complexes to interfere the growth of human liver carcinoma cells (HepG-2) as well as human normal cell. Cells were seeded on 96-multiwell plate (1 × 10⁴ cells per well) for 24 h before treatment with complexes to allow attachment of cells to the wall of the plate. (0, 10, 20, 40 and 80 μM) concentrations were dissolved in 100 μL of DMSO and added to the cell's monolayer, for each tested concentration, three wells were used. The monolayer cells were incubated with the compounds for 24 h at 37 °C in atmosphere of 5% CO2. After incubation time, old media was removed and 100 μL of MTT solution (0.5 mg mL−1), was added for a 4 h incubation. Optical density was measured by an enzyme-linked immunosorbent assay (ELISA) reader at 490 nm. The relation between the percentage viability versus complex concentration in μM was plotted to get the survival curve for each complex (IC50). The half maximal inhibitory concentration values were derived from the experimental data. The cytotoxicity against noncancerous HEK-293 was assessed at a fixed concentration of 32 μg mL−1.Conflicts of interest
There are no conflicts to declare.References
- H. Malonga, J.-F. Neault and H.-A. Tajmir-Riahi, DNA Cell Biol., 2006, 25, 393 CrossRef CAS.
- G. Sava, G. Jaouen, E. A. Hillard and A. Bergamo, Dalton Trans., 2012, 41, 8226 RSC.
- R. Galindo-Murillo, J. C. García-Ramos, L. Ruiz-Azuara, T. E. Cheatham and F. Cortés-Guzmán, Nucleic Acids Res., 2015, 43, 5364 CrossRef CAS PubMed.
- A. M. Mansour and O. R. Shehab, J. Photochem. Photobiol., A, 2018, 364, 406 CrossRef CAS.
- A. M. Mansour and O. R. Shehab, Dalton Trans., 2018, 47, 3459 RSC.
- A. L. Abuhijleb, J. Inorg. Biochem., 1997, 68, 167 CrossRef.
- L. Lerman, J. Mol. Biol., 1961, 3, 18 CrossRef CAS.
- M. Oliveira, M. Couto, P. Severino, T. Foppa, G. Martins, B. Szpoganicz, R. Peralta, A. Neves and H. Terenzi, Polyhedron, 2005, 24, 495 CrossRef CAS.
- K. G. Ragunathan and H. J. Schneider, Angew. Chem., Int. Ed. Engl., 1996, 35, 1219 CrossRef CAS.
- D. Desbouis, I. P. Troitsky, M. J. Belousoff, L. Spiccia and B. Graham, Coord. Chem. Rev., 2012, 256, 897 CrossRef CAS.
- J.-L. Tian, L. Feng, W. Gu, G.-J. Xu, S.-P. Yan, D.-Z. Liao, Z.-H. Jiang and P. Cheng, J. Inorg. Biochem., 2007, 101, 196 CrossRef CAS.
- (a) K. Zheng, F. Liu, Y.-T. Li, Z.-Y. Wu and C.-W. Yan, J. Inorg. Biochem., 2016, 156, 75 CrossRef CAS PubMed; (b) G. Jiang, W. Zhang, M. He, Y. Gu, L. Bai, Y. Wang, Q. Yi and F. Du, Polyhedron, 2019, 169, 209 CrossRef CAS; (c) G. Jiang, W. Zhang, M. He, Y. Gu, L. Bai, Y. Wang, Q. Yi and F. Du, Spectrochim. Acta, Part A, 2019, 220, 117132 CrossRef CAS.
- A. M. Mansour, Eur. J. Inorg. Chem., 2018, 2018, 852 CrossRef CAS.
- D. S. Raja, N. S. Bhuvanesh and K. Natarajan, Eur. J. Med. Chem., 2011, 46, 4584 CrossRef CAS.
- A. M. Mansour and A. Friedrich, New J. Chem., 2018, 42, 18418 RSC.
- A. M. Mansour, Dalton Trans., 2014, 43, 15950 RSC.
- A. M. Mansour and R. R. Mohamed, RSC Adv., 2015, 5, 5415 RSC.
- A. B. P. Lever, Inorganic Electronic Spectroscopy, Elsevier, Amsterdam, 2nd edn, 1982 Search PubMed.
- H. Baba and M. Nakano, Inorg. Chem. Commun., 2012, 17, 177 CrossRef CAS.
- Y.-T. Li, C.-W. Yan, Y.-J. Zheng and D.-Z. Liao, Polyhedron, 1998, 17, 1423 CrossRef CAS.
- E. González, A. Rodrigue-Witchel and C. Reber, Coord. Chem. Rev., 2007, 251, 351 CrossRef.
- A. M. Mansour and O. R. Shehab, Spectrochim. Acta, Part A, 2014, 128, 263 CrossRef CAS PubMed.
- A. Srivastava, V. Rana and M. Mohan, J. Inorg. Nucl. Chem., 1974, 36, 2118 CrossRef CAS.
- A. M. Mansour, J. Coord. Chem., 2016, 69, 215 CrossRef CAS.
- G. Faraglia, F. Barbaro and S. Sitran, Transition Met. Chem., 1990, 15, 242 CrossRef CAS.
- N. T. A. Ghani and A. M. Mansour, J. Mol. Struct., 2011, 991, 108 CrossRef.
- A. E. Reed, L. A. Curtiss and F. Weinhold, Chem. Rev., 1988, 88, 899 CrossRef CAS.
- A. M. Mansour, Inorg. Chim. Acta, 2013, 394, 436 CrossRef CAS.
- X. Ren, J. Chen and X. Le, Chin. J. Chem., 2011, 29, 1380 CrossRef CAS.
- A. Hotze, E. van der Geer, H. Kooijman, A. Spek, J. Haasnoot and J. Reedijk, Eur. J. Inorg. Chem., 2005, 2648 CrossRef CAS.
- S. Komeda, T. Moulaei, K. K. Woods, M. Chikuma, N. P. Farrell and L. D. Williams, J. Am. Chem. Soc., 2006, 128, 16092 CrossRef CAS.
- A. Pyle, J. Rehmann, R. Meshoyrer, C. Kumar, N. Turro and J. K. Barton, J. Am. Chem. Soc., 1989, 111, 3051 CrossRef CAS.
- H. K. Liu, S. J. Berners-Price, F. Wang, J. A. Parkinson, J. Xu, J. Bella and P. J. Sadler, Angew. Chem., Int. Ed., 2006, 45, 8153 CrossRef CAS.
- J. Lee, V. Guelev, S. Sorey, D. W. Hoffman and B. L. Iverson, J. Am. Chem. Soc., 2004, 126, 14036 CrossRef CAS.
- P. Vardevanyan, A. Antonyan, M. Parsadanyan, M. Shahinyan and L. Hambardzumyan, J. Appl. Spectrosc., 2013, 80, 595 CrossRef CAS.
- A. Gonzalez-Perez, J. Del Castillo, J. Czapkiewicz and J. Rodríguez, Colloid Polym. Sci., 2002, 280, 503 CrossRef CAS.
- B. K. Seth, A. Ray and S. Basu, J. Lumin., 2015, 161, 54 CrossRef.
- N. Pontillo, G. Ferraro, L. Messori, G. Tamasi and A. Merlino, Dalton Trans., 2017, 46, 9621 RSC.
- V. G. Vaidyanathan and B. U. Nair, J. Inorg. Biochem., 2002, 91, 405 CrossRef CAS.
- J. Tan, B. Wang and L. Zhu, JBIC, J. Biol. Inorg. Chem., 2009, 14, 727 CrossRef CAS.
- N. Raman, S. Johnson Raja, J. Joseph, A. Sakthivel and J. Dhaveethu Raja, J. Chil. Chem. Soc., 2008, 53, 1599 CAS.
- R. Martinez and L. Chacon-Garcia, Curr. Med. Chem., 2005, 12, 127 CrossRef CAS.
- N. T. Abdel-Ghani, M. F. A. El-Ghar and A. M. Mansour, Spectrochim. Acta, Part A, 2013, 104, 134 CrossRef CAS.
- A. Becke, J. Chem. Phys., 1993, 98, 5648 CrossRef CAS.
- A. D. Becke, Phys. Rev. A: At., Mol., Opt. Phys., 1988, 38, 3098 CrossRef CAS.
- C. Lee, W. Yang and R. G. Parr, Phys. Rev. B: Condens. Matter Mater. Phys., 1988, 37, 785 CrossRef CAS.
- A. M. Mansour, E. M. El Bakry and N. T. Abdel-Ghani, J. Mol. Struct., 2016, 1111, 100 CrossRef CAS.
- M. Frisch, G. Trucks, H. Schlegel, G. Scuseria, M. Robb, J. Cheeseman, V. Zakrzewski, J. Montgomery Jr, R. Stratmann, J. C. Burant, S. Dapprich, J. Millam, A. Daniels, K. Kudin, M. Strain, O. Farkas, J. Tomasi, V. Barone, M. Cossi, R. Cammi, B. Mennucci, C. Pomelli, C. Adamo, S. S. Clifford, J. Ochterski, G. Petersson, P. Ayala, Q. Cui, K. Morokuma, D. Malick, A. Rabuck, K. Raghavachari, J. Foresman, J. Cioslowski, J. Ortiz, A. Baboul, B. Stefanov, G. Liu, A. Liashenko, P. Piskorz, I. Komaromi, R. Gomperts, R. Martin, D. Fox, T. Keith, M. Al-Laham, C. Peng, A. Nanayakkara, C. Gonzalez, M. Challacombe, P. Gill, B. Johnson, W. Chen, M. Wong, J. Andres, M. Head-Gordon, E. Replogle and J. Pople, Gaussian 03, Revision A.09, Gaussian, Inc., Pittsburgh, PA, 2003 Search PubMed.
- A. M. Mansour, J. Coord. Chem., 2018, 71, 3381 CrossRef CAS.
- P. Zhao, J. Li, L.-J. Yang, J.-Z. Lu, H.-M. Guo, L.-N. Ma and B.-H. Ou, J. Coord. Chem., 2013, 66, 4220 CrossRef CAS.
- S. Tabassum, G. C. Sharma and F. Arjmand, Spectrochim. Acta, Part A, 2012, 90, 208 CrossRef CAS PubMed.
- R. Fekri, M. Salehi, A. Asadi and M. Kubicki, Inorg. Chim. Acta, 2019, 484, 245 CrossRef CAS.
Footnote |
| † Electronic supplementary information (ESI) available. See DOI: 10.1039/c9ra07188a |
| This journal is © The Royal Society of Chemistry 2019 |