 Open Access Article
Fe2+ doped in CsPbCl3 perovskite nanocrystals: impact on the luminescence and magnetic properties†
Yue Hua,
Xinyue Zhangb,
Chaoqun Yanga,
Ji Liab and
Li Wang *ab
*ab
aKey Laboratory of Functional Materials Physics and Chemistry of the Ministry of Education, Jilin Normal University, Siping 136000, China. E-mail: wangli@jlnu.edu.cn
bNational Demonstration Center for Experimental Physics Education, Jilin Normal University, Siping 136000, China
First published on 16th October 2019
Abstract
All inorganic halide perovskite nanocrystals (NCs) have wider practical applications owing to their good properties, whereas the photoluminescence quantum yield (PLQY) of the purple emissive CsPbCl3 NCs is too low to apply in multi-color displays. In this study, earth-abundant Fe2+ metal ions were successfully incorporated into the lattice of CsPbCl3 NCs with the partial replacement of the sites of Pb2+ ions. The impacts of Fe2+ ions on the luminescence and magnetic properties of CsPbCl3 NCs were studied using photoluminescence spectroscopy (PL), X-ray diffraction spectroscopy (XRD), transmission electron microscopy (TEM), field emission scanning electron microscopy (FE-SEM), and a vibrating sample magnetometer (VSM). CsPb1−xFexCl3 NCs, with x = 0, 0.1, 0.2, and 0.3, were synthesized at 170 °C. It was found that an appropriate amount of Fe2+ doping not only improved the homogeneity of the size of NCs, but also enhanced the PLQY and average PL lifetimes. An obvious hysteresis behavior was observed for the NCs, and there was a significant change in the saturation magnetization value with the increase in the Fe2+ concentration.
1. Introduction
The outstanding optoelectronic properties of hybrid methylamine lead halide (MAPbX3, MA = CH3NH3+; X = Cl, Br, and I), such as a direct optical band gap, large optical absorption coefficient, long-range diffusion length, and high charge carrier mobility, have made their rapid development for application in photovoltaic devices with an enormous potential in solar cells, lasers, and photodetectors.1–4 However, they are extremely sensitive to oxygen and moisture, which severely limit their further development and practical applications.5,6 In 1990s, all inorganic CsPbX3 (X = Cl, Br, and I) nanocrystals (NCs) appeared.7–9 They have good environmental stability, a high photoluminescence quantum yield (PLQY), a narrow emission linewidth, and a wide color gamut compared to hybrid methylamine lead halide, which led to their quick practical applications.10,11In the practical applications of lead perovskite halides, the biggest problem is the environment pollution caused by the toxicity of lead. The most effective way is to replace Pb ions in the crystal structure by introducing impurity ions. Recently, some researchers reported the transition and alkaline earth metal ion doping into perovskite NCs.12–15 For example, Belcher et al. demonstrated for the first time that partially substituting Pb2+ by Co2+ at the B-sites of the perovskite lattice was possible.16 Sun et al. had shown that the doping of CsPbX3 NCs with Ni2+ ions enabled single-color violet luminescence with near-unity PLQYs.17 Among these ions, being the most abundant element on earth, Fe ions are not only environmentally friendly and low-cost, but also have a good conductivity. Moreover, Strouse et al. proved the appearance of room-temperature ferromagnetism in Fe-doped CdSe nanoparticles.18 Therefore, replacing Pb ions in lead perovskite halides with Fe ions has become a popular direction for their application as photonic devices. The structural, electronic, magnetic and optical properties of the perovskite CH3NH3(Pb:Fe)I3 were systematically studied from first principles and experiments by Hao et al.19. Also, Yu et al.20 doped different concentration of Fe2+/Fe3+ into the crystal lattice of MAPbCl3 single crystals, and studied the crystal growth process, crystal structure, optical and optoelectronic properties.
In all inorganic lead perovskite materials, the PLQYs of green and red emissive CsPbBr3 and CsPbI3 NCs have reached 90%, respectively,21,22 whereas the PLQY of purple emissive CsPbCl3 NCs is still low (below 5%).23 Therefore, the most urgent task now is to enhance the PLQY of CsPbCl3 NCs for the application of violet-emitting devices. Song et al. enhanced the exciton emission QY of CsPbCl3 NCs up to 10.3% and 31.2% by doping K and Eu ions, respectively.24 Singh et al. synthesized Fe3+-doped CsPbCl3 NCs and found that the doping of Fe enhanced the PL QY from 1.85 to 4.32.25
In this study, we synthesized and researched CsPb1−xFexCl3 (x = 0, 0.1, 0.2, and 0.3) NCs. Interesting changes in luminescence and magnetic properties were observed by varying the doping concentration of Fe2+ ions in CsPbCl3 NCs. The samples were characterized via various techniques and are discussed in detail.
2. Experimental
2.1 Materials
Lead chloride (PbCl2, 99.99%), cesium carbonate (Cs2CO3, 99.99%), iron dichloride (FeCl2, 99.99%) and trioctylphosphine (TOP, 90%) were purchased from Aladdin; 1-octadecene (ODE, 90%) was purchased from Alfa Aesar; oleic acid (OA, 90%) and oleylamine (OLA, 70%) were purchased from Aldrich. All chemicals were used without further purification.2.2 Synthesis of CsPb1−xFexCl3 (x = 0, 0.1, 0.2, and 0.3) NCs
Cs-oleate precursors and CsPbCl3 NCs were synthesized following our previous reports.26,27 In a typical procedure for the synthesis of Fe2+ doped CsPbCl3 NCs, PbCl2 (1−x mmol) and FeCl2 (x mmol) were mixed with OLA (1.5 mL), OA (1.5 mL), TOP (1 mL), and ODE (10 mL) in a 50 mL three-neck round-bottomed flask. The reaction mixture was degassed at 110 °C for 20 min, and then heated up to 170 °C under an argon flow. A Cs-oleate precursor (1 mL) was quickly injected and 15 s later, the reaction mixture was cooled using an ice-water bath. The solution was centrifuged for 5 min at 5000 rpm after the reaction, the supernatant was discarded and then, the particles were dispersed in hexane and centrifuged again for 5 min at 5000 rpm to remove the residual reaction mixture.2.3 Characterization
X-ray diffraction (XRD) was performed by incident radiation from a Rigaku D/Max-2500 diffractometer and copper Kα radiation (λ = 1.54 A). UV-visible absorption spectra were recorded using a Shimadzu UV-2700 spectrophotometer. The steady-state and time-resolved fluorescence spectra were collected using a Horiba Jobin Yvon fluorologo-3 fluorescence spectrometer; a 450 W Xenon lamp and an N-305 nano-LED were used as the excitation sources. The absolute photoluminescence quantum yield (PLQY) was recorded using an Otsuka QE-2000. Transmission electron microscopy (TEM) was performed using a JEOL-JEM-2100 microscope. Field emission scanning electron microscopy (FE-SEM) and energy-dispersive X-ray (EDX) mapping were performed using a JEOL JSE-7800F. A vibrating sample magnetometer (VSM, Lake Shore 7407) was used to determine the magnetic properties.3. Results and discussion
Fig. 1(a) shows the XRD patterns of CsPb1−xFexCl3 NCs. For undoped CsPbCl3 NCs, there are two strong diffraction peaks around 15.4° and 31.6°, corresponding to the (100) and (200) planes. It indicates that the typical cubic structure has been formed, fitting with the reference from a standard card (JCPDS: 75-0411). With different concentrations of Fe2+ ion doping, no new diffraction peaks appeared, which insinuates that the structure of NCs is maintained even after the doping with Fe2+ ions. The enlarged patterns of (200) the diffraction peaks for the samples are shown in Fig. 1(b). With the increase in x value, the diffraction peak shifts to a larger angle. It suggests that Fe2+ ions have been doped into CsPbCl3 NCs, and the lattice parameter decreases with the increase in the x value. The decrease in the lattice parameter is due to the fact that the radius of Pb2+ (0.120 nm) ions is larger than that of Fe2+ (0.076 nm) ions, which is similar to the Ni and Mn ion doped CsPbCl3 NCs.28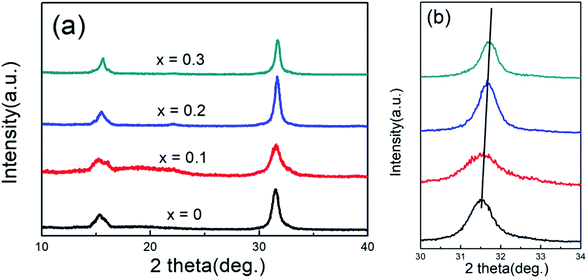 | ||
| Fig. 1 (a) XRD patterns of CsPb1−xFexCl3 (x = 0, 0.1, 0.2, and 0.3) NCs. (b) The enlarged XRD patterns near 31.6°. | ||
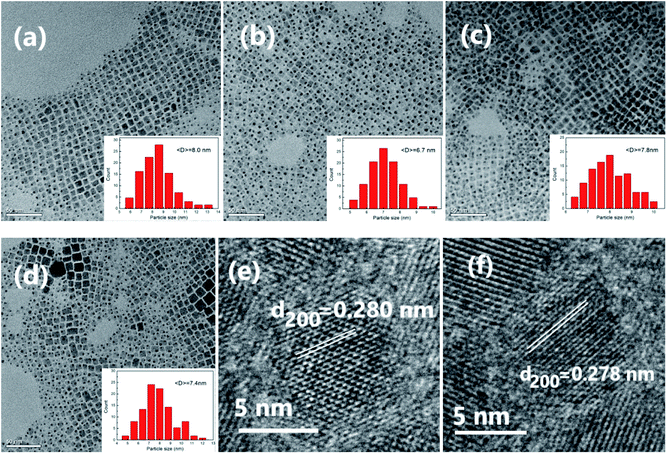
The TEM images of undoped CsPbCl3 NCs and Fe-doped CsPbCl3 NCs with different doping concentrations are shown in Fig. 2. The inset denotes the particle size distribution. It can be clearly seen that the NCs are monodispersed cubes. Undoped NCs as large as 8.0 nm are distributed between 5.5 and 13.5 nm. After the doping of Fe2+ ions, the average sizes and the distribution of the NCs have changed. For x = 0.1, 0.2, and 0.3, the average sizes of the NCs are 6.7, 7.8 and 7.4 nm, and they are distributed in the ranges of 5–10.5 nm, 6.5–10.5 nm, and 4.5–12.5 nm, respectively. The sizes of Fe2+-doped NCs are smaller than those of the undoped NCs, which may be due to the reduction in the growth rate of perovskite NCs in the presence of Fe chloride in the reaction process. Moreover, the size distributions of the NCs with low doping concentrations (x = 0.1 and 0.2) are relatively uniform. The high resolution transmission electron microscopy (HR-TEM) images of the undoped CsPbCl3 NCs and Fe-doped CsPbCl3 NCs with x = 0.1 are shown in Fig. 2(e) and (f), respectively. The lattice spacing of NCs in the (200) direction is estimated to be about 0.278 nm for Fe2+-doped CsPbCl3 NCs, which is smaller than that for the undoped CsPbCl3 NCs (0.281 nm). The result is consistent with that of XRD analysis and previous reports.24 In addition, EDX mapping images in Fig. S1† further prove that the elements of Cs, Pb, Cl and Fe are identified in Fe-doped CsPbCl3 NCs.
Fig. 3(a) and (b) show the UV-visible absorption and steady-state PL spectra of CsPb1−xFexCl3 NCs. In Fig. 3(a), the exciton absorption band of undoped CsPbCl3 NCs is about 397 nm. With the increase in the x value, the exciton absorption band monotonously decreases slightly. According to the absorption spectra, the band gaps of the NCs with x = 0, 0.1, 0.2, and 0.3 are 3.12, 3.15, 3.16, and 3.18 eV, respectively. The gradual increase in the band gap of the NCs is due to the lattice contraction with the doping of Fe2+. Moreover, in Fig. 3(b), the exciton PL peak is at 404 nm with a full width at half maximum (FWHM) of 15.7 nm (121.0 meV) for undoped CsPbCl3 NCs. For the doped NCs with x = 0.1, 0.2 and 0.3, the exciton PL peaks are located at 401, 403 and 402 nm with the FWHM of 13.9 nm (101.8 meV), 13.8 nm (99.1 meV) and 14.6 nm (123.6 meV), respectively. The shift in the PL bands can be caused by the change in the size of NCs, which is corresponding to the quantum size effect of CsPbX3 NCs.29 With the decrease in the size of NCs, PL bands will have a blue-shift. Moreover, PL bands will have a red-shift when the size increases. The variation in the FWHM of the PL band in the doped NCs may be due to the size distribution of NCs. The distributions of the NCs with low doping levels (x = 0.1 and 0.2) are relatively homogeneous, resulting in a small FWHM. The PLQY of CsPb1−xFexCl3 NCs is recorded in Fig. 3(c). The PLQY is 4.4% for the undoped CsPbCl3 NCs, which is slightly higher than that of previous reports,24,25 but is still below 5%. With the doping of Fe2+ ions, the PLQY increases initially, reaching a maximum as x is 0.2, and then decreases with the further increase in the Fe2+ ion doping concentration. The maximum PLQY of doped NCs is about 6.2%, which enhanced 1.4 times compared to that of undoped CsPbCl3 NCs. It can be the reduction of defects in Fe2+-doped CsPbBr3 NCs, which leads to the more ordered local environment and the homogeneous distribution of the NCs.30
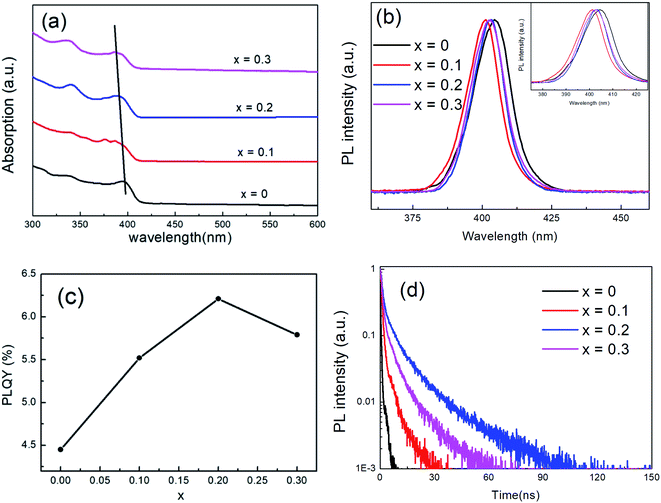 | ||
| Fig. 3 Absorption (a) and PL spectra (b), PLQYs (c) and decay (d) of CsPb1−xFexCl3 NCs. Inset of (b) shows the enlarged spectra. | ||
The PL decay curves of undoped CsPbCl3 NCs and Fe doped CsPbBr3 NCs as a function of Fe2+ doping concentration are shown in Fig. 3(d). The lifetimes were acquired by fitting the decay curves via the function:
I(t) = A1![[thin space (1/6-em)]](https://www.rsc.org/images/entities/char_2009.gif) exp(−t/τ1) + A2 exp(−t/τ1) + A2![[thin space (1/6-em)]](https://www.rsc.org/images/entities/char_2009.gif) exp(−t/τ2) exp(−t/τ2)
| (1) |
The average PL lifetimes were calculated by the following formula:
| τav = (A1τ12) + (A2τ22)/(A1τ1) + (A2τ2) | (2) |
| A1 | τ1 (ns) | A2 | τ2 (ns) | τav (ns) | |
|---|---|---|---|---|---|
| 0 | 1.069 | 0.6 | 0.005 | 5.9 | 0.8 |
| 0.1 | 1.097 | 0.9 | 0.020 | 11.2 | 2.8 |
| 0.2 | 0.869 | 2.6 | 0.215 | 20.8 | 14.6 |
| 0.3 | 0.985 | 2.4 | 0.118 | 16.8 | 9.0 |
| Error | ±0.004 | ±0.4 | ±0.003 | ±0.3 | ±0.3 |
The contributions of short time and longtime components to the average lifetime are shown in Fig. 4. It is obvious that the contribution of short time components is larger than that of long time components for all the samples, which indicates that the short-lived process dominates in the PL process of CsPb1−xFexCl3 NCs and there are lots of defects in the NCs. Simultaneously, the increase in τ1 is the indirect evidence that the defect states of Fe-doped CsPbBr3 NCs are reduced and the non-radiative paths are partly eliminated with the doping of Fe2+. It is the main reason for the improvement in the PLQYs of Fe-doped CsPbBr3 NCs, compared to the undoped one. In addition, τ1 of CsPb0.7Fe0.3Cl3 NCs is less than that of CsPb0.8Fe0.2Cl3 NCs, demonstrating that the former have more defects than the latter. Therefore, the excessive doping of Fe2+ ions may destroy the lattice structure of CsPbBr3 NCs, resulting in a decrease in PLQY and average PL lifetimes.
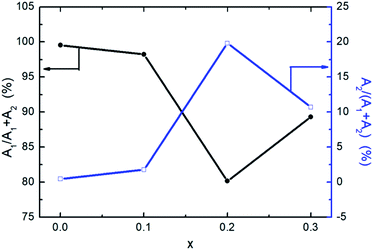 | ||
| Fig. 4 Contributions of short time components (A1) and long time components (A2) of CsPb1−xFexCl3 NCs. | ||
The PL spectra of CsPb0.8Fe0.2Cl3 NCs were recorded at temperatures ranging from 80 K to 300 K, as shown in Fig. 5(a). The asymmetry of the PL spectrum for the NC at 80 K is caused by the size distribution.33 As the temperature increases from 80 K to 300 K, it shows a clear decrease in the PL intensity accompanied by a broadening in the emission bandwidth. The decrease in the PL intensity is related to the increase in the FWHM of the PL peak, which can be attributed to the phonon-assisted broadening effect. A similar case was also observed in CdSe quantum dots.34,35 It is worth noting that there is a blueshift in the emission energy when the temperature increases from 80 K to 200 K, then has a small redshift with the further increase in temperature. The blue-shift with the increase in temperature is due to the fact that the out-of-phase band-edge states suffer from lattice dilation at the Brillouin zone boundary.36 Also, the red-shift above 200 K may be attributed to the defect states in the NCs. Fig. 5(b) gives the Arrhenius plot of the integrated PL intensity versus temperature, fitted using the equation below:37
 | (3) |
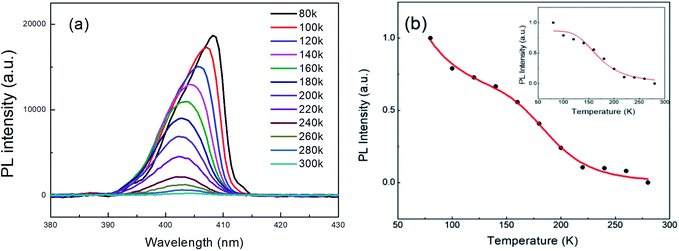 | ||
| Fig. 5 (a) The PL spectra of CsPb0.8Fe0.2Cl3 NCs at various temperatures. (b) Variation of integrated PL intensity with respect to temperature. | ||
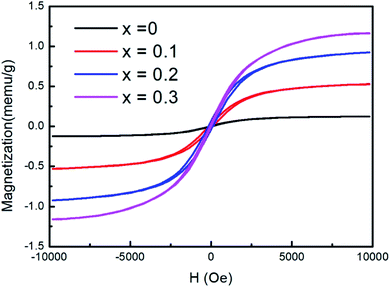
Fig. 6 shows the magnetic hysteresis loops measured at room temperature. An obvious hysteresis behavior has been observed for the samples. For undoped CsPbCl3 NCs, the saturation magnetization Ms is only 0.13 meum g−1 at room temperature. Upon increasing the concentration of Fe2+ ions, an increase in Ms was observed. The observed ferromagnetism of doped NCs may be attributed to the presence of Fe2+ ions in the lattice as a substituent for carrier-induced ferromagnetism.39
4. Conclusions
In summary, we have studied the luminescent and magnetic properties of CsPb1−xFexCl3 NCs with x = 0, 0.1, 0.2, and 0.3. The diffraction peaks in XRD patterns shifted toward a larger angle, indicating the successful doping of Fe into CsPbCl3 NCs. The TEM images show that the size distributions of CsPb1−xFexCl3 NCs with x = 0.1 and 0.2 were relatively uniform. After an appropriate amount of Fe2+ doping (x = 0.2), the PLQY of excitons is enhanced from 4.4% to 6.2%, and the average PL lifetimes is lengthened from 0.91 ns to 14.61 ns. While the excessive doping will destroy the lattice structure of the perovskite NCs, resulting in the decrease in the PLQY and average PL lifetimes. The increase in PLQY suggests that the defect states and the non-radiative paths of the NCs decrease with doping Fe2+ ions. Beside that there is a significant change in the saturation magnetization value with the increase in the Fe2+ ion concentration, and the ferromagnetism of doped NCs may be attributed to the presence of Fe2+ ions in the lattice as a substituent for carrier-induced ferromagnetism.Conflicts of interest
There are no conflicts to declare.Acknowledgements
This work was supported by the National Natural Science Foundation of China (11504132) and the Thirteenth Five-Year Program for Science and Technology of Education Department of Jilin Province (JJKH20180768KJ).References
- J. H. Im, I. H. Jang, N. Pellet, M. Grätzel and N. G. Park, Nat. Nanotechnol., 2014, 9, 927–932 CrossRef CAS.
- F. X. Xie, D. Zhang, H. Su, X. Ren, K. S. Wong, M. Grätzel and W. C. Choy, ACS Nano, 2015, 27, 639–946 CrossRef.
- F. Fu, L. Kranz, S. Yoon, J. Löckinger, T. Jäger, J. Perrenoud, T. Feurer, C. Gretener, S. Buecheler and A. N. Tiwari, Phys. Status Solidi A, 2015, 212, 2708–2717 CrossRef CAS.
- D. Liu, L. Wu, C. Li, S. Ren, J. Zhang, W. Li and L. Feng, ACS Appl. Mater. Interfaces, 2015, 7, 16330–16337 CrossRef CAS.
- A. Dualeh, N. Tétreault, T. Moehl, P. Gao, M. K. Nazeeruddin and M. Grätzel, Adv. Funct. Mater., 2014, 24, 3250–3258 CrossRef CAS.
- J. Su, D. P. Chen and C. T. Lin, J. Cryst. Growth, 2015, 422, 75–79 CrossRef CAS.
- L. Protesescu, S. Yakunin, M. I. Bodnarchuk, F. Krieg, R. Caputo, C. H. Hendon, R. X. Yang, A. Walsh and M. V. Kovalenko, Nano Lett., 2015, 15, 3692–3696 CrossRef CAS.
- M. A. Uddin, J. K. Mobley, A. A. Masud, T. Liu, R. L. Calabro, D. Y. Kim, C. I. Richards and K. R. Graham, J. Phys. Chem. C, 2019, 123, 18103–18112 CrossRef CAS.
- S. Seth, T. Ahmed, A. De and A. Samanta, ACS Energy Lett., 2019, 4, 1610–1618 CrossRef CAS.
- P. Liang, P. Zhang, A. Pan, K. Yan, Y. S. Zhu, M. Y. Yang and L. He, ACS Appl. Mater. Interfaces, 2019, 11, 22786–22793 CrossRef CAS.
- J. H. Cha, K. Noh, W. Yin, Y. Lee, Y. Park, T. K. Ahn, A. Mayoral, J. Kim, D. Y. Jung and O. Terasaki, J. Phys. Chem. Lett., 2019, 10, 2270–2277 CrossRef CAS.
- S. D. Adhikari, R. K. Behera, S. Bera, N. Pradhan and J. Phys, Chem. Lett., 2019, 10, 1530–1536 Search PubMed.
- J. K. Chen, J. P. Ma, S. Q. Guo, Y. M. Chen, Q. Zhao, B. B. Zhang, Z. Y. Li, Y. Zhou, J. S. Hou, Y. Kuroiwa, C. Moriyoshi, O. M. Bakr, J. Y. Zhang and H. T. Sun, Chem. Mater., 2019, 31, 3974–3983 CrossRef CAS.
- W. Z. Xu, L. Y. Zheng, X. T. Zhang, Y. Cao, T. Y. Meng, D. Z. Wu, L. Liu, W. P. Hu and X. Gong, Adv. Energy Mater., 2018, 8, 1703178 CrossRef.
- H. Shao, X. Bai, H. Cui, G. Pan, P. Jing, S. Qu, J. Zhu, Y. Zhai, B. Dong and H. Song, Nanoscale, 2018, 10, 1023–1029 RSC.
- M. T. Klug, A. Osherov, A. A. Haghighirad, S. D. Stranks, P. R. Brown, S. Bai, J. T. W. Wang, X. N. Dang, V. Bulovic, H. J. Snaith and A. M. Belcher, Energy Environ. Sci., 2017, 10, 236–246 RSC.
- Z. J. Yong, S. Q. Guo, J. P. Ma, J. Y. Zhang, Z. Y. Li, Y. M. Chen, B. B. Zhang, Y. Zhou, J. Shu, J. L. Gu, L. R. Zheng, O. M. Bakr and H. T. Sun, J. Am. Chem. Soc., 2018, 140, 9942–9951 CrossRef CAS.
- S. B. Singh, M. V. Limaye, S. K. Date, S. Gokhale and S. K. Kulkarni, Phys. Rev. B, 2009, 80, 235421 CrossRef.
- L. Zhou, J. J. Chang, Z. H. Lin, C. F. Zhang, D. Z. Chen, J. C. Zhang and Y. Hao, RSC Adv., 2017, 7, 54586–54593 RSC.
- X. H. Cheng, L. Jing, Y. Yuan, S. J. Du, J. Zhang, X. Y. Zhan, J. X. Ding, H. Yu and G. D. Shi, J. Phys. Chem. C, 2019, 123, 1669–1676 CrossRef CAS.
- Z. K. Tan, R. S. Moghaddam, M. L. Lai, P. Docampo, R. Higler, F. Deschler, M. Price, A. Sadhanala, L. M. Pazos, D. Credgington, F. Hanusch, T. Bein, H. J. Snaith and R. H. Friend, Nat. Nanotechnol., 2014, 9, 687–692 CrossRef CAS PubMed.
- F. Liu, Y. H. Zhang, C. Ding, S. Kobayashi, T. Izuishi, N. Nakazawa, T. Toyoda, T. Ohta, S. Hayase, T. Minemoto, K. Yoshino, S. Y. Dai and Q. Shen, ACS Nano, 2017, 11, 10373–10383 CrossRef CAS.
- H. W. Liu, Z. N. Wu, J. R. Shao, D. Yan, H. Gao, Y. Liu, W. L. Yu, H. Zhang and B. Yang, ACS Nano, 2017, 11, 2239–2247 CrossRef CAS.
- P. J. S. Rana, T. Swetha, H. Mandal, A. Saeki, P. R. Bangal and S. P. Singh, J. Phys. Chem. C, 2019, 123, 17026–17034 CrossRef CAS.
- Y. A. Liu, G. C. Pan, R. Wang, H. Shao, H. Wang, W. Xu, H. N. Cui and H. W. Song, Nanoscale, 2018, 10, 14067–14072 RSC.
- L. L. Fei, X. Yuan, J. Hua, M. Ikezawa, R. S. Zeng, H. B. Li, Y. Masumoto and J. L. Zhao, Nanoscale, 2018, 10, 19435–19442 RSC.
- Q. Y. Li, S. H. Ji, X. Yuan, J. Li, Y. Fan, J. H. Zhang, J. L. Zhao and H. B. Li, J. Phys. Chem. C, 2019, 123, 14849–14857 CrossRef CAS.
- K. Xing, X. Yuan, Y. Wang, J. Li, Y. Wang, Y. Fan, L. Yuan, K. Li, Z. Wu, H. Li, J. Zhao and J. Zhao, J. Phys. Chem. Lett., 2019, 10, 4177–4184 CrossRef CAS.
- M. A. Becker, R. Vaxenburg, G. Nedelcu, P. C. Sercel, A. Shabaev, M. J. Mehl, J. G. Michopoulos, S. G. Lambrakos, N. Bernstein, J. L. Lyons, T. Stoferle, R. F. Mahrt, M. V. Kovalenko, D. J. Norris, G. Raino and A. L. Efros, Nature, 2018, 553, 189–193 CrossRef CAS.
- Z. F. Tan, J. H. Li, C. Zhang, Z. Li, Q. S. Hu, Z. W. Xiao, T. Kamiya, H. Hosono, G. D. Niu, E. Lifshitz, Y. B. Cheng and J. Tang, Adv. Funct. Mater., 2018, 28, 1801131 CrossRef.
- G. Pan, X. Bai, D. W. Yang, X. Chen, P. T. Jing, S. N. Qu, L. J. Zhang, D. L. Zhou, J. Y. Zhu, W. Xu, B. Dong and H. W. Song, Nano Lett., 2017, 17, 8005–8011 CrossRef CAS.
- Z. Y. Zhao, W. Xu, G. C. Pan, Y. A. Liu, M. Yang, S. W. Hua, X. Chen, H. S. Peng and H. W. Song, Mater. Res. Bull., 2019, 112, 142–146 CrossRef CAS.
- M. Koolyk, D. Amgar, S. Aharon and L. Etgar, Nanoscale, 2016, 8, 6403–6409 RSC.
- Y. Zhao, C. Riemersma, F. Pietra, R. Koole, C. M. Donega and A. Meijerink, ACS Nano, 2012, 6, 9058–9067 CrossRef CAS.
- C. Bullen and P. Mulvaney, Langmuir, 2006, 22, 3007–3013 CrossRef CAS.
- A. D. Wright, C. Verdi, R. L. Milot, G. E. Eperon, M. A. Perez-Osorio, H. J. Snaith, F. Giustino, M. B. Johnston and L. M. Herz, Nat. Commun., 2016, 7, 11755 CrossRef.
- D. Bimberg, M. Sondergeld and E. Grobe, Phys. Rev. B, 1971, 4, 3451 CrossRef.
- A. Dey, P. Rathod and D. Kabra, Adv. Opt. Mater., 2018, 6, 1800109 CrossRef.
- J. K. Bindra, G. Kurian, J. H. Christian, J. V. Tol, K. Singh, N. S. Dalal, M. D. Mochena, S. A. Stoian and G. F. Strouse, Chem. Mater., 2018, 30, 8446–8456 CrossRef CAS.
Footnote |
| † Electronic supplementary information (ESI) available. See DOI: 10.1039/c9ra07069a |
| This journal is © The Royal Society of Chemistry 2019 |

