
 Open Access Article
 This Open Access Article is licensed under a Creative Commons Attribution-Non Commercial 3.0 Unported Licence
Photostimulated control of luminescence quantum yield for colloidal Ag2S/2-MPA quantum dots
Oleg V. Ovchinnikov *a,
Sergey V. Aslanova,
Mikhail S. Smirnovab,
Irina G. Grevtsevaa and
Aleksey S. Perepelitsaa
*a,
Sergey V. Aslanova,
Mikhail S. Smirnovab,
Irina G. Grevtsevaa and
Aleksey S. Perepelitsaa
aDepartment of Optics and Spectroscopy, Voronezh State University, Voronezh, Russia. E-mail: ovchinnikov_o_v@rambler.ru
bVoronezh State University of Engineering Technologies, Voronezh, Russia
First published on 14th November 2019
Abstract
In this paper, we present the results on photoinduced formation of colloidal Ag2S quantum dots with sizes of 1.5–3 nm passivated by 2-mercaptopropionic acid (Ag2S/2-MPA) in the presence of ethylene glycol. The synthetized colloidal Ag2S/2-MPA QDs have NIR recombination luminescence with its maximum near 800 nm. The control of absorption and luminescence properties of the QDs is achieved by photoactivation. It is shown that photoexposure of colloidal solution of Ag2S/2-MPA QDs leads to an increase in the QD size and monodispersity along side with the growth of the luminescence quantum yield from 1% to 7.9%. Enhancement of the luminescence quantum yield is accompanied by an increase in the average luminescence lifetime up to 190 ns, which is due to the blocking of the nonradiative recombination channel with the radiative recombination rate being (3–5.5) × 105 s−1. It is shown that the purification of the Ag2S/2-MPA solution by a dialysis membrane from regenerated cellulose leads to an increase in the sample monodispersity, as well as stops the photoinduced growth of QDs, and also reduces the degradation of their photoluminescence.
1 Introduction
Nowadays, luminescent properties of colloidal semiconductor quantum dots (QDs) are widely investigated. Such studies are of great interest since QDs are promising for solving a wide variety of fundamental and applied problems in biology, chemistry, medicine, and technology due to the unique size-dependent luminescence properties.1–5 In particular, the idea of using NIR-emitting QDs for various luminescent sensors is recognized as extremely promising.6,7 The luminescent properties of QDs differ from those of bulk crystals having the same composition by the emission intensity, maximum position of the luminescence band and its full width at half maximum (FWHM), and also by the luminescence lifetime. In a number of studies, manifestations of photostimulated degradation of QD luminescence intensity were detected.8–13 Random blinking of luminescence of single quantum dots was also demonstrated.14–16 Such unwanted parasitic effects in the QD luminescence strongly limit the development of many advanced applications, including those associated with single-photon light sources for quantum informatics.17,18Of significant interest are silver sulfide (Ag2S) QDs having intensive size-dependent luminescence in the near-infrared region. These objects are non-toxic and almost insoluble in water, which is important for many applications.19–21 However, to date, the problem of controlling the position of the maximum and the intensity of the luminescence band remains unsolved for Ag2S QDs. An appreciable photochemical activity of silver sulfide affects the stability of the optical properties of colloidal Ag2S QDs due to structural changes under exposure to exciting radiation.10,11 Photoprocesses arising in this case, pose the problem of obtaining Ag2S QDs with high stability of luminescence parameters, as well as searching for the ways of increasing the quantum yield of IR luminescence of the QDs.
Nowadays, a number of techniques for QD synthesis are known.22–29 Among them, there are approaches involving photoinduced growth of nanocrystals in the presence of passivators containing thiol and carboxyl groups.29,30 Molecules of thiocarbonic acids are a suitable passivator for Ag2S QD interfaces. First of all, this is due to the presence of free carboxyl and thiol groups, which ensures simultaneous stabilization of the QDs and good hydrophilicity. In addition, molecules of thiocarbonic acids can be simultaneously used as the passivator and as the sulfur source in the synthesis of Ag2S QDs.10,11,23,26,31 In the case of using molecules of thioglycolic acid (TGA) as the passivating agent, a strong dependence of the QD optical properties on the sulfur concentration and the silver–sulfur ratio is observed.10,11,31–33 In the works,10,11,31 it was assumed that the centers of radiative recombination of Ag2S QDs are of an interfacial nature. The low quantum yield of the QDs is explained, as a rule, by numerous surface defects formed during rapid intense release of sulfur atoms involved in the QD growth. The solution to the problem may be forced deceleration of the growth process. Polyhydric alcohols, in particular, ethylene glycol, can be used as crystallization inhibitors.26 They are convenient when mercapto acids are used as passivators. But only few studies are known which use such approach to Ag2S QD synthesis with highly stable mercapto acids employed as the passivator.24,26 However, these works do not contain an analysis of the dependence of the spectral-luminescent properties on the size of QDs. An analysis of the behavior of the luminescence quantum yield with changing the synthesis conditions and the characteristics of the ensemble of the obtained Ag2S nanoparticles is also absent.
Another unsolved problem is control of the luminescence quantum yield for Ag2S QDs and its photostability. Activation of photoprocesses, such as photodissolution or healing of interface defects, can lead to a reduction in the impact of nonradiative recombination channels and an increase in the quantum yield of QD luminescence. However, to date, works concerning photoinduced control of the luminescence quantum yield of Ag2S QDs are absent.
This paper aims to fill this gap. We present the results that demonstrate the features of transformation of the spectral-luminescent properties for Ag2S/2-MPA QDs in the process of their synthesis using ethylene glycol under continuous exposure of colloidal QD solutions to excitation radiation. The choice of ethylene glycol is due to its high viscosity, which decelerates the process of diffusion of the reagents, as well as due to the high solubility of the reagents in it. There are no luminescence bands associated with ethylene glycol in the spectral region of interest. Low-power laser radiation (405 nm) is the factor accelerating the QD growth, catalyzing the uniform passivation of the QD interfaces. We assume that the smooth growth of the QDs would provide lower concentration of structural defects during the QD formation, and hence, lead to an increase in the luminescence quantum yield.
2 Experimental
Methods of transmission electron microscopy (TEM), including high-resolution TEM (HR-TEM), were employed for the structural studies. Sizes of the synthesized ensembles of QDs were obtained using a Libra 120 transmission electron microscope (CarlZeiss, Germany) with 120 kV accelerating voltage. The size distributions of the QDs were obtained using digital analysis of the TEM images. HR-TEM images for Ag2S QDs were recorded by a JEM-2100 transmission electron microscope (Jeol, Japan) with a 200 kV accelerating voltage.XRD patterns were obtained with an ARL X'TRA diffractometer (Thermo Scientific, Switzerland) for Cu Kα1 (1.54 Å) radiation.
The interactions between 2-MPA molecules and colloidal Ag2S QDs in ethylene glycol, as well as under prolonged excitation exposure were studied by the Fourier-transform infrared (FTIR) spectroscopy method. We obtained the changes in the characteristic frequencies of most functionally active groups of 2-MPA molecules participating in the formation of Ag2S/2-MPA QDs in solution. FTIR absorption spectra were recorded with a Tensor 37 FTIR spectrometer (Bruker Optik GmbH., Germany). For the samples studied, cuvettes with KCl windows were used. The samples were prepared by depositing the sample solutions on KCl windows. The deposited solutions had equal volumes.
Dynamic light scattering (DLS) results were obtained using a Photocor Complex with laser wavelength of 647 nm and power of 25 mW. Each measurement lasted for 1 min.
Investigations of optical absorption spectra were carried out using a USB2000+ spectrometer (OceanOptics, USA) with a USB-DT emission source (OceanOptics, USA).
Photoluminescence (PL) spectra and luminescence decays of the samples were obtained using the USB2000+ spectrometer and a TimeHarp 260 time-correlated single-photon counting board (PicoQuant, Germany) with a PMC-100-20 PMT module (Becker & Hickl, Germany). The time resolution was 0.2 ns. Deconvolution with an experimentally measured instrument response function was employed for fitting the fast component of experimentally measured luminescence decay curves. The samples were excited by the UV radiation from an Alphalas PLDD-250 pulsed semiconductor laser (Alphalas, Germany) with a wavelength of 375 nm, pulse duration of 60 ps, pulse repetition rate of 100 kHz and an average pulse optical power near of 3 μW. All results were obtained at room temperature.
Photoluminescence spectra in the NIR region were recorded by a highly-stable low-noise PDF10C/M photodiode (Thorlabs Inc., USA) with a built-in amplifier, placed behind the diffraction monochromator MDR-4 (LOMO, Russia) with a diffraction grating having 600 lines per mm. The employed configuration of the equipment allows registration of PL spectra in the region of 600–1400 nm. As the PL excitation source, we also used laser diodes NDV7375 (Nichia, Japan) emitting at 405 nm with an optical power of 100 mW and NDB7675 (Nichia, Japan) emitting at 462 nm with an optical power of 0.5 W.
PL quantum yield (QY) of the synthesized ensembles of Ag2S/2-MPA QDs was determined by the relative measurement method. Methanol solution of indocyanine green (QY = 16%)34 was employed in the NIR region. The studied samples of colloidal solutions of QDs and the standards used were diluted to small optical density (D = 0.1) at 462 nm providing an equal amount of absorbed quanta with minimizing the self-absorption. The excitation wavelength was selected such as to provide efficient luminescence excitation for the investigated samples and the standards, far from the luminescence band. After correcting the sample luminescence bands for the spectral sensitivity of the photodiode, the integrated luminescence intensity was determined. The quantum yield was calculated by the formula:35
 | (1) |
Exposure of colloidal Ag2S QDs solutions for photostimulated growth was carried out by radiation of a semiconductor laser diode emitting at 405 nm with an optical power of 100 mW, which falls into the strong absorption region of a freshly prepared QDs solution. The radiation of a 375 nm laser diode with an optical power near of 3 μW did not cause the growth of QDs in units of hours, due to low optical power. A radiation with wavelengths longer than 405 nm was practically not absorbed by freshly prepared Ag2S QD solution.
3 Investigated samples
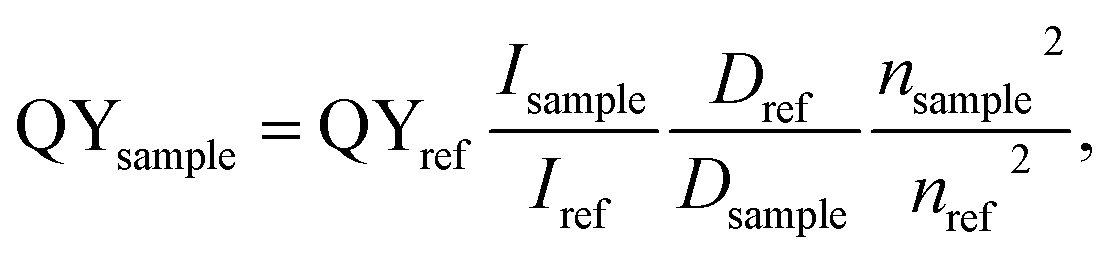
The synthesis of colloidal Ag2S QDs passivated with 2-MPA was carried out in ethylene glycol. The precursors were AgNO3 of an ACS purity (Sigma-Aldrich) and 97% 2-mercaptopropionic acid (Alfa-Aesar). In the crystallization process, 2-MPA was used both as the sulfur source and as the passivating agent for QD interfaces. The molar ratio [AgNO3]![[thin space (1/6-em)]](https://www.rsc.org/images/entities/char_2009.gif) :[2-MPA] was 1:2. In the synthesis, 2.4 mmol (408 mg) of AgNO3 was dissolved in 30 ml of ethylene glycol under constant stirring with a magnetic stirrer at 200 rpm in a thermostatic glass flask at a temperature of 25 °C. According to works,24–27,31–33 the synthesis of Ag2S QDs passivated with mercaptopropionic acid can be carried out at temperatures of 20–145 °C. The use of a low temperature (20–25 °C) leads to a decrease in the growth rate of colloidal QDs, which, as a rule, makes it possible to obtain Ag2S QDs with small size (∼1.5–2.0 nm).27 After that, 4.8 mmol (513.6 mg) of 2-MPA was dissolved in ethylene glycol and added to the flask with the solution. In this case, the solution acquired a pale yellow color and a pungent odor caused by esterification of ethylene glycol with 2-MPA.37 After 30 minutes of stirring, the solution of colloidal QDs was kept at room temperature for 24 hours. After that, the colloidal solution was exposed to 405 nm laser radiation with an optical power of 100 mW under constant stirring. Radiation wavelength corresponds to the absorption region of a freshly prepared Ag2S QD solution. The used optical power provides the conditions for the smooth Ag2S/2-MPA QD growth and the achievement of the highest luminescence QY as a result of exposure. Samples for measurements were collected every 10 hours.
:[2-MPA] was 1:2. In the synthesis, 2.4 mmol (408 mg) of AgNO3 was dissolved in 30 ml of ethylene glycol under constant stirring with a magnetic stirrer at 200 rpm in a thermostatic glass flask at a temperature of 25 °C. According to works,24–27,31–33 the synthesis of Ag2S QDs passivated with mercaptopropionic acid can be carried out at temperatures of 20–145 °C. The use of a low temperature (20–25 °C) leads to a decrease in the growth rate of colloidal QDs, which, as a rule, makes it possible to obtain Ag2S QDs with small size (∼1.5–2.0 nm).27 After that, 4.8 mmol (513.6 mg) of 2-MPA was dissolved in ethylene glycol and added to the flask with the solution. In this case, the solution acquired a pale yellow color and a pungent odor caused by esterification of ethylene glycol with 2-MPA.37 After 30 minutes of stirring, the solution of colloidal QDs was kept at room temperature for 24 hours. After that, the colloidal solution was exposed to 405 nm laser radiation with an optical power of 100 mW under constant stirring. Radiation wavelength corresponds to the absorption region of a freshly prepared Ag2S QD solution. The used optical power provides the conditions for the smooth Ag2S/2-MPA QD growth and the achievement of the highest luminescence QY as a result of exposure. Samples for measurements were collected every 10 hours.
The samples were purified by dialysis through a semi-permeable membrane from regenerated cellulose. In the process of dialysis, the QD solution was poured into a closed cellulose pouch which was placed in a container with distilled water. The pore size (∼3 nm) was selected such as to allow low molecular weight compounds (reaction products, water, and ethylene glycol) and hold quantum dots due to their larger hydrodynamic radius. As a result of osmosis and diffusion, ethylene glycol and reaction products were gradually dissolved in water, penetrated the membrane, and thus were removed when the container was refilled with water. Water with dissolved salts was changed every 30 minutes. The content of salts was controlled by the conductivity of the solution. In the framework of this technique, the smallest QDs (∼1–1.5 nm) also passed through the membrane and were thus removed. The samples were stable during storage and retained their physical and optical properties for a long period (from several months to a year) when stored in a cold, dark place in a closed glass container.
4 Results and discussion
4.1 Structural data
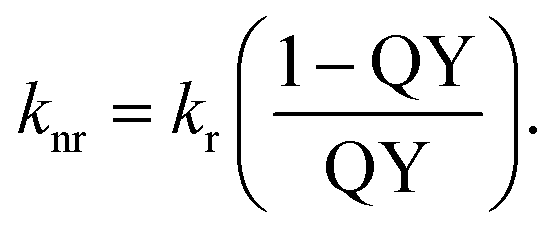
Fig. 1c and d shows the TEM images of Ag2S QDs before and after exposure by exciting radiation. It is seen that individual nanoparticles with an average size of 1.7 nm with a size dispersion within 45% are formed initially as a result of “dark” crystallization.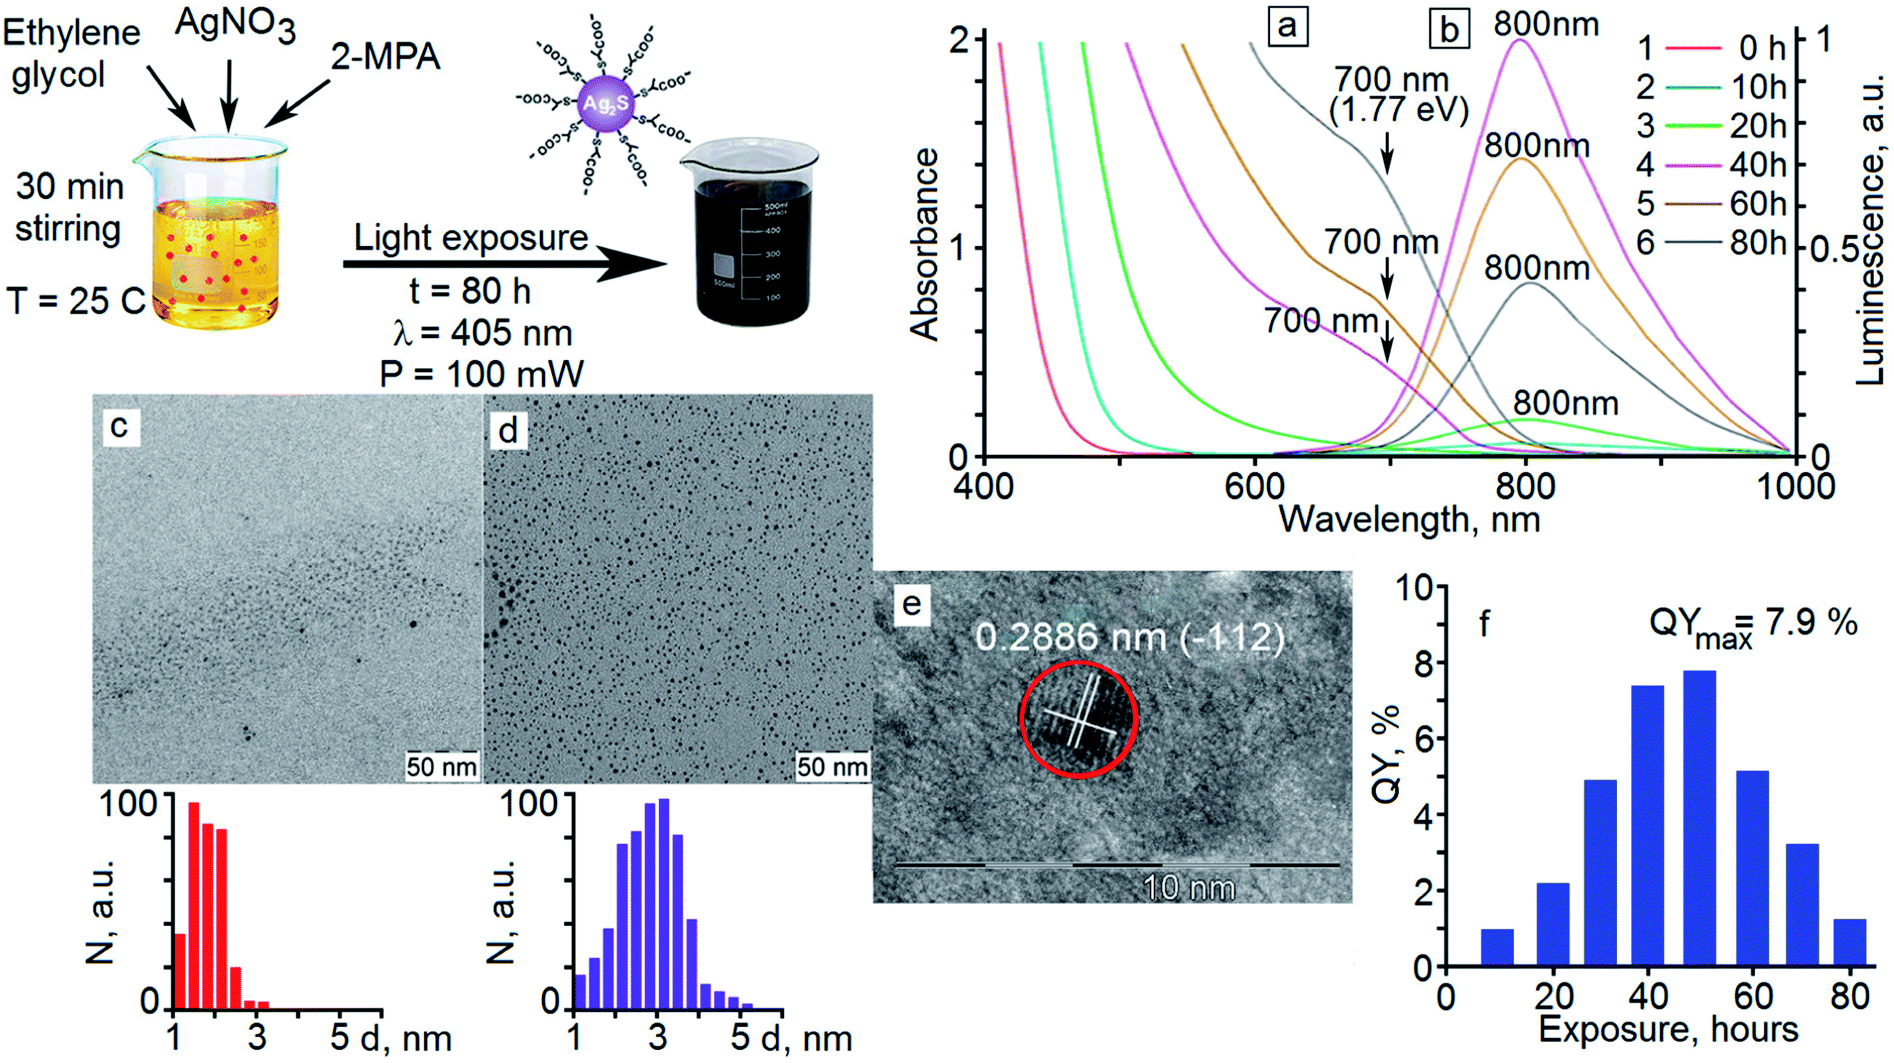 | ||
| Fig. 1 Absorption (a) and luminescence (b) spectra of colloidal Ag2S/2-MPA QDs and their transformation under laser irradiation (405 nm, 100 mW); TEM images and size distribution histograms for colloidal Ag2S QDs before (c) and after (d) 80 hour exposure; HR-TEM image of obtained Ag2S QDs (e) and histogram of changes in the luminescence quantum yield of Ag2S/2-MPA QDs during irradiation (f). | ||
The analysis of the TEM data shows that under exposure of the samples to 405 nm laser radiation with a power of 100 mW, Ag2S quantum dots are enlarged. When the exposure time had been increased from 10 hours to 40 hours, a gradual increase in the average nanoparticle size was observed from 1.7 nm to 2.8 nm. As a result of further exposure at times from 40 to 80 hours, an increase in the average size did not occur. It was observed a recrystallization, as a result of which the nanocrystals fraction with the smallest sizes (less than 2 nm) decreased. In this case, the nanocrystals fraction with the size of 2.8 nm in the investigated sample increases. Thus, the size distribution diagram narrowed on the side of small nanocrystals and size dispersion decreased from 45% to 30%. The average diameter value for Ag2S QDs after exposure for 80 hours was 2.8 nm with a size dispersion of about 30% (Fig. 1d).
The analysis of the HR-TEM data for Ag2S QDs (Fig. 1e) shows diffraction from the (−112) crystallographic plane of the monoclinic crystal lattice of Ag2S (spatial group P21/c)38 with an interplanar distance of 0.2886 ± 0.005 nm (Fig. 1e).
DLS data analysis of a freshly prepared Ag2S/2-MPA QDs solutions showed the presence of spherical particles with an average size of 2.5 nm (Fig. 2a). The obtained values differ from the TEM data. The observed differences are due to the fact that the sizes obtained from DLS represent the hydrodynamic diameter of the particles in the solution, that value should be a little overestimated, which was observed by us. For an Ag2S/2-MPA QDs sample subjected to the photoexposure for 20 hours (Fig. 2b), an increase in the average nanoparticles hydrodynamic size to 3.5 nm is observed. As a result of further photoexposure for 40 hours (Fig. 2c), the particle size increased slightly. For the sample exposured for 80 hours (Fig. 2d), the average particle size remained at 3.5 nm.
 | ||
| Fig. 2 DLS results (a–d), FTIR spectra (e) and XRD (f) of colloidal Ag2S/2-MPA QDs. | ||
Fig. 2f shows the results of XRD analysis of Ag2S/2-MPA QD samples. In the case of the initial Ag2S/2-MPA QD sample with an average size of 1.7 nm (Fig. 2f, curve 1), a wide halo with a diffuse feature in the 2θ angle range of 25–50° is observed. Such regularities is characteristic of the low-ordered Ag2S monoclinic crystal lattice, which presence was established by HR-TEM. Diffuse blurring in this case is due to the abundance of crystallographic planes in the monoclinic lattice and the corresponding reflexes in the X-ray diffraction pattern. The reflexes broadening as a result of the size effect leads to the formation of a wide unstructured band. Similar effects were observed in works26,39–42 for Ag2S QDs with sizes less than 7 nm. The size increasing, which is a result of exposure for 20 minutes (Fig. 2f, curve 2) leads to the formation of additional features on the diffraction pattern, that position corresponds to the Ag2S monoclinic crystal lattice, which is completely consistent with HR-TEM data. A further exposure time increasing and resulting enlargement of nanocrystals lead to the formation of a more structured diffraction pattern (Fig. 2f, curve 3). The obtained data confirm the conclusion about the formation of crystalline Ag2S particles with a monoclinic crystal lattice with an average size less than 5 nm.
4.2 FTIR spectra
Fig. 2e shows FTIR spectra of pure 2-MPA, as well as Ag2S QDs coated with 2-MPA molecules (Ag2S/2-MPA). FTIR spectra of Ag2S/2-MPA QDs after 40 hours exposure with 405 nm radiation before and after dialysis are also presented. It is seen that the FTIR spectra of 2-MPA and all Ag2S/2-MPA QD samples are very different. This indicates an interaction between 2-MPA molecules and the QD interface.In each of the FTIR spectra of Ag2S/2-MPA QDs (Fig. 2e, curves 2 and 3), there was no peak corresponding to the S–H-group stretching vibrations of 2-MPA (2560 cm−1), which indicates the occurrence of interactions between sulfur of 2-MPA and dangling bonds of Ag2S nanocrystals interfaces.42 In addition, peaks of stretching asymmetric and symmetric vibrations of the carboxyl (COO−) group appear (1560 cm−1 and 1390 cm−1, respectively), which indicates the adsorption of 2-MPA molecules on Ag2S interfaces in ionic form with a free carboxyl terminal COO−-group.26,42–44 The ratio of the peaks intensities of the stretching asymmetric and symmetric vibrations of the carboxyl COO−-group in the two cases under consideration (Fig. 2e, curves 2 and 3) corresponds to the situation when the carboxyl groups are not attached to the Ag2S QDs interface.
 | ||
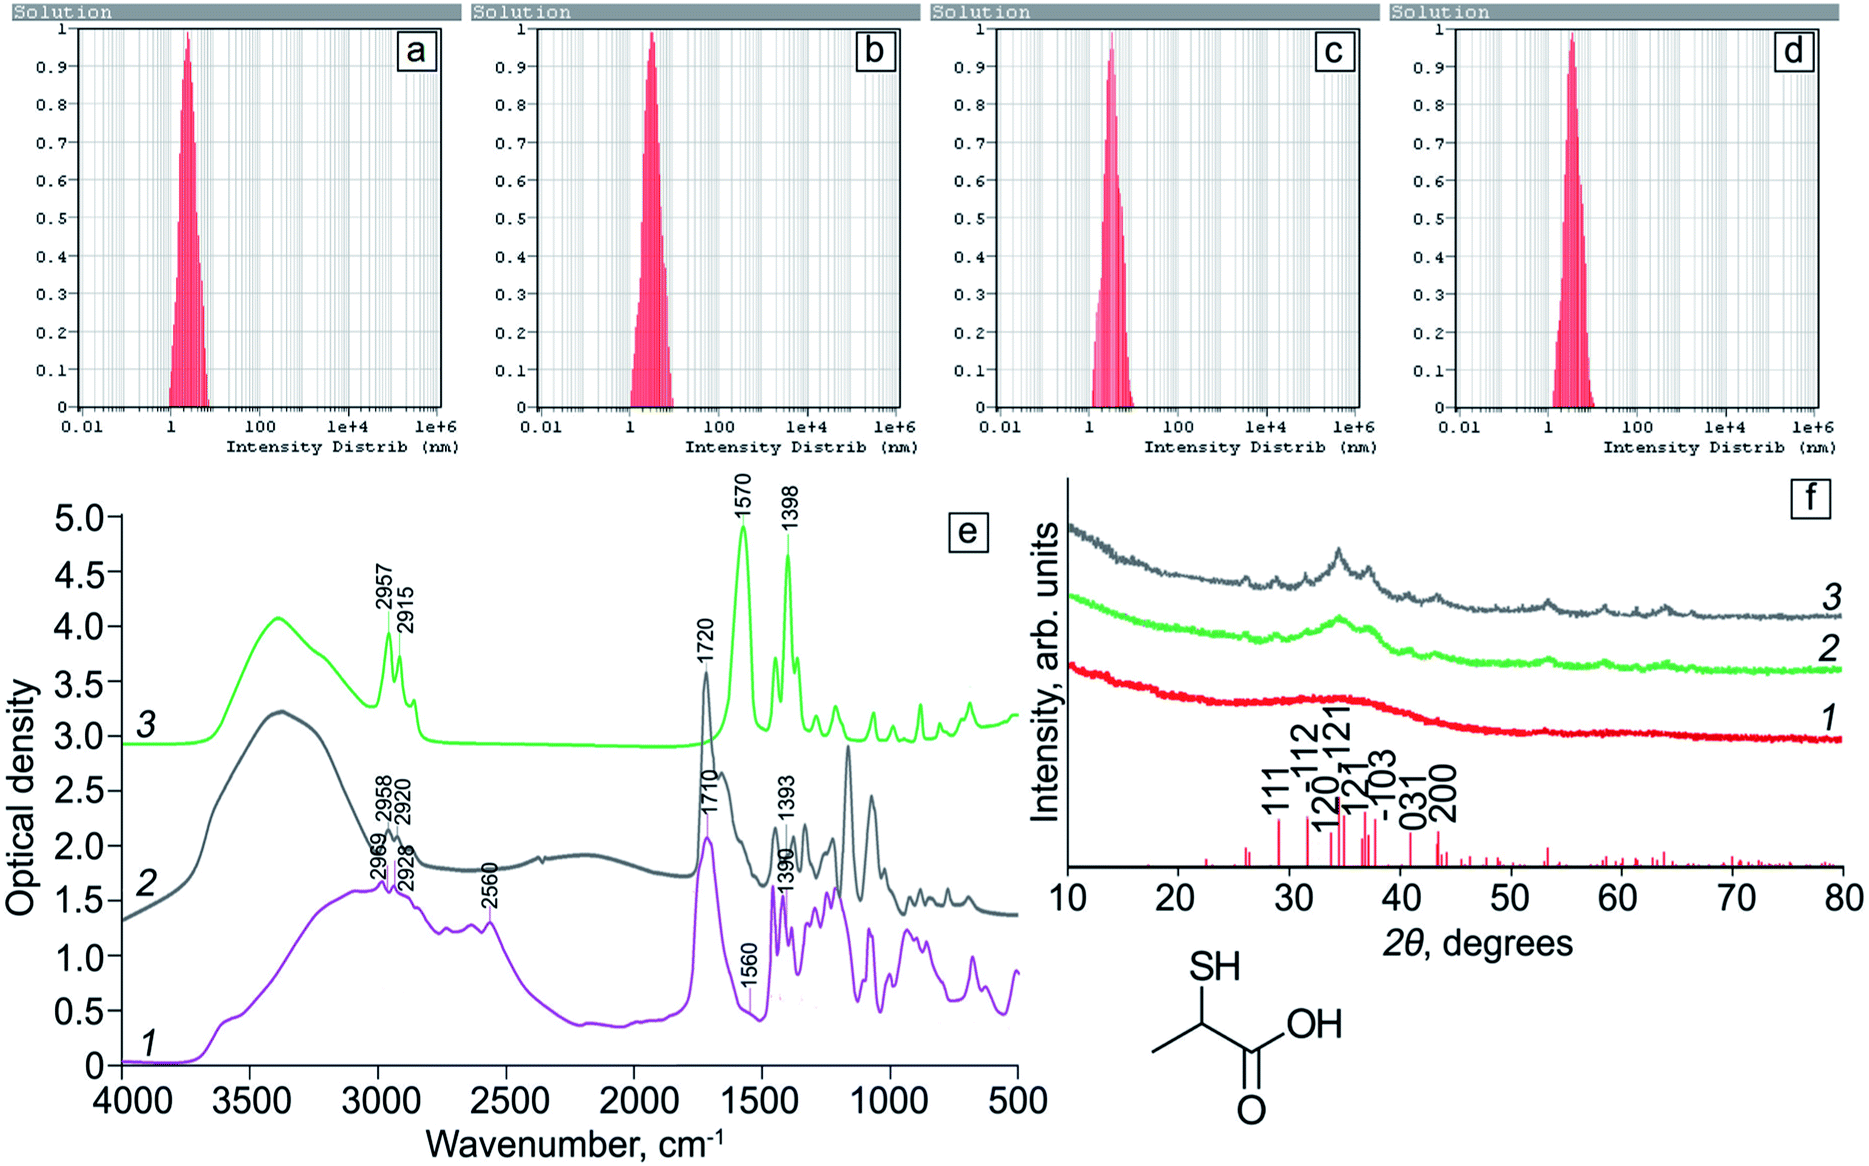
| Fig. 3 Luminescence decays for samples of Ag2S/2-MPA QDs for different exposure times: 20 hours (a), 40 hours (b), 60 hours (c). | ||
Thus, the data obtained from FTIR spectra indicate that the adsorption of 2-MPA molecules at the Ag2S QDs interfaces is carried out mainly via sulfur atoms. The presence of stretching asymmetric and symmetric vibrations peaks of the carboxyl COO−-group (1560 cm−1 and 1390 cm−1) and their intensities ratio show that the carboxyl groups are not fixed on Ag2S QD interface.
4.3 Optical absorption spectra
In the optical absorption spectra of freshly synthesized samples of Ag2S/2-MPA QDs, a broad unstructured band with an edge in the region of 450–470 nm (Fig. 1a, curve 1) is observed. The absorption edge is positioned at 1.5–1.6 eV, which is larger than the band gap of bulk Ag2S crystals with a monoclinic crystal lattice (1.09 eV).28,45 The observed difference is due to quantum confinement in the optical absorption spectra. The absence of the feature corresponding to the main exciton transition in QDs in the absorption spectra of freshly prepared Ag2S QDs samples is probably caused by large size dispersion of the nanocrystals (45%).Exposure to 405 nm radiation with a power of 100 mW leads to a long-wavelength shift of the edge of the optical absorption band to 490–500 nm (10 hour exposure) and then to 580–600 nm (20 hour exposure) (Fig. 1a, curves 2 and 3). Starting from the 40 hour exposure, a characteristic feature appears in the absorption spectrum near 700 nm (Fig. 1a, curves 4–6), which retains its position during further exposure. The position of the feature associated with the most probable exciton transition in the optical absorption was found from the minimum of the second derivative for the optical density spectra with respect to the incident radiation energy d2D/d(ℏω)2. The obtained transition energy is ∼1.77 eV (700 nm).
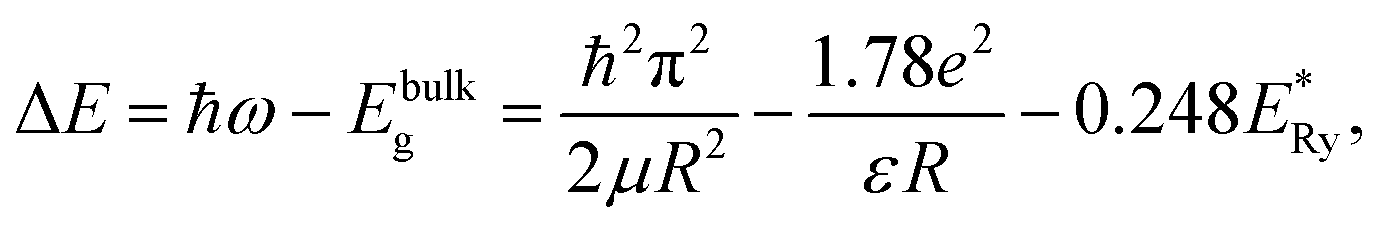
Estimates of the QD sizes from the absorption spectra (Fig. 1) were made by the relation:46
 | (2) |
 and
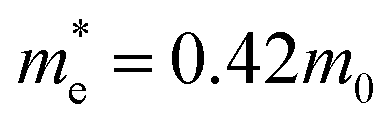
and 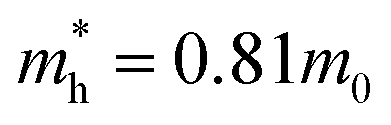 are electron and hole effective masses,45 ε = 5.95,42,45
 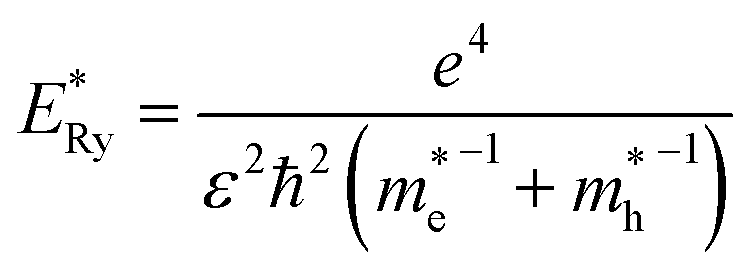 is the effective Rydberg energy.
The estimates by relation (2) show an increase in the average size of Ag2S/2-MPA QDs from 1.98 nm to 2.06 nm (10 hours), 2.46 nm (20 hours), 2.76 nm (40–80 hours) during the exposure. The satisfactory agreement was found between the results obtained from the optical absorption spectra and the TEM analysis (images in Fig. 1c and d). The analysis showed an increase in the average size of Ag2S/2-MPA QDs from 1.7 to 2.8 nm, with the dispersion decreasing from 45% to 30%.
For exposures of 40–80 hours, no long-wave shift of the characteristic feature was observed in the optical absorption spectra. Herewith, an increase in the optical density at 700 nm and a change in its spectral shape indicate saturation of the process of increasing the QD sizes, which results in the growth of the concentration of the QDs with the same size.
4.4 Luminescence properties
For freshly prepared samples of Ag2S/2-MPA QDs (average size near of 1.7 nm), no luminescence bands are observed in the visible and NIR regions. During the exposure of the colloidal solution to 405 nm laser radiation with a power of 100 mW, luminescence with a maximum at 800 nm occurs (Fig. 1b, curves 2–6). The large FWHM and Stokes shift (100 nm) evidence for a recombination luminescence mechanism. With increasing the time of exposure of colloidal solutions to 405 nm radiation, there is no significant shift of the maximum of the luminescence band or changes in its FWHM. However, a significant increase in the PL intensity is observed initially (Fig. 1b, curves 2–4), followed by its decrease (Fig. 1b, curves 5 and 6). Simultaneously with an increase in the luminescence intensity during photoexposure of a colloidal solution, according to TEM, the QDs concentration with a size of about 2.8 nm increases in the sample. Apparently, these QDs have a high luminescence QY. In this case, the absence of the luminescence band maximum shift during photoexposure is due to the fact that only predominantly the same size QDs (about 2.8 nm) participate in the sample luminescence. Smaller nanocrystals have a larger specific surface area. They are practically nonluminescent due to the high concentration of non-radiative recombination channels. The measured luminescence quantum yield of the samples (Fig. 1f) reveals a discrepancy between the changes in the quantum yield and the luminescence intensity of the QDs, which is obviously caused by the change in the optical density of the QDs during their growth.The exposure of the colloidal solution of Ag2S/2-MPA QDs for 10 hours provides the luminescence quantum yield of 1%. Increasing the exposure time provides the luminescence quantum yields of 1.9% (20 hours), 5.0% (30 hours), 7.7% (40 hours), and 7.9% (50 hours). After the exposure of 60 hours, the luminescence quantum yield decreases to 5.5%, and to 1.6% at a maximum exposure of 80 hours.
The detected change in the luminescence QY, and especially its drop at exposure times of more than 50 hours, cannot be explained only by a change in the QDs average size in the sample. It is known that, under the influence of laser radiation, the colloidal QDs degrade, and new channels of non-radiative recombination are formed.10,11 To elucidate the factors responsible for the observed nonmonotonic dependence of the luminescence QY of Ag2S/2-MPA QDs on the exposure time, luminescence decays were analyzed for the investigated samples (Fig. 3).
For all samples under study, the luminescence decay curves had a complex multiexponential character and different luminescence decay rates. To describe the luminescence decay curves, a sum of exponentials was used. High reliability of the fitting was achieved by using a sum of three exponents:
 | (3) |
| QY = krτi. | (4) |
Nonradiative recombination rates knr can be determined from the relation
 | (5) |
The average lifetimes and recombination rates obtained are given in Table 1. It can be seen from these data that the changes in the radiative recombination rate during the exposure are much smaller than the changes in the nonradiative recombination rate. This fact indicates that at the same time as the concentration of Ag2S QDs with size of about 2.8 nm increases, at exposure times up to 50 hours, the probability of nonradiative recombination also decreases. Apparently, this is due to the QDs recrystallization and decrease in the concentration of surface defects that acting as quenching centers. Therefore, the main cause of the QY increase after 40 hour laser irradiation is the decrease in the nonradiative recombination rate, i.e., laser exposure leads to not only an increase in the QDs size but also provides a decrease in the concentration of defects that act as luminescence quenchers.
| Exposure time (hours) | Average size (nm) | QY | 〈τ〉 (ns) | kr (s−1) | knr (s−1) |
|---|---|---|---|---|---|
| 20 | 2.46 | 0.019 | 60 | 3.1 × 10⁵ | 1.6 × 10⁷ |
| 40 | 2.76 | 0.077 | 190 | 4.05 × 10⁵ | 0.4 × 10⁷ |
| 60 | 2.76 | 0.055 | 102 | 5.4 × 10⁵ | 0.9 × 10⁷ |
The results obtained show that the synthesized colloidal Ag2S/2-MPA QDs have IR luminescence with significant (QY ∼ 7–8%) quantum yield, which nonmonotonically changes during laser irradiation of the colloidal solution. The enhancement of the luminescence decay at decreasing QY points to the formation of luminescence quenching channels due to crystal photolysis, or due to the destruction of the passivating 2-MPA layer. Nonradiative resonant energy transfer from IR luminescence centers in colloidal Ag2S/2-MPA QDs to the quenching centers arising upon laser irradiation of the samples is possible. The formation of new nonradiative recombination centers is also supported by a decrease in the value of degradation of the luminescence intensity as well as by the deceleration of its rate at low temperatures (77 K). Apparently, photolysis of Ag2S nanocrystals plays a significant role here.
It should be stressed that photochemical decomposition of silver sulfide nanocrystals has been noted.29,30,47 In,47 reduction of Ag2S nanoparticles to Ag nanoparticles and/or formation of Ag2S/Ag hybrid complexes were observed in a colloidal solution under UV irradiation. In papers,29,30 photoinduced growth of Ag2S QDs was mentioned.
Deceleration of luminescence decays with a simultaneous increase in the quantum yield, on the contrary, is a manifestation of healing of the interface defects. If occurring near the interface defects (such as adsorbed atoms and small clusters of silver atoms), 2-MPA molecules can interact with them and convert them into silver sulfide. This process will lead to an increase in the luminescence intensity and QY for Ag2S/2-MPA QDs.
Participation of reaction products in this process is most probable. To validate this hypothesis, the sample with the maximum quantum yield (40 hour exposure time, QY = 7.7%) was purified from reaction products by dialysis. It turns out that the purification of the sample leads to the appearance of a pronounced maximum in the optical absorption spectrum at the place of the spectral feature observed for the initial colloidal solutions (Fig. 4a, curves 1 and 2). The maximum is shifted to 721 nm, which corresponds to a transition energy of 1.72 eV. The decrease in the optical density and the long-wavelength shift of the ground state exciton absorption are obviously caused by a decrease in the concentration of quantum dots in the colloidal solution, a decrease in the size dispersion, and a certain increase in the QD average size due to the elimination of small crystals during the dialysis. TEM images of dialyzed samples (Fig. 4c) show a decrease in the quantity of small-size QDs (up to 2.5 nm). The hydrodynamic radius of small QDs from the ensemble allows their diffusion through the membrane pores. This approach leads to an increase in the monodispersity of the QDs during the dialysis.
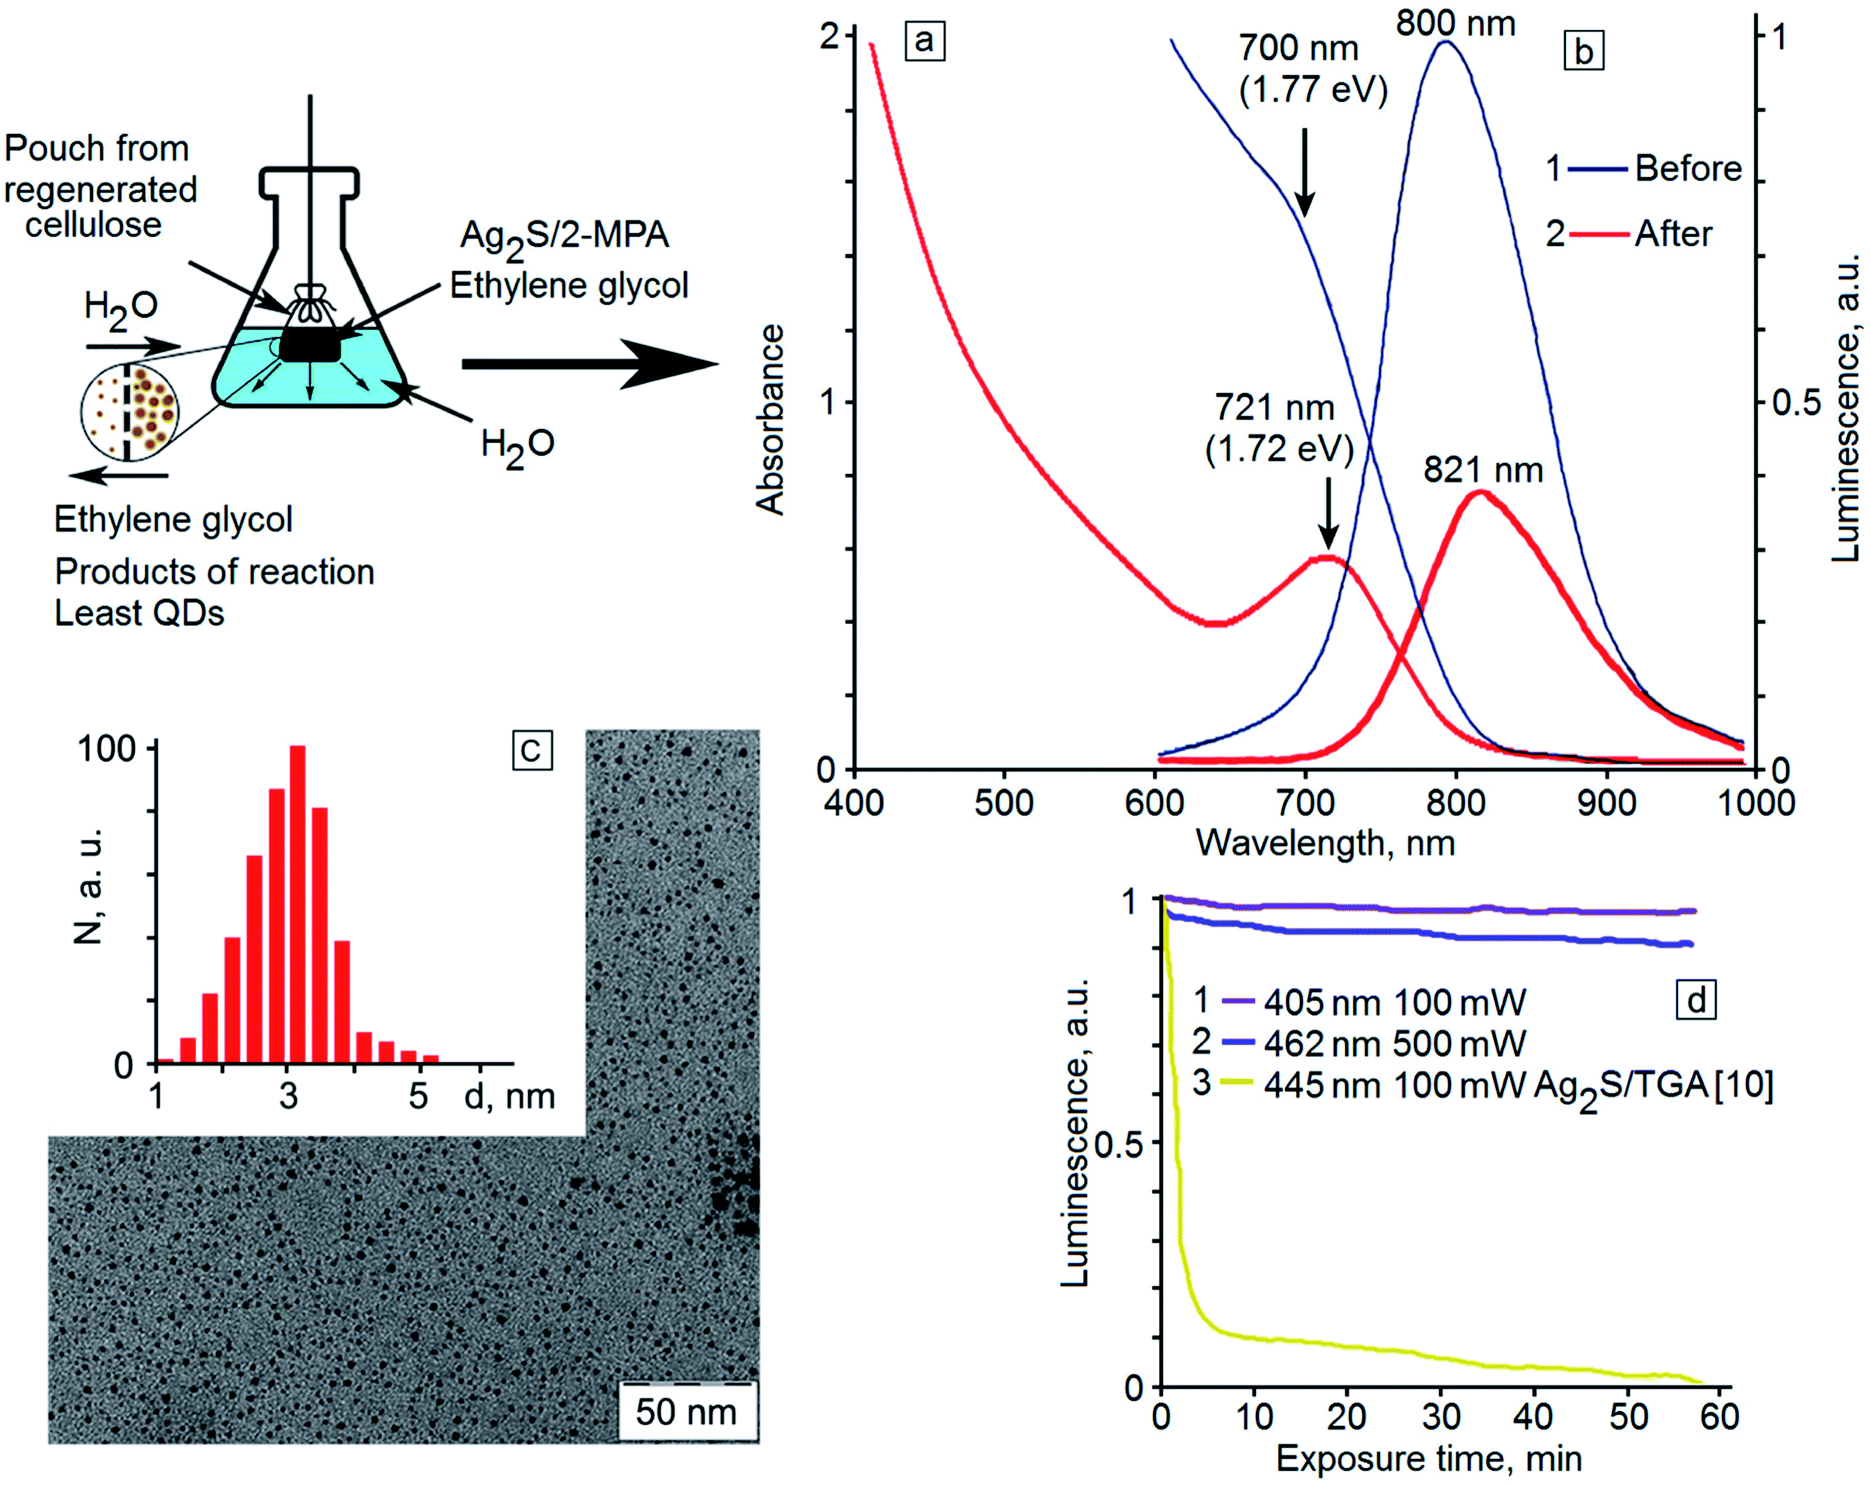 | ||
| Fig. 4 Optical absorption (a) and photoluminescence (b) spectra of Ag2S/2-MPA QDs before (1) and after (2) dialysis; TEM images of QDs after (c) dialysis; results of photostability measurements for dialyzed colloidal Ag2S QDs (d). | ||
During the dialysis, a reduction in the intensity of the sample emission is seen in the luminescence spectrum (Fig. 4b, curve 2) together with a 21 nm shift of the luminescence peak to the long-wavelength region. However, the luminescence QY has not changed during the dialysis of the sample. It should be noted that in the dialysis, not only removal of the reaction by-products occurs but also a change of the solvent of Ag2S QDs from ethylene glycol to water. It is noteworthy that no QY drop is detected. According to the obtained data, the luminescence QY is different for Ag2S QDs with different sizes. In particular, for Ag2S QDs with size less than 2 nm, it is equal to zero, and for Ag2S QDs with an average size of about 2.8 nm, it is nonzero. According to the TEM, absorption and luminescence spectroscopy data, when the exposure time was up to 50 hours, the concentration of the smallest (less than 2 nm) nonluminescent QDs decreased and the concentration of well-luminescent QDs (size about 2.8 nm) increased. For dialysis it was used the sample in which the concentration of small QDs was minimal and their removal could not significantly increase the luminescence QY. Moreover, during dialysis, the replacement of the solvent occurs. Ethylene glycol is replaced by water. It is known that the quantum yield of various solutions of phosphors is determined by the nature of the solvent. This fact greatly complicates the determination of the effect of an increase in the average QD size during dialysis on the quantum yield. Water, as a rule, acts as a luminescence quencher, especially for phosphors with emission in the infrared region. In this case, the increase in the quantum yield caused by the increase in the average size of Ag2S QDs during dialysis will be compensated by the increased quenching the solvent.
The dialyzed sample was exposed to 405 nm radiation with a power of 100 mW, and also to 462 nm radiation with a power of 0.5 W. The dependence of the luminescence intensity of Ag2S QDs on the exposure time is presented in Fig. 4. It turned out that the dialyzed Ag2S/2-MPA QDs reveal high photostability of the luminescence QY. The photoluminescence intensity of the sample does not actually change for a long time (60 minutes), especially in comparison with Ag2S QD samples passivated with TGA molecules (Fig. 4d, curve 3).10 Even under exposure to high-power radiation, the luminescence intensity decreases only by 10% within one hour of exposure. However, the reversibility of this degradation, as in the case of Ag2S QD samples passivated with TGA,10 was not observed.
At irradiation of the dialyzed sample, the absorption spectra did not change, in contrast to the case of photoinduced growth of the initial sample. This fact indicates that the growth of QDs occurring before the dialysis is completely stopped after it. Thus, dialysis of colloidal QDs during photoinduced synthesis in ethylene glycol provides several advantages. It facilitates the replacement of the ethylene glycol with water without the QY drop, as well as purification of the solution from the reaction by-products. In this case, the growth process is ceased reaching the required spectral properties and an increase in the monodispersity of QDs is achieved. Therewith, hydrophilic samples of colloidal solutions of Ag2S quantum dots are formed, which have high photostability, long shelf life with the stability of spectral-luminescent properties.
In this case, there are formed hydrophilic samples of colloidal solutions of Ag2S quantum dots, which have high photostability and long shelf life with the spectral-luminescent properties being retained.
5 Conclusions
In this work, the results on the study of the effect of laser irradiation on the luminescent properties of colloidal Ag2S/2-MPA QDs during their photoinduced synthesis in ethylene glycol are presented. It is shown that the exposure leads to an increase and improvement in the monodispersity of Ag2S QDs, as well as to an increase in their luminescence quantum yield. The synthesized QDs reveal excellent luminescent properties and have the maximum of the luminescence band at a wavelength of 800 nm, which corresponds to the region of the first therapeutic transparency window of biological tissues; high quantum yield and long average luminescence lifetime are also demonstrated for the QDs. Using the data obtained by the time-correlated single-photon counting technique, it is shown that the increase in the quantum yield of QDs is accompanied by an increase in the average luminescence lifetime, which is interpreted as the formation of stable radiative recombination centers under laser irradiation. The employment of dialysis for QD purification from the reaction products does not lead to a change in their luminescent properties but provides a means to completely stop the QD growth. The study of the photostability of these samples showed that QDs obtained in such a way have excellent stability of luminescence properties. Thus, a convenient method for controlling the quantum yield and monodispersity of Ag2S/2-MPA QDs has been developed, which ensures long luminescence lifetimes of up to 190 ns, relatively high quantum yield, and excellent photostability.Conflicts of interest
There are no conflicts to declare.Acknowledgements
Results of TEM investigations with the Libra 120 TEM were obtained on the equipment of the Center of collective usage of scientific equipment of Voronezh State University. High-resolution TEM images were obtained on the equipment of the Center of collective usage of Moscow Institute of Physics and Technology. This study was supported by the Russian Science Foundation under project no. 19-12-00266.Notes and references
- T. Freckera, D. Baileya, X. Arzeta-Ferrera, J. McBridea and S. J. Rosenthal, ECS J. Solid State Sci. Technol., 2016, 5, R3019–R3031 CrossRef.
- M. Hu and T. Zhu, Nanoscale Res. Lett., 2015, 10, 469–497 CrossRef PubMed.
- E. Petryayeva, W. R. Algar and I. L. Medintz, Appl. Spectrosc., 2013, 67, 215–252 CrossRef CAS PubMed.
- I. L. Medintz, H. T. Uyeda, E. R. Goldman and H. Mattoussi, Nat. Mater., 2005, 4, 435–446 CrossRef CAS PubMed.
- D. Bera, L. Qian, T.-K. Tseng and P. H. Holloway, Materials, 2010, 3, 2260–2345 CrossRef CAS.
- J. Weng and J. Ren, Curr. Med. Chem., 2006, 13, 897–909 CrossRef CAS PubMed.
- L. Shao, Y. Gao and F. Yan, Sensors, 2011, 11, 11736–11751 CrossRef PubMed.
- J. Liu, C. Xie, Y. Zhang, S. P. W. Hu, G. You and J. Xu, MRS Proceedings, 2011, 1286, 152–157 CrossRef.
- D. Schmidmayr, J. Zehetner and P. Amann, 10th International Conference on Advanced Semiconductor Devices & Microsystems, 2014, vol. 1–4 Search PubMed.
- M. S. Smirnov, O. V. Ovchinnikov, I. G. Grevtseva, A. I. Zvyagin, A. S. Perepelitsa and R. Ganeev, Opt. Spectrosc., 2018, 124, 681–686 CrossRef CAS.
- O. V. Ovchinnikov, I. G. Grevtseva, M. S. Smirnov and T. S. Kondratenko, J. Lumin., 2019, 207, 626–632 CrossRef CAS.
- M. S. Smirnov and O. V. Ovchinnikov, J. Lumin., 2019, 213, 459–468 CrossRef CAS.
- K. V. Vokhmintcev, C. Guhrenz, N. Gaponik, I. Nabiev and P. S. Samokhvalov, J. Phys.: Conf. Ser., 2017, 784, 012014 CrossRef.
- A. Shchukina, I. Eremchev and A. Naumov, Phys. Rev. E: Stat., Nonlinear, Soft Matter Phys., 2015, 92, 032102 CrossRef CAS PubMed.
- I. Eremchev, M. Eremchev and A. Naumov, Phys. Uspekhi, 2019, 62, 294–303 CrossRef CAS.
- A. Naumov, EPJ Web Conf., 2017, 132, 01009 CrossRef.
- P. Senellart, G. Solomon and A. White, Nat. Nanotechnol., 2017, 12, 1026–1039 CrossRef CAS PubMed.
- L. Hanschke, K. A. Fischer, S. Appel, D. Lukin, J. Wierzbowski, S. Sun, R. Trivedi, J. Vučković, J. Finley and K. Müller, npj Quantum Inf., 2018, 4, 43 CrossRef.
- G. Hong, J. T. Robinson, Y. Zhang, S. Diao, A. L. Antaris, Q. Wang and H. Dai, Angew. Chem., Int. Ed., 2012, 51, 9818–9821 CrossRef CAS PubMed.
- Y. Zhang, Y. Zhang, G. Hong, W. He, K. Zhou, K. Yang, F. Li, G. Chen, Z. Liu, H. Dai and Q. Wang, Biomaterials, 2013, 34, 3639–3646 CrossRef CAS PubMed.
- Y. Zhang, G. Hong, Y. Zhang, G. Chen, F. Li, H. Dai and Q. Wang, ACS Nano, 2012, 6, 3695–3702 CrossRef CAS PubMed.
- S. B. Brichkin and V. F. Razumov, Russ. Chem. Rev., 2016, 85, 1297–1312 CrossRef CAS.
- P. Jiang, C. Zhu, Z. Zhang, Z. Tian and D. Pang, Biomaterials, 2012, 33, 5130–5135 CrossRef CAS PubMed.
- Y. Shu, P. Jiang, D. Pang and Z. Zhang, Nanotechnology, 2015, 26, 275701 CrossRef PubMed.
- R. Zhang, X. Xue, Z. Zhuang, J. Zhengac and Z. Lin, Chem. Commun., 2015, 51, 6141–6144 RSC.
- R. Tang, J. Xue, B. Xu, D. Shen, G. P. Sudlow and S. Achilefu, ACS Nano, 2015, 9, 220–230 CrossRef CAS PubMed.
- F. Duman, I. Hocaoglu, D. Ozturk, D. Gozuacik, A. Kirazac and H. Y. Acar, Nanoscale, 2015, 14, 11229–11472 Search PubMed.
- W. P. Lim, Z. Zhang, H. Y. Low and W. S. Chin, Angew. Chem., Int. Ed., 2004, 43, 5685–5689 CrossRef CAS PubMed.
- M. Karimipour, M. Bagheri and M. Molaei, J. Electron. Mater., 2019, 48, 2555–2562 CrossRef CAS.
- Y. Cao, W. Geng, R. Shi, L. Shang, G. I. N. Waterhouse, L. Liu, L.-Z. Wu, C.-H. Tung, Y. Yin and T. Zhang, Angew. Chem., Int. Ed., 2016, 55, 1–6 CrossRef.
- O. V. Ovchinnikov, M. S. Smirnov, T. S. Kondratenko, A. S. Perepelitsa, I. G. Grevtseva and S. V. Aslanov, Opt. Spectrosc., 2018, 125, 107–112 CrossRef CAS.
- O. V. Ovchinnikov, M. S. Smirnov, B. I. Shapiro, T. S. Shatskikh, A. S. Perepelitsa and N. V. Korolev, Semiconductors, 2015, 49, 373–379 CrossRef CAS.
- T. S. Kondratenko, A. I. Zvyagin, M. S. Smirnov, I. G. Grevtseva, A. S. Perepelitsa and O. V. Ovchinnikov, J. Lumin., 2018, 208, 192–200 Search PubMed.
- S. Reindl, A. Penzkofer, S.-H. Gong, M. Landthaler, R. Szeimes, C. Abels and W. Baumler, J. Photochem. Photobiol., A, 1997, 105, 65–68 CrossRef CAS.
- Principles of Fluorescence Spectroscopy, ed. J. R. Lakowicz, Springer, New York, 3rd edn, 2006 Search PubMed.
- H. El-Kashef, Phys. Rev. B: Condens. Matter Mater. Phys., 2000, 279, 295–301 CrossRef CAS.
- Compendium of Chemical Terminology, ed. A. D. McNaught and A. Wilkinson, International Union of Pure and Applied Chemistry, New York, 2nd edn, 1997 Search PubMed.
- A. J. Frueh, Z. Kristallogr., 1958, 110, 136–144 CrossRef CAS.
- Y. Zhang, Y. Liu, C. Li, X. Chen and Q. Wang, J. Phys. Chem., 2014, 118, 4918–4923 CrossRef CAS PubMed.
- C. Qing, G. Ying, L. Xiwen and C. Cun, IOP Conference Series: Earth and Environmental Science, 2018, 186, 012076 Search PubMed.
- M. Karimipour, M. Bagheri, E. M. J. Johansson and M. Molaei, Mater. Technol., 2018, 33, 784–792 CrossRef CAS.
- I. Hocaoglu, M. N. Cizmeciyan, R. Erdem, C. Ozen, A. Kurt, A. Sennaroglu and H. Y. Acar, J. Mater. Chem., 2012, 22, 14674–14681 RSC.
- Y. Zhang, J. Xia, C. Li, G. Zhou, W. Yang, D. Wang, H. Zheng, Y. Du, X. Li and Q. Li, J. Mater. Sci., 2017, 52, 9424–9429 CrossRef CAS.
- R. Gui, J. Sun, D. Liu, Y. Wang and H. Jinc, Dalton Trans., 2014, 43, 16690–16697 RSC.
- S. Lin, Y. Feng, X. Wen, P. Zhang, S. Woo, S. Shrestha, G. Conibeer and S. Huang, J. Phys. Chem., 2015, 119, 867–872 CAS.
- Y. Kayanuma, Phys. Rev. B: Condens. Matter Mater. Phys., 1988, 38, 9797–9805 CrossRef PubMed.
- S. V. Rempel, Y. V. Kuznetsova, A. A. Rempel and E. Y. Gerasimov, Phys. Solid State, 2017, 59, 1629–1636 CrossRef CAS.
| This journal is © The Royal Society of Chemistry 2019 |