
 Open Access Article
 This Open Access Article is licensed under a Creative Commons Attribution-Non Commercial 3.0 Unported Licence
Novel single excitation dual-emission carbon dots for colorimetric and ratiometric fluorescent dual mode detection of Cu2+ and Al3+ ions†
Jinping Songa,
Qi Ma *a,
Yequn Liu*b,
Yong Guoa,
Feng Fenga and
Shaomin Shuangc
*a,
Yequn Liu*b,
Yong Guoa,
Feng Fenga and
Shaomin Shuangc
aCollege of Chemistry and Environmental Engineering, Institute of Applied Chemistry, Shanxi Datong University, Datong, Shanxi 037009, China. E-mail: maqihx@163.com; Fax: +86-352-7158185; Tel: +86-352-7158185
bAnalytical Instrumentation Center, State Key Laboratory of Coal Conversion, Institute of Coal Chemistry, Chinese Academy of Sciences, Taiyuan 030001, China. E-mail: liuyequn@sxicc.ac.cn
cInstitute of Environmental Science, Shanxi University, Taiyuan, 030006, China
First published on 26th November 2019
Abstract
In this study, dual-emission carbon dots (D-CDs) are synthesized via a simple one-step solvothermal treatment of red tea. The obtained D-CDs are characterized by XPS, IR, TEM, XRD, fluorescence and UV-vis spectroscopy techniques. It is found that D-CDs present a strong red fluorescence emission peak at 671 nm and weak blue fluorescence emission peak at 478 nm under the excitation wavelength of 410 nm. The unique dual-emission properties of D-CDs provide great opportunities in ratiometric fluorescence sensing applications. The results show that Cu2+ ions can quench the fluorescence of the red emission band of D-CDs effectively, resulting in the disappearance of red fluorescence ultimately. Upon the addition of Al3+ ions, the fluorescence of blue emission band at 478 nm grows apparently, and the fluorescence color transforms gradually from red to orange, then to yellow-green. Based on these findings, a novel ratiometric fluorescence and colorimetric dual mode nanosensor is developed for simultaneous detection of Cu2+ and Al3+ ions. Regarding Cu2+ ions, the fluorescent detection linear range is 0.1–50 μM with detection limit of 0.1 μM, and the colorimetric detection limit is estimated as 25 μM. With regard to Al3+ ions, the fluorescent detection linear range is 0–20 μM and 25–100 μM with detection limit of 0.5 μM, and the colorimetric detection limit is 20 μM. Furthermore, the fluorescence response mechanisms of Cu2+ and Al3+ ions were discussed detailed. To the best of our current knowledge, this will be the first research work on the simultaneous determination of Cu2+ and Al3+ using D-CDs as fluorescent probes.
1. Introduction
Carbon dots (CDs), as a kind of extraordinary fluorescent nanomaterial, have attracted significant research interest because of their special properties including low toxicity, good water solubility and stability, and adjustable luminescence wavelength. In view of these unique properties, CDs have been widely used in optical sensing, bioimaging, drug delivery, photocatalysis and so on.1,2 So far, considerable efforts have been made aiming to reduce the cost, simplify the preparation process, increase fluorescence quantum yield, or realize long wavelength adjustable emission of CDs.3–7 However, preparations of CDs with the desired properties still face a crucial challenge, most of the reported CDs exhibit single-emission properties which can be affected by concentration, environment and excitation wavelength, limiting their applications seriously. Compared with the traditional single-emitting CDs (S-CDs), dual-emitting CDs (D-CDs) usually display two fluorescence emission bands at single excitation wavelength, as a result, exhibiting some potential application advantages.8,9 One significant advantage is that D-CDs can effectively improve the sensitivity and accuracy of the assay method by serving as ratiometric fluorescent sensing probe.10–13 Moreover, it even may achieve the simultaneous fluorescent determination of two different analytes without any other substances.9,14 Therefore, it is quite important to design D-CDs and further explore their potential applications.Up to now, ratiometric fluorescent nanoprobes based on D-CDs can be constructed by forming nanohybrid composites with other nanoparticles. For examples, Yan's research group used metal–organic framework (MOFs) as a carrier and then combined with red CDs and green Tb3+ to obtain dual-emitting hybrid system, which could successfully realize visual colorimetric detection for water contents and the relative humidity.15 Hereafter, they further achieved the ratiometric fluorescence sensing for copper ions by utilizing dual-emitting nanohybrid composites based on blue zirconium MOFs and red CDs.16 By encapsulating doped CDs in the structure of Eu-MOFs, Chi et al. prepared a red/blue dual-emitting ratiometric fluorescence nanoprobe to detect water content.17 Shangguan's research group coupled successfully CDs on the surface of dye-linked silica nanoparticles to develop a class of dual-emission nanosystem.18 Results showed that the addition of Cu2+ ion could bring about obvious ratiometric fluorescence response owing to the recognition interaction from the terminal ethylenediamine groups on CDs surface. In Xiang's research works,19,20 they found that this dual-emission nanosystem based on CDs linked silica nanoparticles could be used to build another ratiometric fluorescence sensor through the inhibition or catalyzing the oxidation process of KBrO3. In addition, with the help of the dispersion and crosslinking capabilities of silica layer, Liu et al. obtained dual-emission nanocomposite with apparent core–shell structure via covering CDs to the external surface of nitride phosphor.21 Very recently, researchers also developed some ratiometric fluorescence nanohybrid sensors by combining CDs and gold nanoclusters.22,23 In such ratiometric sensing strategy, it not only allows accurate ratiometric fluorescence sensing, but also permits visual detection by the naked eye.
Besides the above-mentioned strategy, functional groups modification and heteroatomic doping also are efficient ways to develop the D-CDs ratiometric fluorescent nanoprobes. Yan grafted coumarin on the surface of CDs to obtain dual-emission CDs which could be used in the ratiometric fluorescence analysis of copper ions.24 Lei's team obtained nitrogen and phosphorous co-doped CDs with blue and green fluorescence dual-emission bands by microwave treating of aniline, ethylene and phosphoric acid.25 In a recent work, Tan prepared Cu-doped D-CDs by one-pot solvothermal method and realized successfully the ratiometric fluorescence analysis of iron ions, pH and vitamin A acetate.9 It was considered that the 426 emission band was originated from the energy gap of CD inherent defects, while the 488 emission band was attributed to another energy gap configuration (d–d orbital) from doping Cu(II). Although these D-CDs demonstrated excellent ratiometric fluorescence signals response in the detection process of analytes. However, complex preprocessing procedure, long preparation time and the use of poisonous reagents will greatly limit their potential application and development. Therefore, it is very necessary to develop an easy and environmentally friendly method for the preparation of D-CDs.
In this research work, we synthesized successfully the fluorescent CDs with dual-emission property by one-pot solvothermal treating of red tea in acetone solvent. The synthesis process is easy, rapid and environmentally friendly. The obtained D-CDs displayed a weak blue fluorescence emission peak at 478 nm and a strong red fluorescence emission peak at 671 nm under the excitation wavelength of 410 nm. Such special dual-emission property of D-CDs not only provides more chance for them in ratiometric fluorescence sensing application, but also gives possibility to realize simultaneous determination of two different analytes. As expected, as-synthesized D-CDs can realize the simultaneous detection of two metal ions. To the best of our current knowledge, it will be the first research work on simultaneous detection of Cu2+ and Al3+ ions based on D-CDs.
2. Experimental section
2.1 Materials and reagents
Red tea (Da Hong Pao), green tea (Tie Guan Yin) and dark tea (Anhua brick tea) were purchased from local supermarkets. Formamide, ethanol, acetone, dimethyl sulfoxide (DMSO), N,N-dimethylformamide (DMF), acetonitrile, tetrahydrofuran (THF), dichloromethane were obtained from Aladdin Reagents Company (Shanghai, China). All metal salts (CuCl2, HgCl2, NiCl2, MgCl2, ZnCl2, AlCl3, MnCl2, FeCl2, FeCl3, CrCl3, CaCl2 and CoCl2) were acquired from Beijing Chemical Reagents Factory (Beijing, China). Ultrapure water was obtained by Millipore Milli-Q plus 185 water purification system and used in all experiments. All chemicals were analytical reagent grade and used directly.2.2 Characterization
UV-vis absorption spectra were recorded on a PerkinElmer Lambda 35 UV-vis spectrometer. Fluorescence spectra were measured on a Cary Eclipse Fluorescence Spectrophotometer (Varian, USA). Fluorescence lifetime experiments were performed by an Edinburgh Instrument FLS-920 time-resolved/steady state fluorescence spectrometer (Livingston, UK). X-ray photoelectron spectroscopy was measured using a PHI-5400 electron spectrometer. Transmission electron microscopy observations were carried out on a JEOL JEM-2100 transmission electron microscope. Fourier-transform infrared (FT-IR) spectra were recorded on a FTIR-650 spectrophotometer. Powder X-ray diffraction (XRD) analyses were performed on Bruker-D8 Focus diffractometer with Cu Kα radiation. Dynamic light scattering (DLS) was measured by a Zeta plus particle size analyzer instrument (Brookhaven, USA).2.3 Preparation of D-CDs
Typically, 300 mg ground dry red tea powder was added into 10 mL acetone and stirred for 10 min, and then the mixture solution was transferred into a 25 mL Teflon-lined stainless steel autoclave. The sealed autoclave was heated in oven at 180 °C for 1 h. After cooling down to room temperature, the crude product was centrifuged at 10![[thin space (1/6-em)]](https://www.rsc.org/images/entities/char_2009.gif) 000 rpm for 10 min to remove large particles. The crude product was further filtrated with 0.22 μm filter membrane and then evaporated off the solvent at 50 °C. The final product was redispersed in ethanol and stored at 4 °C for further characterization and use.
000 rpm for 10 min to remove large particles. The crude product was further filtrated with 0.22 μm filter membrane and then evaporated off the solvent at 50 °C. The final product was redispersed in ethanol and stored at 4 °C for further characterization and use.
2.4 Measurement of quantum yield
The QY of D-CDs was detected by a relative method reported previously. The QY in the emission range of 600–800 nm was calculated using Rhodamine 6G (QY = 95% in ethanol) as the standard substance, and The QY in the emission range of 400–600 nm was calculated by employing quinine sulfate (in 0.1 M H2SO4) as a standard. The relative QY values were estimated according to the following equation:where the subscript std and x refer to the reference substance and the CDs, respectively. The Φ is the fluorescence QY. I, A and η are the integrated fluorescence intensity, the optical densities and the refractive index of the solvent, respectively. The optical density of all samples should be controlled to less than 0.10 at the excitation wavelength.
2.5 Cu2+ and Al3+ ions sensing
Detection of Cu2+ and Al3+ ions were preformed in ethanol solvent at room temperature on a Cary Eclipse Fluorescence Spectrophotometer. Typically, for the detection of Cu2+, CuCl2 ethanol solution with different concentration was added into 2 mL ethanol solution containing D-CDs (0.2 mg mL−1) and incubated for 60 min. Then, the corresponding fluorescence emission spectrum was recorded under 410 nm excitation wavelength. For the detection of Al3+, the corresponding fluorescence spectra were measured after reacting for 1 min. The fluorescence quenching ability of Cu2+ and Al3+ ions in other solvents was measured by the similar experiment procedure except that the solvent was replaced.2.6 Selectivity experiment
To explore the selectivity of the constructed sensor, the fluorescent responses of twelve kinds of metal ions (Cr3+, Al3+, Cu2+, Fe3+, Fe2+, Zn2+, Co2+, Mg2+, Ni2+, Ca2+, Mn2+ and Hg2+) were examined under the same experimental conditions as the mentioned above. The concentrations of all metal ions were 100 μM.3. Results and discussion
3.1 Synthesis and characterization of D-CDs
D-CDs is prepared facilely by one-step solvothermal treatment of red tea in acetone. In order to obtain the desirable products, massive experiments have been carried out to optimize the experimental parameters, and the corresponding results were displayed in Tables S1 and S2 in ESI.† It is worth noting that solvent plays a key role in forming D-CDs. In water and formamide media, single-emission blue CDs can be obtained, but in ethanol and acetone solvents, D-CDs are easier to be formed (see Fig. S1 in ESI†). Furthermore, the type of tea would have a certain influence on the QYs of CDs. By comparison, we find that D-CDs obtained by solvothermal treatment of red tea in acetone give the relative high QY. Under the optimal reaction temperature (180 °C) and reaction time (1 h), the QY of red emission band of the D-CDs is the highest (6.06%). In addition, as depicted in Table S3,† the as-synthesized D-CDs exhibit different QY in different solvents. The QY of red emission band can reach 8.93% in DMF.Fig. 1 displays the TEM images of D-CDs at different magnifications and the corresponding particles size distribution. It is observed that the particle sizes of D-CDs are mostly distributed in the range of 1.9–4.1 nm and the average diameter is 2.9 nm (ca. 19%). The size distribution conforms to the Gaussian feature, and the half width is 0.9 nm, suggesting that the obtained D-CDs possess a narrow size distribution. HRTEM image in Fig. 1c shows that D-CDs exhibit quasi-spherical shape and have well dispersion. It clearly displays the particle possess well-resolved lattice fringe, a clear lattice spacing of 0.208 nm may originate from the (110) lattice plane of graphite.26
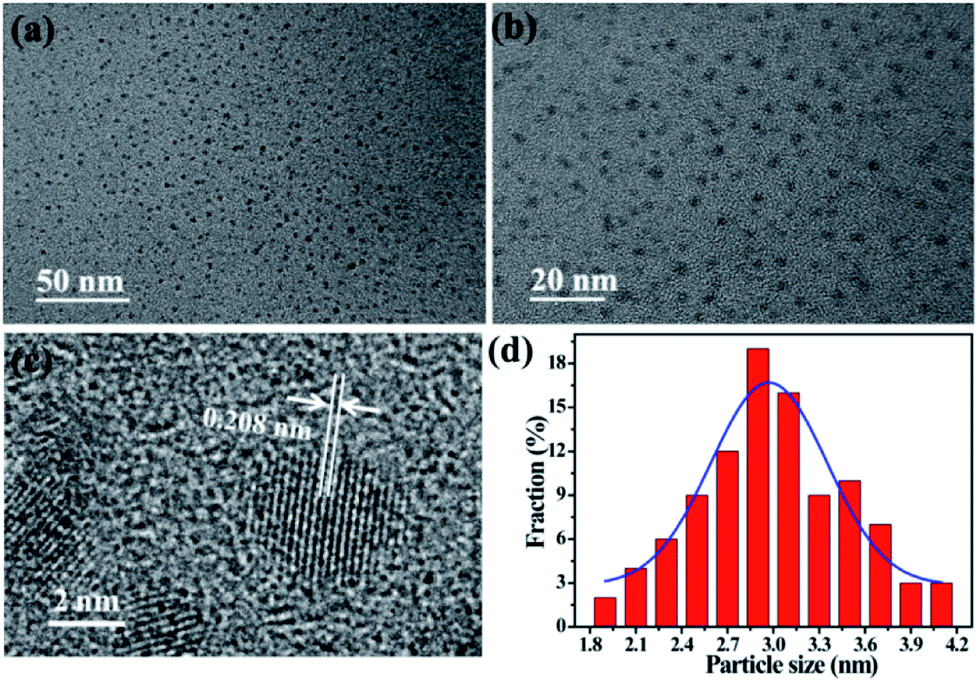 | ||
| Fig. 1 TEM images of D-CDs (a) scale bar is 50 nm and (b) scale bar is 20 nm. (c) HRTEM image of D-CDs (scale bar is 2 nm). (d) Size distribution of D-CDs. | ||
In order to determine the elemental composition and chemical structures of the D-CDs, XPS and FT-IR are carried out. As depicted in the full scan spectrum (Fig. 2a), the three characteristic peaks located at 532, 400 and 284 eV are ascribed to O1s, N1s and C1s, respectively. This implies that the as-synthesized D-CDs mainly compose of carbon, nitrogen, oxygen elements. The C1s spectrum of D-CDs can be deconvoluted into five peaks at 288.5, 286.4, 285.3, 284.5 and 283.3 eV (Fig. 2b), representing that D-CDs contain C![[double bond, length as m-dash]](https://www.rsc.org/images/entities/char_e001.gif) O, C–OH, C–N, C–C/CC and C–H bonds, respectively.27–29 In high-resolution spectrum of O1s (Fig. 2c), the two fitting peaks at 532.7 and 532.0 eV are assigned to C–OH/C–O–C and CO groups.30 N1s can be resolved into four peaks at 401.4, 400.5, 399.7 and 398.0 eV that are attributed to graphitic-type N, N–H, pyrrolic-type N and pyridinic-type N groups (Fig. 2d).28,30 These XPS attributions are further verified by FT-IR analysis (Fig. 2e). The broad bands at 3431 and 3190 cm−1 originate from the O–H and N–H stretching vibrations. The two small bands situated at 2857 and 2921 cm−1 are assigned to the C–H stretching vibrations.28 The vibration bands at 1701 and 1647 cm−1 suggest the presence of CO bonds. Furthermore, peaks at 1567 and 1401 cm−1 are attributed to the CC and C–N stretching vibration, and the peaks around 1136 and 1096 cm−1 are ascribed to the C–O stretching vibration and the bending vibrations of C–H.30,31 In addition, the XRD pattern (Fig. 2f) of D-CDs displays a wide diffraction peak centered at 21.2°, which suggests the formation of highly disordered carbon phase.32
O, C–OH, C–N, C–C/CC and C–H bonds, respectively.27–29 In high-resolution spectrum of O1s (Fig. 2c), the two fitting peaks at 532.7 and 532.0 eV are assigned to C–OH/C–O–C and CO groups.30 N1s can be resolved into four peaks at 401.4, 400.5, 399.7 and 398.0 eV that are attributed to graphitic-type N, N–H, pyrrolic-type N and pyridinic-type N groups (Fig. 2d).28,30 These XPS attributions are further verified by FT-IR analysis (Fig. 2e). The broad bands at 3431 and 3190 cm−1 originate from the O–H and N–H stretching vibrations. The two small bands situated at 2857 and 2921 cm−1 are assigned to the C–H stretching vibrations.28 The vibration bands at 1701 and 1647 cm−1 suggest the presence of CO bonds. Furthermore, peaks at 1567 and 1401 cm−1 are attributed to the CC and C–N stretching vibration, and the peaks around 1136 and 1096 cm−1 are ascribed to the C–O stretching vibration and the bending vibrations of C–H.30,31 In addition, the XRD pattern (Fig. 2f) of D-CDs displays a wide diffraction peak centered at 21.2°, which suggests the formation of highly disordered carbon phase.32
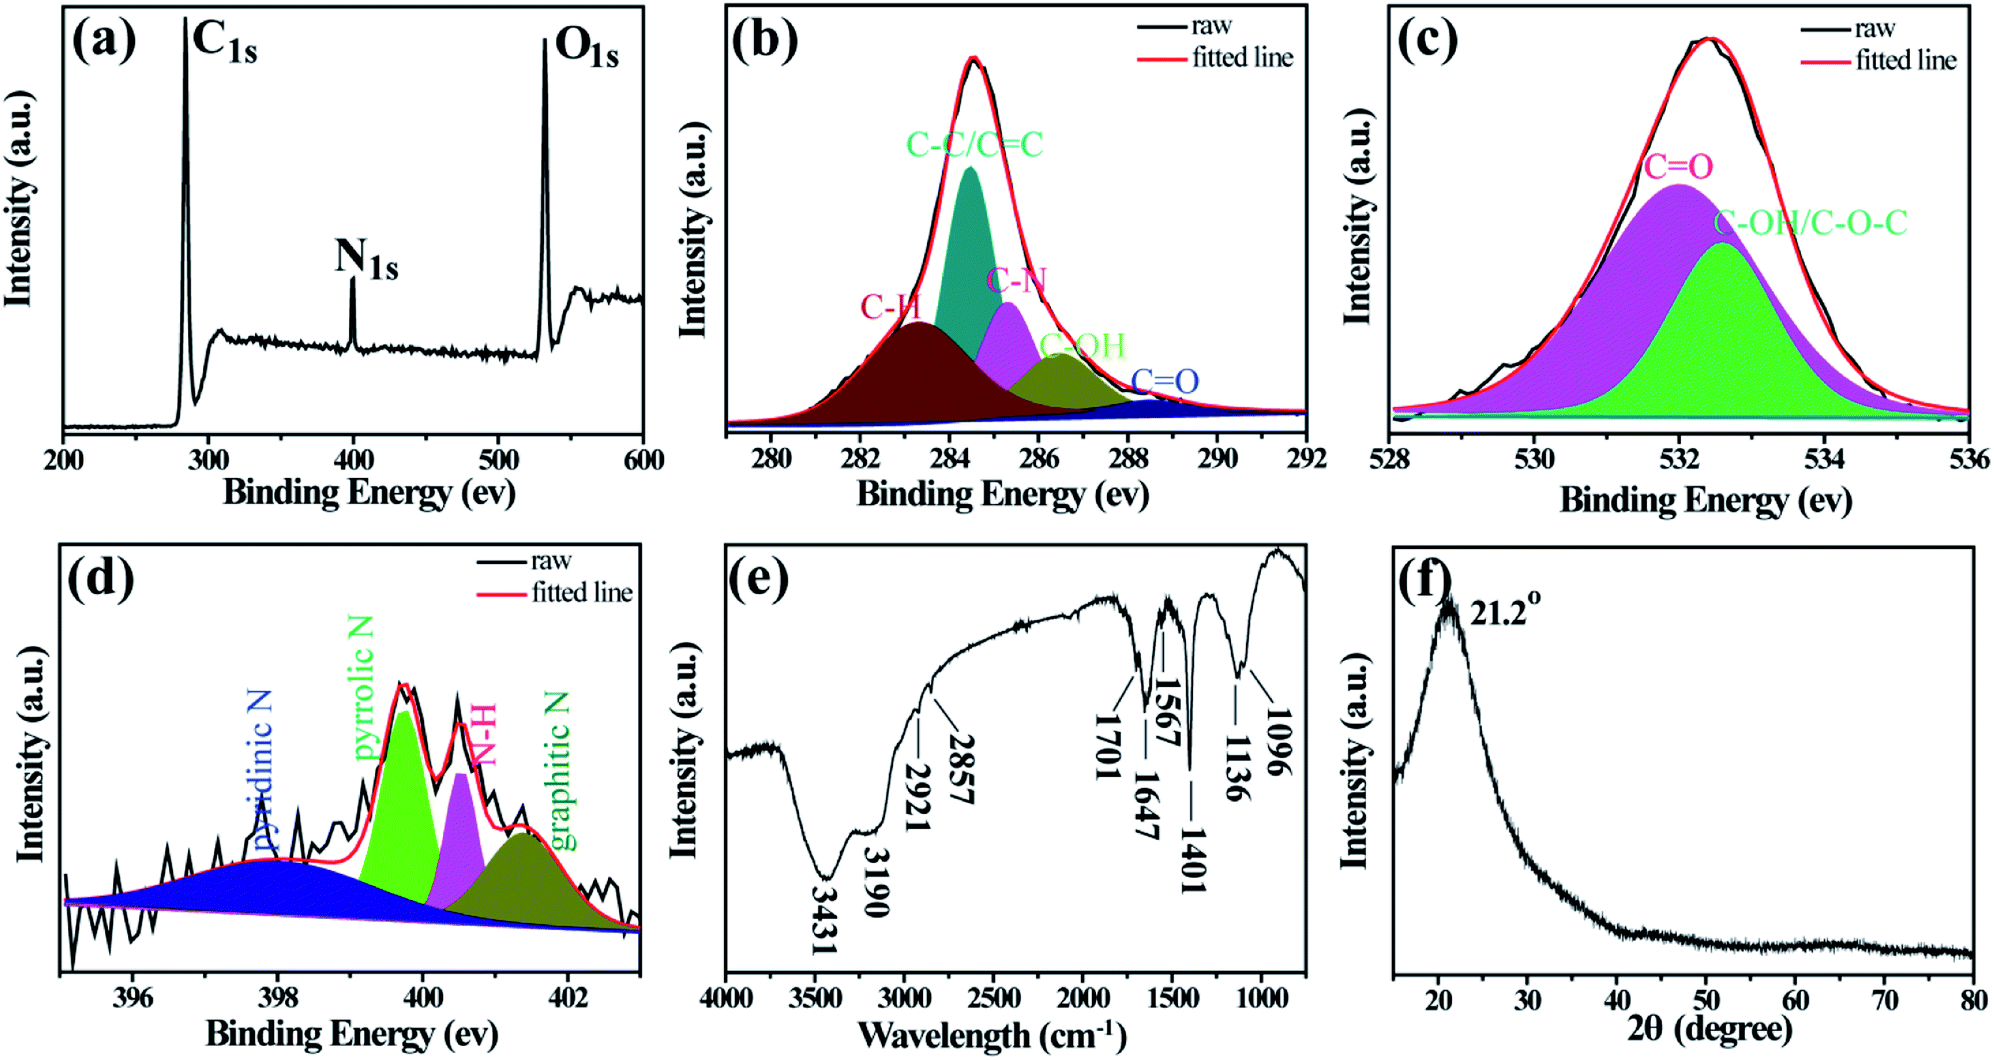 | ||
| Fig. 2 (a) XPS survey spectra of D-CDs. High-resolution C1s (b), O1s (c), and N1s (d) spectra of D-CDs. (e) FTIR spectra of the D-C Ds. (f) XRD of D-CDs. | ||
3.2 Optical properties of D-CDs
The optical properties of the as-prepared D-CDs are studied by UV-vis absorption and fluorescence techniques. From Fig. 3, it can be seen that the UV-vis absorption spectrum of D-CDs exhibits four absorption bands at 273, 411, 503 and 665 nm. The absorption band at 273 nm is considered to be the typical π → π* transition characteristic peak of the CC group. The bands at 411, 503 and 665 nm are possibly originated from π → π* and n → π* transitions of the CO or CN groups.28,33 More surprisingly, under 410 nm excitation wavelength, D-CDs demonstrate two separated FL emission peaks at 478 nm and 671 nm, which correspond to the blue-emission and red-emission bands, respectively. From the fluorescence spectra, it is further found that the blue band exhibits an apparent excitation-dependent feature when the excitation wavelength is increased from 340 to 480 nm. Previous research pointed that it is possible originate from the intrinsic and defects emission, which is considered to be related to oxygenous-related defect states. But the red emission band presents excitation-independent emission properties, which probably originates from the nitrogen-containing fluorophores (e.g. porphyrin molecules).34,35 Moreover, it is also observed that the fluorescence intensity of the blue-emission band is much weaker than those of the red-emission band. It is well known that the naked eye is much more sensitive to red light than to the blue one. Thus, the resultant D-CDs ethanol suspension seems to emit bright red fluorescence under 365 nm UV lamp (see the inset in Fig. 3). As depicted in Fig. S2,† as the excitation wavelength varies from 340 to 600 nm, the CIE color coordinates can be shifted from blue region (0.2137, 0.1845) to the red region (0.7181, 0.2719). This indicates that the as-synthesized D-CDs maybe have potential application as an optical conversion material.
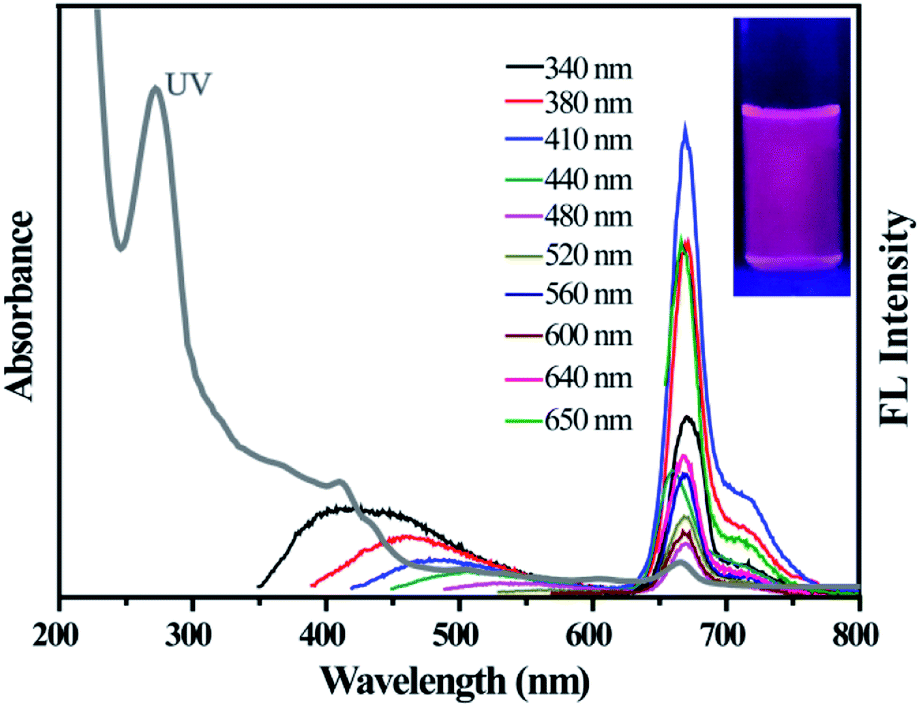 | ||
| Fig. 3 UV-visible absorption (gray curve) and FL emission spectra of D-CDs (excitation wavelengths range from 340 to 650 nm). The inset is photographs of D-CDs under UV lamp. | ||
3.3 Cu2+-induced red-emission quenching and Al3+-induced blue-emission enhancement of D-CDs
It is well known that fluorescent CDs have been widely applied as a versatile fluorescent nanoprobe to detect various metal ions based on the metal ions induced FL quenching mechanism.36,37 So, we are very curious to know if the as-prepared D-CDs will exhibit the similar response. To examine metal ion responding ability towards D-CDs, the corresponding fluorescence spectra with and without twelve kinds of metal ions (100 μM Cr3+, Al3+, Cu2+, Fe3+, Fe2+, Zn2+, Co2+, Mg2+, Ni2+, Ca2+, Mn2+ and Hg2+) are measured, respectively. Surprisingly, we observe that the presence of Cu2+ ion can cause significant FL quenching of the red-emission band of D-CDs, on the contrary, Al3+ leads to the manifest FL enhancement and slight red-shift of the blue-emission band of D-CDs (Fig. S3†), whereas there are no obvious changes for other ten kinds of metal ions. The specific coordinates in the CIE chromaticity diagram move from the red light area (0.42, 0.29) to white light area (0.34, 0.28) and blue-green area (0.19, 0.31) upon addition of Cu2+ and Al3+ ions, respectively (Fig. S4†). Under 410 nm excitation wavelength, 100 μM of Cu2+ ion can result in approximately 14 times of FL quenching ability at 671 nm, and 100 μM of Al3+ ion can bring about nearly 24 times of FL enhancement at 478 nm (Fig. 4a). Such significant FL changes in the blue color fluorescence enhancement and red color fluorescence quench suggest the high selectivity of the dual-emission D-CDs towards Al3+ and Cu2+ ions, which allows to fabricate a simple analytical method for the simultaneous determination of Al3+ and Cu2+ ions.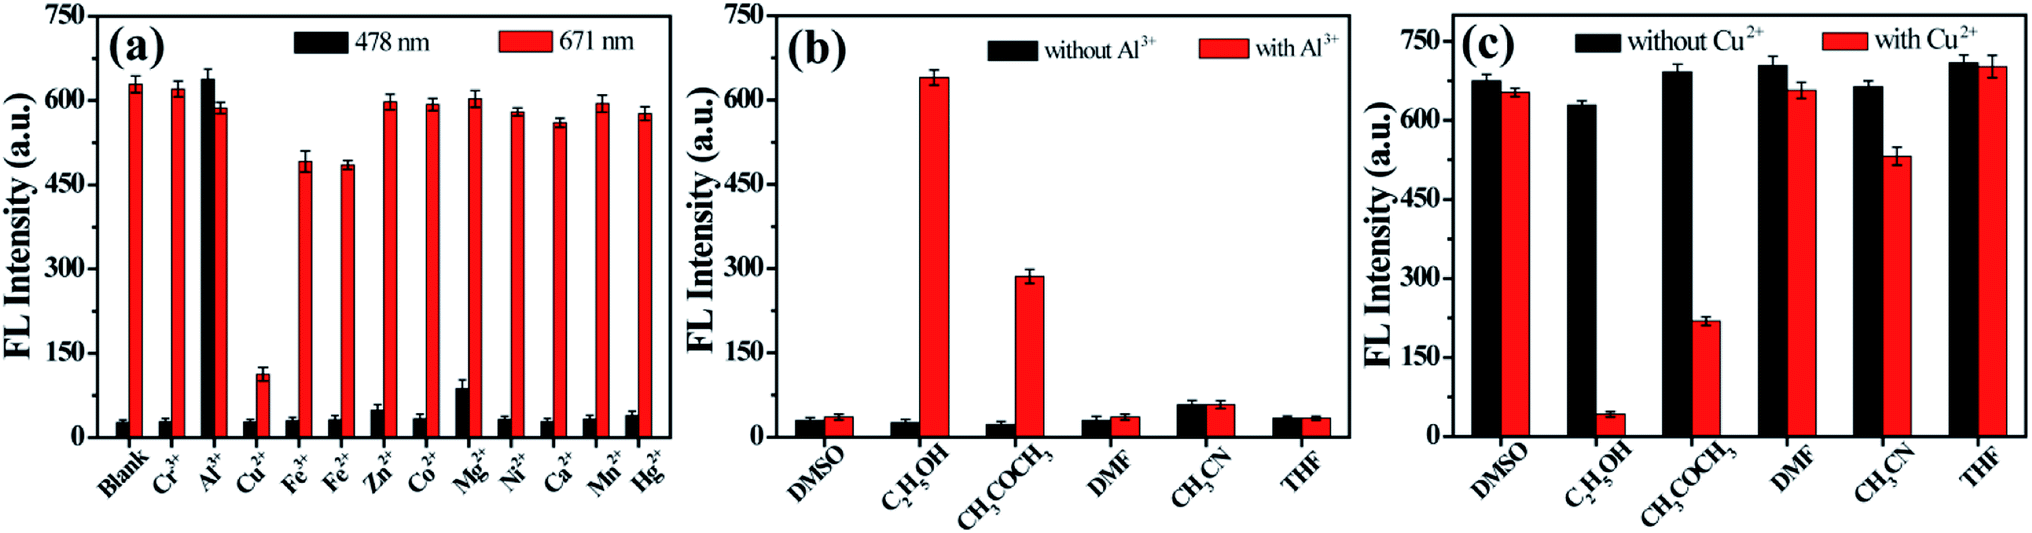 | ||
| Fig. 4 (a) The FL intensity histogram of D-CDs in ethanol in the absence and presence of different metal ions (the excitation wavelength λex is 410 nm. Black and red column signify 478 nm and 671 nm emission intensity). (b) The FL intensity of D-CDs at 478 nm in different solvents (black column and red column represent without and with Al3+ ions, respectively). (c) The FL intensity of D-CDs at 671 nm in different solvents (black column and red column represent without and with Cu2+ ions, respectively). | ||
In order to detect Al3+ and Cu2+ ions effectively, the experimental conditions including the solvents and reaction time are optimized. Fig. 4b displays that the FL intensity of D-CDs at 478 nm is basically constant in the presence of Al3+ ions in DMSO, DMF, acetonitrile, THF and water, however, the FL intensity of D-CDs is significantly increased ∼24-fold and ∼12-fold in ethanol and acetone solvents, respectively. Similarly, in the ethanol media, the presence of Cu2+ ions can cause the maximum FL quenching at 671 nm (Fig. 4c). Therefore, the ethanol solvent is selected as the optimal reaction media in the following experiments. Next, the effect of the reaction time is further investigated and shown in Fig. S5 and S6.† Result exhibits that FL signal response of the D-CDs is dependent of the reaction time. Upon addition of Al3+ ion, the FL intensity of D-CDs at 478 nm increases to the maximum after 2 min incubation, then decrease slightly with time. With regards to Cu2+ ion, the FL intensity of D-CDs at 671 nm decreases rapidly within the initial 20 min, then this decrease becomes slowly and reaches the constant at 60 min. Considering the speed and easy-operation of the detection assay, the optimal reaction time is selected as 2 min and 60 min for Al3+ and Cu2+ detection, respectively.
The blue emission peak of D-CDs at 478 nm grows gradually upon increasing the concentration of Al3+ ions, while the intensity change of red emission peak at 671 nm is negligible. ln(F478/F671) exhibits good linearity with the concentration of Al3+ in range of 0 to 20 μM and 25 to 100 μM, respectively (Fig. 5a). The correlation equation is ln(F478/F671) = 0.1273C (μM) − 3.1261 (R = 0.9972), and ln(F478/F671) = 0.007070C (μM) − 0.4070 (R = 0.9860), respectively, in which F478 and F671 signify the FL intensity of D-CDs at 478 nm and 671 nm in the presence of Al3+ separately. The detection limit is 0.5 μM at 3 times signal-to-noise ratio. It is noted that the FL color of D-CD solution varies from red to orange, then to yellow-green after adding different concentration of Al3+ ions and can be observed by naked eye under UV lamp (365 nm) (Fig. 5b). The FL color of D-CDs solution becomes obvious different after the addition of 20 μM, implying that the colorimetric detection limit for Al3+ is 20 μM.
 | ||
| Fig. 5 (a) The linear plot between ln(F478/F671) and the concentration of Al3+ in the range of 0–2.0 × 10⁻⁵ M and 2.5 × 10⁻⁵ M to 1.0 × 10⁻⁴ M. (b) Visual FL photographs of D-CDs in the presence of different concentrations of Al3+ under 365 nm UV light. | ||
The fluorescence intensity of the red emission peak gradually declines upon increasing the concentration of Cu2+ ions. The relative fluorescence intensity (F/F0) displays good linearity with the concentration of Cu2+ ion (Fig. 6a). The linearity equation is F/F0 = −0.01814C (μM) + 0.9873 (R = 0.9958), the linearity range is from 0.1 to 50 μM and the detection limit is 0.1 μM. As depicted in Fig. 6b, the red FL quenching can be seen obviously by naked eye in the presence of 25 μM Cu2+, indicating that the colorimetric detection limit for Cu2+ is 25 μM.
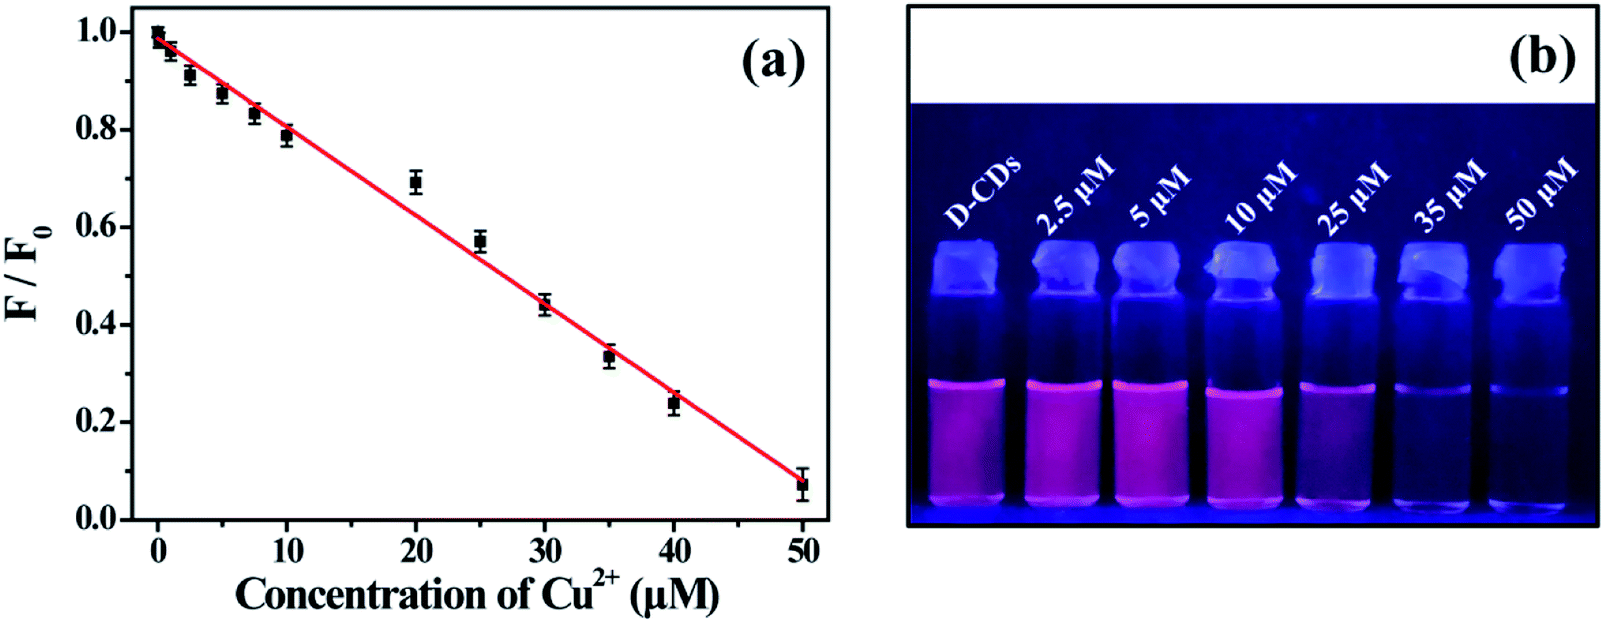 | ||
| Fig. 6 (a) The linear plot between F/F0 and the concentration of Cu2+ in the range of 0–5.0 × 10⁻⁵ M (F and F0 signify the FL intensity of D-CDs at 671 nm in the presence and absence of Cu2+). (b) Visual FL photographs of D-CDs in the presence of different concentrations of Cu2+ under 365 nm UV light. | ||
3.4 Response mechanism of D-CDs to Al3+ and Cu2+
Previous reports demonstrate fluorescence response of CDs to metal ions mainly involve the fluorescence resonance energy transfer (FRET), inner filter effect (IFE), aggregation-induced emission quenching (ACQ) and aggregation-induced emission enhancement (AIEE).38–41 In our case, it is impossible that there are FRET and IFE between D-CDs and Al3+ or Cu2+ since two kinds of metal ions have neither characteristic absorption nor spectral overlap with the excitation and emission spectra of D-CDs (Fig. S7†). Generally, ACQ and AIEE are related to the aggregation of CDs caused by temperature, solvent and metal ions.42 Thus, to investigate whether the FL response mechanism of D-CDs after binding with Al3+ or Cu2+ are ascribed to the aggregation-induced emission effects, we measured the DLS of D-CDs with and without different metal ions. As displayed the DLS data in Fig. S8,† the diameter of the D-CDs in ethanol distributes in the range of 2.1–15.5 nm. It is observed that the diameters of D-CDs in the presence of other ten kinds of metal ions are basically close. In contrast, when Al3+ or Cu2+ ions are added, the diameter of the D-CDs are increased clearly, and the size distributions are in range of 25–300 nm (the average particle size is 68.7 nm) and 15–165 nm (the average particle size is 49.8 nm), respectively, verifying the formation of larger D-CDs aggregates. For Cu2+ ions, the aggregation of D-CDs can be attributed to the coordination of Cu2+ ions with the surface –NH2 sites, which will make nanoparticles closer, as a result, obvious ACQ effect occurs. The detailed quenching process is further discussed by the time-resolved fluorescence technique. When the excitation and emission wavelengths is 410 and 670 nm, the average lifetime of D-CDs is 7.98 ns and can be fitted into two components: 6.57 ns (ca. 92.7%) and 25.84 ns (ca. 7.3%). After mixing with Cu2+ ions, the D-CDs/Cu2+ lifetime is 7.91 ns (Fig. S9†). Further analysis demonstrates that the quenching mechanism of Cu2+ ions towards D-CDs follows a static process. The Stern–Volmer constant (Ksv) is 2.56 × 10⁴ L mol−1 and the biomolecular reaction rate constant (Kq) is 3.18 × 10¹² L mol−1 s−1.For Al3+ ions, based on the obvious size increase, the FL enhancement of the blue-band of D-CDs is considered as the result of the AIEE effects. The FL decay behavior and the corresponding quantum yield of the D-CDs/Al3+ system are displayed in Fig. S10 and Table S4.† Upon the addition of Al3+ ions, the lifetime of blue-band of D-CDs increases from 3.83 ns to 4.80 ns, and the quantum yield also increases from 0.80% to 8.01% (quinine sulfate as a standard). The radiative rate constant (kr) and nonradiative rate constant (knr) are calculated through the following formula: kr = Φ/τ and knr = (1 − Φ)/τ, respectively. Apparently, owing to the change in lifetime and quantum yields, the kr value increase from 2.09 × 10⁶ s−1 to 16.69 × 10⁶ s−1, while the knr value decreases from 2.59 × 10⁸ s−1 to 1.92 × 10⁸ s−1. Moreover, the enhanced emission of blue-band of D-CDs in glycerol solution with high viscous further reveals the rotational hindering of the surface groups on D-CDs (Fig. S11†) blocks the non-radiative decay, leading to improved FL intensity.43,44
4. Conclusions
In summary, CDs obtained from one-step solvothermal treatment of red tea exhibits special dual-emission property under single-wavelength excitation. This endows CDs multiple sensing ability, which can be employed to realize the simultaneous detection of Cu2+ and Al3+ without any interference effect. Based on the obvious FL color and FL intensity variations, a novel colorimetric and ratiometric fluorescence dual mode nanosensor for simultaneous detection of Cu2+ and Al3+ ions is developed. Further studies demonstrate that the introduction of Cu2+ and Al3+ ions can cause the aggregates of D-CDs. It is confirmed that red band (671 nm) fluorescence quenching of D-CDs in the presence of Cu2+ ions originated from ACQ effect. However, the obvious fluorescence enhancement of the blue band (ca. 470 nm) of D-CDs is ascribed to AIEE effect owing to the rotational hindering of D-CDs, reducing the non-radiative decay. This research will open our mind to exploit multi-emission CDs with more charming multiple sensing properties.Conflicts of interest
There are no conflicts to declare.Acknowledgements
This work was supported by the National Natural Science Foundation of China (21301111 and 51602322), Research Project Supported by Shanxi Scholarship Council of China (2016-105) and the Research Foundation of Datong City (2019027 and 2017129).Notes and references
- S. Y. Lim, W. Shen and Z. Q. Gao, Chem. Soc. Rev., 2015, 44, 362–381 RSC.
- G. A. M. Hutton, B. C. M. Martindale and E. Reisner, Chem. Soc. Rev., 2017, 46, 6111–6123 RSC.
- S. Zhu, Q. Meng, L. Wang, J. Zhang, Y. Song, H. Jin, K. Zhang, H. Sun, H. Wang and B. Yang, Angew. Chem., Int. Ed., 2013, 125, 4045–4049 CrossRef.
- Q. Xu, T. Kuang, Y. Liu, L. Cai, X. Peng, T. S. Sreeprasad, P. Zhao, Z. Yu and N. Li, J. Mater. Chem. B, 2016, 4, 7204–7219 RSC.
- H. Ding, S. B. Yu, J. S. Wei and H. M. Xiong, ACS Nano, 2016, 10, 484–491 CrossRef CAS PubMed.
- J. Chen, J. S. Wei, P. Zhang, X. Q. Niu, W. Zhao, Z. Y. Zhu, H. Ding and H. M. Xiong, ACS Appl. Mater. Interfaces, 2017, 9, 18429–18433 CrossRef CAS PubMed.
- J. Ge, Q. Jia, W. Liu, L. Guo, Q. Liu, M. Lan, H. Zhang, X. Meng and P. Wang, Adv. Mater., 2015, 27, 4169–4177 CrossRef CAS PubMed.
- J. Zhao, M. Huang, L. Zhang, M. Zou, D. Chen, Y. Huang and S. Zhao, Anal. Chem., 2017, 89, 8044–8049 CrossRef CAS PubMed.
- P. P. Zhu, Z. Cheng, L. L. Du, Q. Chen and K. J. Tan, Langmuir, 2018, 34, 9982–9989 CrossRef CAS PubMed.
- J. Liu, Y. Dong, Y. Ma, Y. Han, S. Ma, H. Chen and X. Chen, Nanoscale, 2018, 10, 13589–13598 RSC.
- R. Wang, X. Wang and Y. Sun, Microchim. Acta, 2017, 184, 187–193 CrossRef CAS.
- L. Lu, C. Feng, J. Xu, F. Wang, H. Yu, Z. Xu and W. Zhang, Biosens. Bioelectron., 2017, 92, 101–108 CrossRef CAS PubMed.
- M. Lan, J. Zhang, Y. S. Chui, P. Wang, X. Chen, C. S. Lee, H. L. Kwong and W. Zhang, ACS Appl. Mater. Interfaces, 2014, 6, 21270–21278 CrossRef CAS PubMed.
- L. Yu, G. Ren, M. Tang, B. Zhu, F. Chai, G. Li and D. Xu, Eur. J. Inorg. Chem., 2018, 3418–3426 CrossRef CAS.
- J. X. Wu and B. Yan, Dalton Trans., 2017, 46, 7098–7105 RSC.
- J. X. Wu and B. Yan, Dalton Trans., 2017, 46, 15080–15086 RSC.
- Y. Q. Dong, J. H. Cai, Q. Q. Fang, X. You and Y. W. Chi, Anal. Chem., 2016, 88, 1748–1752 CrossRef CAS PubMed.
- X. J. Liu, N. Zhang, T. Bing and D. H. Shangguan, Anal. Chem., 2014, 86, 2289–2296 CrossRef CAS PubMed.
- G. Q. Xiang, Y. Ren, H. Zhang, H. H. Fan, X. M. Jiang, L. J. He and W. J. Zhao, Can. J. Chem., 2018, 96, 72–77 CrossRef CAS.
- G. Q. Xiang, Y. Ren, Y. Xia, W. J. Mao, C. Fan, S. Y. Guo, P. P. Wang, D. H. Yang, L. J. He and X. M. Jiang, Spectrochim. Acta, Part A, 2017, 177, 153–157 CrossRef CAS PubMed.
- Y. H. Chen, B. F. Lei, M. T. Zheng, H. R. Zhang, J. L. Zhuang and Y. L. Liu, Nanoscale, 2015, 7, 20142–20148 RSC.
- H. Z. Xie, J. Dong, J. L. Duan, G. I. N. Waterhouse, J. Y. Hou and S. Y. Ai, Sens. Actuators, B, 2018, 259, 1082–1089 CrossRef CAS.
- Y. S. He, C. G. Pan, H. X. Cao, M. Z. Yue, L. Wang and G. X. Liang, Sens. Actuators, B, 2018, 265, 371–377 CrossRef CAS.
- F. Yan, Z. Bai, Y. Chen, F. Zu, X. Li, J. Xu and L. Chen, Sens. Actuators, B, 2018, 275, 86–94 CrossRef CAS.
- X. C. Sun, C. Brücknerb and Y. Lei, Nanoscale, 2015, 7, 17278–17282 RSC.
- Y. Q. Dong, R. X. Wang, H. Li, J. W. Shao, Y. W. Chi, X. M. Lin and G. N. Chen, Carbon, 2012, 50(8), 2810–2815 CrossRef CAS.
- X. J. Gong, W. J. Lu, M. C. Paau, Q. Hu, X. Wu, S. M. Shuang, C. Dong and M. F. F. Choi, Anal. Chim. Acta, 2015, 861, 74–84 CrossRef CAS PubMed.
- L. Pan, S. Sun, L. Zhang, K. Jiang and H. W. Lin, Nanoscale, 2016, 8(39), 17350–17356 RSC.
- X. W. Qie, M. H. Zan, P. Miao, L. Li, Z. M. Chang, M. F. Ge, P. Gui, Y. G. Tang and W. F. Dong, J. Mater. Chem. B, 2018, 6(31), 3549–3554 RSC.
- L. Luo, P. Wang, Y. H. Wang and F. Wang, Sens. Actuators, B, 2018, 273, 1640–1677 CrossRef CAS.
- Y. F. Chen, Y. Y. Wu, B. Weng, B. Wang and C. M. Li, Sens. Actuators, B, 2016, 223, 689–696 CrossRef CAS.
- Y. L. He, J. L. He, Z. H. Yu, H. R. Zhang, Y. L. Liu, G. Q. Hu, M. T. Zheng, H. W. Dong, J. L. Zhuang and B. F. Lei, J. Mater. Chem. C, 2018, 6, 2495–2501 RSC.
- W. Wang, Y. M. Li, L. Cheng, Z. Q. Cao and W. G. Liu, J. Mater. Chem. B, 2014, 2(1), 46–48 RSC.
- T. X. Zhang, J. Y. Zhu, Y. Zhai, H. Wang, X. Bai, B. Dong, H. Y. Wang and H. W. Song, Nanoscale, 2017, 9(35), 13042–13051 RSC.
- L. P. Li, R. P. Zhang, C. X. Lu, J. H. Sun, L. J. Wang, B. T. Qu, T. T. Li, Y. D. Liu and S. J. Li, J. Mater. Chem. B, 2017, 5(35), 7328–7334 RSC.
- N. Wang, Y. T. Wang, T. T. Guo, T. Yang, M. L. Chen and J. H. Wang, Biosens. Bioelectron., 2016, 85, 68–75 CrossRef CAS PubMed.
- B. F. Shi, Y. B. Su, L. L. Zhang, M. J. Huang, R. J. Liu and S. L. Zhao, ACS Appl. Mater. Interfaces, 2016, 8(17), 10717–10725 CrossRef CAS PubMed.
- W. L. Gao, H. H. Song, X. Wang, X. Q. Liu, X. B. Pang, Y. M. Zhou, B. Gao and X. J. Peng, ACS Appl. Mater. Interfaces, 2018, 10(1), 1147–1154 CrossRef CAS PubMed.
- Y. B. Wang, Q. Chang and S. L. Hu, Sens. Actuators, B, 2017, 253, 928–933 CrossRef CAS.
- H. X. Zhao, L. Q. Liu, Z. D. Liu, Y. Wang, X. J. Zhao and C. Z. Huang, Chem. Commun., 2011, 47(9), 2604–2606 RSC.
- B. B. Chen, R. S. Li, M. L. Liu, H. Z. Zhang and C. Z. Huang, Chem. Commun., 2017, 53(36), 4958–4961 RSC.
- C. Li, W. J. Liu, X. B. Sun, W. Pan, G. F. Yu and J. P. Wang, Sens. Actuators, B, 2018, 263, 1–9 CrossRef CAS.
- Y. Hong, J. W. Y. Lam and B. Z. Tang, Chem. Soc. Rev., 2011, 40(11), 5361–5388 RSC.
- M. X. Gao, C. F. Liu, Z. L. Wu, Q. L. Zeng, X. X. Yang, W. B. Wu, Y. F. Li and C. Z. Huang, Chem. Commun., 2011, 49(73), 8015–8017 RSC.
Footnote |
| † Electronic supplementary information (ESI) available. See DOI: 10.1039/c9ra07030c |
| This journal is © The Royal Society of Chemistry 2019 |