 Open Access Article
Sulfation effect of Ce/TiO2 catalyst for the selective catalytic reduction of NOx with NH3: mechanism and kinetic studies†
Wenjie
Zhang
 a,
Guofu
Liu
a,
Jie
Jiang
b,
Yuchen
Tan
c,
Qi
Wang
d,
Chenghong
Gong
e,
Dekui
Shen
a,
Guofu
Liu
a,
Jie
Jiang
b,
Yuchen
Tan
c,
Qi
Wang
d,
Chenghong
Gong
e,
Dekui
Shen
 *a and
Chunfei
Wu
*f
aKey Laboratory of Energy Thermal Conversion and Control of Ministry of Education, School of Energy and Environment, Southeast University, Nanjing 210096, Jiangsu, PR China. E-mail: 101011398@seu.edu.cn
bEngineering Laboratory of Energy System Process Conversion & Emission Control Technology of Jiangsu Province, School of Energy and Mechanical Engineering, Nanjing Normal University, Nanjing 210042, PR China
cNanjing Foreign Language School, Nanjing 210018, Jiangsu, PR China
dCollege of Metrological Technology and Engineering, China Jiliang University, Hangzhou 310018, PR China
eJiangsu Yanxin SCI-TECH Co., Ltd, WuXi 214426, PR China
fSchool of Chemistry and Chemical Engineering, Queen's University Belfast, Belfast BT7 1NN, UK. E-mail: c.wu@qub.ac.uk
First published on 9th October 2019
Abstract
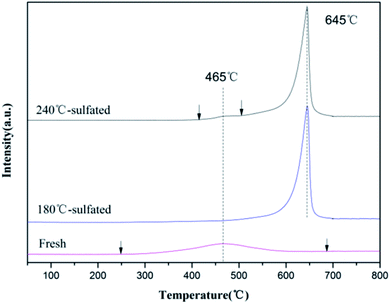
Ceria-based catalysts are competitive substitutes for the commercial SCR catalysts due to their high SCR activity and excellent redox performance. For a better understanding of the SO2 poisoning mechanism over ceria-based catalysts, the sulfation effect of the Ce/TiO2 catalyst on the SCR activity over a wide reaction temperature range was systematically studied via comprehensive characterizations, in situ DRIFT studies and kinetic studies. The results demonstrated that the NO conversion at 150 °C is significantly inhibited by the formation of cerium sulfites/sulfates due to the inhibited redox properties and excessive adsorption of NH3, which restrict the dissociation of NH3 to NH2, resulting in a much lower reaction rate of E–R reaction over the sulfated Ce/TiO2 catalyst. With the increase in the reaction temperature, the reaction rate of the E–R reaction significantly increased due to the improved redox properties and weakened adsorption of NH3. Moreover, the rate of the C–O reaction over the sulfated Ce/TiO2 catalysts is obviously lower than that of the fresh Ce/TiO2 catalyst. The promotion of NO conversion over the sulfated catalyst at 330 °C is attributed to both the increase in the reaction rate of E–R reaction and the inhibition of the C–O reaction.
1. Introduction
Selective catalytic reduction (SCR) by ammonia has been proven to be the most efficient technology for removing NOx that originates from stationary and mobile pollution sources.1 SCR catalysts are the core of the NH3-SCR system, and the commercial SCR catalyst based on the VO5–WO3/TiO2 catalyst has been widely used for the NH3-SCR system. However, the high operating temperature (>350 °C), the toxicity of vanadium and the low N2 selectivity at high temperatures restrict the use of vanadium-based catalysts on industry boiler systems, which is urgently needed for the removal of NOx in China.2 Therefore, significant efforts have been made to develop environmentally benign catalysts with a superior low-temperature SCR activity, such as Fe2O3-based,3 CeO2-based,4 CuO-based5 and MnOx-based catalysts.6Ceria-based catalysts have been considered as potential candidates for the replacement of V2O5–WO3/TiO2 due to their high oxygen storage capacity and excellent redox properties. A series of ceria-based catalysts, including CeO2/TiO2, CeO2–WO3, Sb–V2O5–CeO2/TiO2 and CeO2–SnOx, have shown superior middle-temperature SCR activity and N2 selectivity.7–9 However, the presence of a low concentration of SO2 in the flue gas could cause an inevitable deactivation effect on NO conversion over ceria-based catalysts. The sulfation of ceria-based catalysts can slightly promote SCR performance by the enhancement of the acidity and the reactivity of cerium sulfates on the premise of sufficient redox properties.10 In most cases, it has been found that ceria-based catalysts are sensitive to SO2 poisoning and a good amount of cerium sulfites/sulfates are deposited on the surface of catalysts,8,11 blocking the catalyst pore channels and cutting off the redox cycle involved in the standard SCR reaction. A previous investigation by Muhammad et al.9 simply studied the sulfation effect of the Ce/TiO2 catalyst and Ti/CeO2 catalyst on SCR activity, suggesting that the low-temperature SCR activity is much more sensitive to the formation of cerium sulfites/sulfates, while middle and high-temperature SCR activities are less affected. It was demonstrated that the sulfation effects of the ceria-based catalyst on NO conversion at different reaction temperatures are different, while the insight into the sulfation effect on the SCR activity was not revealed. Moreover, the SCR reaction mechanism of the sulfated Ce/TiO2 catalyst may differ from that of a fresh catalyst.
In order to investigate the sulfation effect of the Ce/TiO2 catalyst on the SCR activity and the reaction mechanism over a wide reaction temperature range, the SCR activities of the fresh Ce/TiO2 catalyst and sulfated catalyst were studied. The sulfation effect of the Ce/TiO2 catalyst was fully investigated via N2 physisorption, XPS, H2-TPR, NH3-TPD and in situ DRIFT. Furthermore, kinetic studies involving the E–R mechanism, L–H mechanism, nonselective catalytic reduction reaction (i.e., NSCR reaction) and catalytic oxidation reaction (i.e., the C–O reaction) were performed for a clearer understanding of the sulfation effect of the Ce/TiO2 catalyst on the SCR reaction. It is expected that the present study will help in understanding the deactivation mechanism of sulfation at different reaction temperatures and further provide useful guidance for the design of catalysts with higher SO2 resistance.
2. Experimental
2.1 Catalyst preparation
The Ce/TiO2 catalyst (Ce/Ti mole ratio = 0.25) was prepared by a single step sol–gel method using butyl titanate (Sichuan Kelong, China), anhydrous ethanol acetic acid, deionized water, nitric acid and a certain amount of cerium nitrate. The chemicals were mixed under continuous and vigorous stirring at room temperature. After 3 h, a transparent yellowish sol was formed and was then aged for 12 h, which then became a gel. The derived sample was dried at 90 °C for 12 h to form a xerogel, followed by calcination at 450 °C at a heating rate of 10 °C min−1 in air for 6 h. Finally, the catalyst was crushed and sieved to 40–80 mesh size. The sulfated Ce/TiO2 catalyst was pretreated in a flow of 1000 ppm SO2 and 3% O2 (750 mL min−1) at 180 °C and 240 °C for 8 h, respectively, followed by flushing with N2 for 1 h to remove the physically adsorbed SO2. These catalysts were assigned as 180 °C-sulfated and 240 °C-sulfated catalysts, respectively.2.2 Catalyst characterizations
2.3 SCR activity estimation of catalyst samples
The NH3-SCR reaction and studies of the effect of SO2 on the SCR reaction were performed in a fixed-bed quartz tube reactor. The reactor consists of a quartz tube with an inner diameter of 16 mm and a thermocouple placed on the outside wall of the reactor to control the temperature of the furnace. About 1 mL of catalyst (40–80 mesh) was used in all experiments. The reaction conditions were as follows: 1 mL of catalyst, 600 ppm NO, 600 ppm NH3, 3 vol% O2, N2 as the balance, 1000 ppm SO2 (if required) and a gas hourly space velocity (GHSV) of 40![[thin space (1/6-em)]](https://www.rsc.org/images/entities/char_2009.gif) 000 h−1. NOx, NH3 and N2O in the effluent gas were analyzed using a flue gas analyzer (Testo 350), Nessler's reagent spectrophotometry method12 and a N2O analyzer (Medi-Gas G200) when the reaction system reached a steady state for 30 min. The NOx conversion (η), N2O selectivity (S) and the pseudo-first-order rate constant (τ) were calculated using the following formulae:
000 h−1. NOx, NH3 and N2O in the effluent gas were analyzed using a flue gas analyzer (Testo 350), Nessler's reagent spectrophotometry method12 and a N2O analyzer (Medi-Gas G200) when the reaction system reached a steady state for 30 min. The NOx conversion (η), N2O selectivity (S) and the pseudo-first-order rate constant (τ) were calculated using the following formulae: | (1) |
 | (2) |
 | (3) |
2.4 Experiments for kinetic studies
To obtain the kinetic parameters of the SCR reaction, the NSCR reaction and catalytic oxidation reaction (i.e., the C–O reaction), and steady-state kinetic studies were performed. The inlets consisted of 0–600 ppm NO, 600 ppm NH3 and 3% O2 with N2 as the balance. A very high GHSV of 600–2400 dm3 g−1 h−1 (the total flow rate was 750 mL min−1 and the loading of the catalysts were 33–135 mg) was used to exclude the diffusion limitation (including the internal and external diffusion). The steady-state kinetic experiments were performed in the temperature range of 150–400 °C. The concentrations of outlet NH3 and N2O were obtained via the Nessler's reagent spectrophotometry method12 and N2O analyzer (Medi-Gas G200).3. Results and discussion
3.1 Catalytic performance
Fig. 1 illustrates the NO conversion, NH3 conversion and N2O selectivity of fresh and sulfated Ce/TiO2 catalysts. For the fresh Ce/TiO2 catalyst (Fig. 1A), it shows excellent SCR activity, which is higher than 75% in the temperature range of 180–330 °C. The higher NH3 conversion as compared to NO conversion at each temperature suggests that a part of the NH3 was oxidized to NO and N2O due to the catalytic oxidation (i.e., C–O reaction) and NSCR reaction, contributing to the decrease in the NO conversion with the increase in the reaction temperature to 330 °C. As for the sulfated Ce/TiO2 catalyst (Fig. 1B), a much more severely inhibited low-temperature SCR activity was observed. The reduced NO conversions for the sulfated catalyst with respect to fresh Ce/TiO2 were 75.6%, 66.2%, 45.5%, 36.8% and 26.8% at 150 °C, 180 °C, 210 °C, 240 °C, 270 °C, respectively, indicating that the sulfation effect of the Ce/TiO2 catalyst on NO conversion is greatly dependent on the reaction temperature. The lower the reaction temperature, the greater the negative effects of sulfation. Moreover, it was noted that the sulfated catalyst showed higher NO conversion, as compared to the fresh catalyst, at 330 °C, which was also reported in a previous study;13 the fresh Ce/TiO2 showed a decrease in NO conversion with the increase in reaction temperature from 300 to 330 °C. The sulfated Ce/TiO2 catalyst showed a lower N2O selectivity (lower than 13%) in the temperature range of 150–330 °C as compared with the fresh Ce/TiO2 catalyst. This result demonstrates that the sulfation of the Ce/TiO2 catalyst significantly inhibits the low-temperature SCR activity while showing a higher SCR activity at 330 °C as compared to the fresh Ce/TiO2 catalyst by inhibiting the catalytic oxidation of NH3 to NO. The SCR performance and N2O selectivity of the 240 °C-sulfated catalyst are similar to those of the 180 °C-sulfated catalyst shown in Fig. S1.†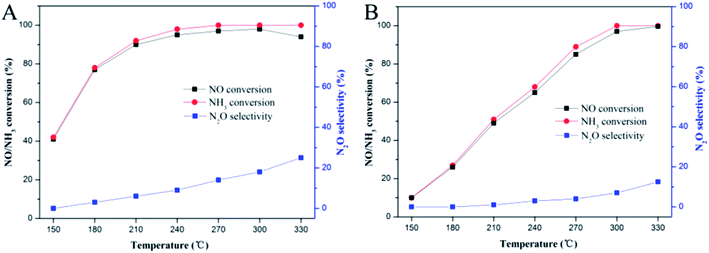 | ||
Fig. 1 SCR performance and N2O selectivity of (A) fresh Ce/TiO2 and (B) 180 °C-sulfated Ce/TiO2. Reaction conditions: [NH3] = [NO] = 600 ppm, [O2] = 3%, N2 balance, GHSV = 40![[thin space (1/6-em)]](https://www.rsc.org/images/entities/char_2009.gif) 000 h−1. 000 h−1. | ||
3.2 Characterisations of the catalysts before and after SO2 sulfation
| Sample | S BET (m2 g−1) | Reaction rate constanta (cm3 g−1 s−1) | Reaction rate constantb (mL m2 s−1) | Reaction rate constantc (cm3 g−1 s−1) | Reaction rate constantd (mL m2 s−1) |
|---|---|---|---|---|---|
| a Calculated by the NOx conversion at 150 °C. b Calculated by the NOx conversion at 150 °C and SBET result. c Calculated by the NOx conversion at 270 °C. d Calculated by the NOx conversion at 270 °C and SBET result. | |||||
| Fresh Ce/TiO2 | 132.9 | 6.59 | 0.050 | 43.8 | 0.329 |
| 180 °C-sulfated | 106.5 | 1.32 | 0.012 | 23.71 | 0.223 |
| 240 °C-sulfated | 108.4 | 1.74 | 0.016 | 26.50 | 0.244 |
The pseudo-first-order rate constants of the fresh and sulfated Ce/TiO2 catalysts were calculated according to eqn (3) and shown in Table 1. The rate constants of the fresh Ce/TiO2 catalyst calculated by mass and the SBET result at 150 °C are 6.59 cm3 g−1 s−1 and 0.050 mL m2 s−1, respectively, which are much higher than the rate constants of the sulfated Ce/TiO2 catalyst. With the increase in the reaction temperature to 270 °C, the rate constants of the sulfated Ce/TiO2 catalyst calculated by mass and SBET obviously increased, which narrowed the gap between the rate constants of the fresh and sulfated Ce/TiO2 catalysts. These results demonstrate that the decrease in SCR activity at 150 °C is not attributed to the structure parameters, but due to the change in the chemical properties after sulfation treatment. At 270 °C, the inhibition effect of the sulfation treatment on NOx conversion is weakened, suggesting that the low-temperature SCR activity is sensitive to the change in the chemical properties after sulfation treatment while middle and high-temperature SCR activity is less affected. More characterizations were further performed to elucidate the chemical properties.
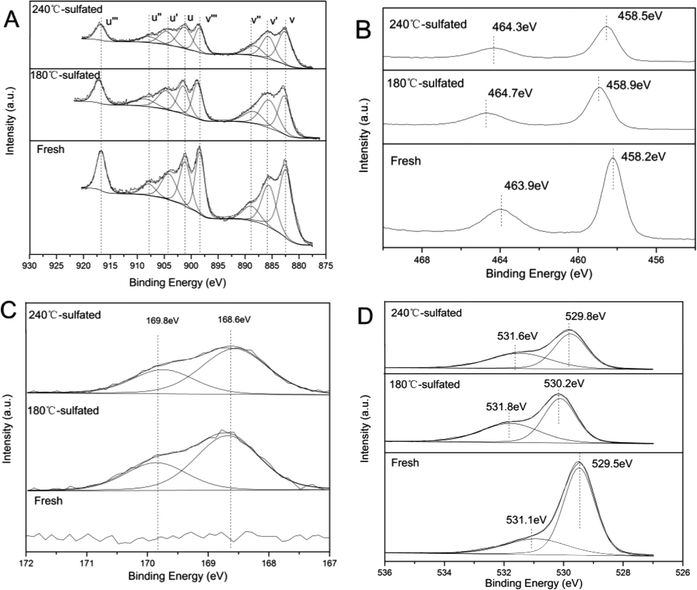 | ||
| Fig. 2 XPS results for (A) Ce3d, (B) Ti2p, (C) S2p, and (D) O1s of the fresh and sulfated catalysts. | ||
| Sample (Ce/TiO2) | Atomic concentration (at%) | Atomic ratio (%) | |||||
|---|---|---|---|---|---|---|---|
| Ce | Ti | O | S | Ce3+/Ce | Oα/(Oα + Oβ) | Bulk Sa | |
| a Atomic ratio of S on the bulk of samples from XRF characterization. | |||||||
| Fresh | 6.07 | 24.95 | 68.97 | — | 25.6 | 26.7 | 0 |
| 180 °C-sulfated | 4.92 | 19.92 | 69.14 | 6.01 | 30.9 | 43.6 | 1.4 |
| 240 °C-sulfated | 5.07 | 20.20 | 70.31 | 4.42 | 26.9 | 42.9 | 1.7 |
The Ti2p spectra of the fresh and sulfated Ce/TiO2 catalyst are shown in Fig. 2B. The binding energies of the Ti2p photoelectron peaks over the fresh Ce/TiO2 catalyst are about 458.2 eV and 463.9 eV, representing Ti2p3/2 and Ti2p1/2, respectively. It is indicated that Ti exists in the form of the Ti4+ oxidation state. After sulfation treatment, the binding energy of both Ti2p3/2 and Ti2p1/2 shift to higher values. It is implied that the Ti species have lower electron density as compared to Ti species in the fresh Ce/TiO2 catalyst, further indicating the stronger inductive effect of the S![[double bond, length as m-dash]](https://www.rsc.org/images/entities/char_e001.gif) O bond.19 Compared with the 180 °C-sulfated catalyst, there is a lower binding energy of Ti2p over the 240 °C-sulfated catalyst, which is close to that over the fresh Ce/TiO2 catalyst, further confirming the lower concentration of surface S species.
O bond.19 Compared with the 180 °C-sulfated catalyst, there is a lower binding energy of Ti2p over the 240 °C-sulfated catalyst, which is close to that over the fresh Ce/TiO2 catalyst, further confirming the lower concentration of surface S species.
Fig. 2C and D show the S2p and O1s spectra of the fresh and sulfated Ce/TiO2 catalysts. According to the literature,20 the S2p spectra can be split into two doublets of S2p3/2 (168.6 eV) and S2p1/2 (169.8 eV), and the spin–orbit splitting of each doublet is 1.18 eV. These two doublets can be attributed to hexavalent sulfur.
The O1s ionization features of the fresh and sulfated Ce/TiO2 catalysts are numerically fitted into two sub-bands.21–23 These include an intense peak located at 529.5 eV and a faint peak at 531.1 eV over the fresh Ce/TiO2 catalyst, which represent lattice oxygen (O2−, denoted as Oβ) and chemisorbed oxygen or weakly bonded oxygen species (O22− or O−, denoted as Oα), respectively. After sulfation treatment, the binding energies of Oα and Oβ shift towards higher values (0.3–0.7 eV), which is due to the stronger affinity of S bonded to the oxygen species. As shown in Table 2, the surface concentration of lattice oxygen follows an upward trend from 26.7% to 43.6% and 42.9%, respectively, as along with the Ce3+/Ce ratio. Generally, Oα is generated during the transition from Ce4+ to Ce3+ according to the following reaction: 2Ce4+ + 2O2− ↔ 2Ce4+ + O2 + 2e−/Vd2+ ↔ Ce3+–Vd–Ce3+ + O2. The symbol Vd represents the defects and oxygen vacancies generated from the removal of lattice oxygen due to the formation of Ce2(SO4)3.
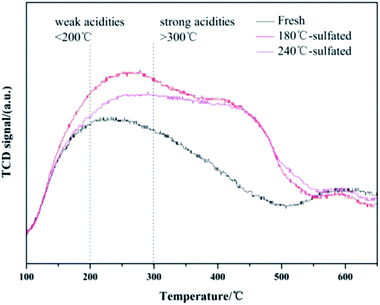
It is believed that the capacity for NH3 adsorption is related to the surface area of the catalyst. The enhanced capacity of NH3 adsorption and the higher desorption temperature indicate the changes in the acid sites for NH3 adsorption after sulfation treatment. In order to further investigate the changes in acid sites over the fresh catalyst and the sulfated catalysts, in situ DRIFTS was performed during the NH3 adsorption/desorption within the temperature range from 150 °C to 400 °C, shown in Fig. S4.† The main characteristic vibrations of NH3 adsorption over the fresh Ce/TiO2 catalyst are at 1680 cm−1, 1598 cm−1, and 1170 cm−1 (Fig. S4(A)†). The band at 1680 cm−1 can be attributed to the symmetric stretching vibration of NH4+ species on Bronsted acid sites,29,30 while the band at 1598 cm−1 can be assigned to the formation of nitrate intermediates due to the excessive catalytic oxidation of NH3 by lattice oxygen.31 The band at 1170 cm−1 can be assigned to the symmetric stretching vibration of NH3 adsorbed on the Lewis acid sites. The bands at 3100–3400 cm−1 are attributed to the vibrations of N–H bonds, and the negative bands due to the O–H vibrations at 3716 and 3658 cm−1 also showed up. For the sulfated catalysts shown in Fig. S4(B),† several bands at 1000–1700 cm−1 and 3100–3700 cm−1 were seen. The band at 1670 cm−1 and 1432 cm−1 could be due to the symmetric and asymmetric stretching vibrations of N–H bonds adsorbed on the Bronsted acid sites.32,33 These vibrations are related to the adsorbed SO2 on the unsaturated metallic sites, which further provide more sites for the adsorption of H and further form S–OH groups to form the Bronsted acid sites.34 The bands at 1319 cm−1, 1262 cm−1 and 1096 cm−1 could be assigned to the vibrations of NH3 adsorbed on Lewis acid sites. Two negative bands centered at 3708 cm−1 and 3666 cm−1 can be assigned to the consumption of Ce–OH due to NH3 adsorption. The other negative band at 1367–1351 cm−1 can be attributed to NH3 adsorption on O![[double bond, length as m-dash]](https://www.rsc.org/images/entities/char_e001.gif) S
S![[double bond, length as m-dash]](https://www.rsc.org/images/entities/char_e001.gif) O on the surface of SO42− sites.35 With the increase in the temperature of the IR cell (from 150 to 400 °C), the intensity of the negative band at 1367–1351 cm−1 gradually decreased due to the desorption of NH3 from surface SO42− sites. It should be noted that after the sulfation treatment, the band at 1598 cm−1 still exists on the catalyst but the strength of the peak is significantly reduced, indicating that the excessive catalytic oxidation of NH3 was inhibited after the sulfation treatment.
O on the surface of SO42− sites.35 With the increase in the temperature of the IR cell (from 150 to 400 °C), the intensity of the negative band at 1367–1351 cm−1 gradually decreased due to the desorption of NH3 from surface SO42− sites. It should be noted that after the sulfation treatment, the band at 1598 cm−1 still exists on the catalyst but the strength of the peak is significantly reduced, indicating that the excessive catalytic oxidation of NH3 was inhibited after the sulfation treatment.
The integration of the peaks at 1300–1150 cm−1 (for Lewis acid sites), 1432 cm−1 (for Bronsted acid sites over sulfated catalysts) and 1680 cm−1 (for Bronsted acid sites over fresh Ce/TiO2 catalyst) were calculated. As shown in Table S1,† there are significantly more Bronsted acid sites on the sulfated catalysts as compared to the fresh Ce/TiO2, which are 5.54 vs. 0.62, respectively. The negative band of O![[double bond, length as m-dash]](https://www.rsc.org/images/entities/char_e001.gif) S
S![[double bond, length as m-dash]](https://www.rsc.org/images/entities/char_e001.gif) O provides more Bronsted acid sites in the sacrifice of Lewis acid sites. Thus, the Lewis acid sites of the sulfated catalysts almost disappear, which are 0.48 vs. 4.47 with respect to the fresh catalyst, respectively. Moreover, it can be speculated that for the fresh Ce/TiO2 catalyst, the peak centered at 214 °C as shown in Fig. 4 could be attributed to the desorption of NH3 on the Lewis acid sites and the peak at 598 °C could be assigned to the desorption of NH4+ on the Bronsted acid sites. After sulfation, the peak at 242 °C can be assigned to NH3 desorbed from Lewis acid sites and most NH4+ desorbed from Bronsted acid sites. Therefore, it is suggested that the peak centered at 430 °C could be assigned to NH3 desorbed from strong Bronsted acid sites.
O provides more Bronsted acid sites in the sacrifice of Lewis acid sites. Thus, the Lewis acid sites of the sulfated catalysts almost disappear, which are 0.48 vs. 4.47 with respect to the fresh catalyst, respectively. Moreover, it can be speculated that for the fresh Ce/TiO2 catalyst, the peak centered at 214 °C as shown in Fig. 4 could be attributed to the desorption of NH3 on the Lewis acid sites and the peak at 598 °C could be assigned to the desorption of NH4+ on the Bronsted acid sites. After sulfation, the peak at 242 °C can be assigned to NH3 desorbed from Lewis acid sites and most NH4+ desorbed from Bronsted acid sites. Therefore, it is suggested that the peak centered at 430 °C could be assigned to NH3 desorbed from strong Bronsted acid sites.
3.3 Reaction mechanism study by in situ DRIFTS
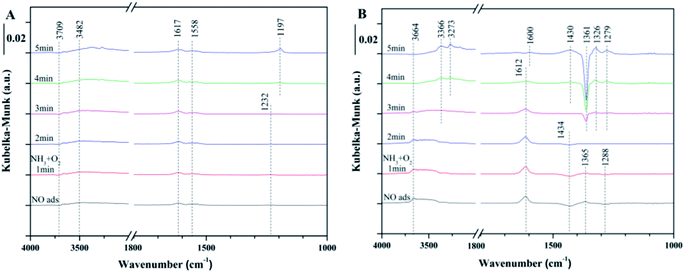 | ||
| Fig. 5 In situ DRIFTS of the reaction between NH3 + O2 and pre-adsorbed NO at 240 °C over (A) fresh Ce/TiO2, and (B) 180 °C-sulfated catalysts. | ||
As for the 180 °C-sulfated catalyst, several bands at 1612, 1434, 1365 and 1288 cm−1 were observed as shown in Fig. 5B. These can be assigned to surface nitrate species (1612 cm−1 for NO2, 1365 cm−1 for free NO3− (ref. 36)). The negative band at 1434 cm−1 and 1288 cm−1 can be assigned to NO adsorption on the S![[double bond, length as m-dash]](https://www.rsc.org/images/entities/char_e001.gif) O of surface SO42− sites. With the introduction of NH3 + O2, the intensity of the negative bands gradually decreased due to the desorption of NO from surface SO42− sites, indicating that the adsorbed NO on SO42− is reactive. It can be seen that the intensities of NO2 and nitrates obviously decreased with the introduction of NH3 + O2. Moreover, the adsorbed NH3/NH4+ and nitrite/nitrate species on the surface of the sulfated catalyst cannot coexist. This could be due to the reaction between adsorbed nitrite/nitrate species with NH3 to form NH4NO3 and then decompose to N2 and H2O,37 suggesting that the reaction between adsorbed NO and gaseous NH3 can proceed by the L–H reaction pathway. Moreover, the negative band at 1361 cm−1 can be attributed to NH3 adsorption on the S
O of surface SO42− sites. With the introduction of NH3 + O2, the intensity of the negative bands gradually decreased due to the desorption of NO from surface SO42− sites, indicating that the adsorbed NO on SO42− is reactive. It can be seen that the intensities of NO2 and nitrates obviously decreased with the introduction of NH3 + O2. Moreover, the adsorbed NH3/NH4+ and nitrite/nitrate species on the surface of the sulfated catalyst cannot coexist. This could be due to the reaction between adsorbed nitrite/nitrate species with NH3 to form NH4NO3 and then decompose to N2 and H2O,37 suggesting that the reaction between adsorbed NO and gaseous NH3 can proceed by the L–H reaction pathway. Moreover, the negative band at 1361 cm−1 can be attributed to NH3 adsorption on the S![[double bond, length as m-dash]](https://www.rsc.org/images/entities/char_e001.gif) O of the surface SO42− sites. It is speculated that the NO adsorption on O
O of the surface SO42− sites. It is speculated that the NO adsorption on O![[double bond, length as m-dash]](https://www.rsc.org/images/entities/char_e001.gif) S
S![[double bond, length as m-dash]](https://www.rsc.org/images/entities/char_e001.gif) O causes the vibrations of S
O causes the vibrations of S![[double bond, length as m-dash]](https://www.rsc.org/images/entities/char_e001.gif) O and O–N, contributing to the shift in the vibration of SO42− from 1434 cm−1 to 1361 cm−1. The integration area of the adsorbed NO bands have been calculated and are shown in Fig. S5.† It can be seen that the reactivity of adsorbed NO over the fresh Ce/TiO2 catalyst was inhibited and the nitrite/nitrate formed on the sulfated Ce/TiO2 catalyst was reactive during the SCR reaction.
O and O–N, contributing to the shift in the vibration of SO42− from 1434 cm−1 to 1361 cm−1. The integration area of the adsorbed NO bands have been calculated and are shown in Fig. S5.† It can be seen that the reactivity of adsorbed NO over the fresh Ce/TiO2 catalyst was inhibited and the nitrite/nitrate formed on the sulfated Ce/TiO2 catalyst was reactive during the SCR reaction.
![[double bond, length as m-dash]](https://www.rsc.org/images/entities/char_e001.gif) O of the surface of SO42− sites.35 With the introduction of NO + O2, the intensity of the negative band at 1358 cm−1 decreased gradually, indicating that the adsorbed NH3 on SO42− is reactive. After 60 min, all of the peaks associated with NH3 bands disappeared and new bands at 1613 cm−1, 1430 cm−1 and 1361 cm−1 were observed. The negative band at 1430 cm−1 can be assigned to NO adsorption on S
O of the surface of SO42− sites.35 With the introduction of NO + O2, the intensity of the negative band at 1358 cm−1 decreased gradually, indicating that the adsorbed NH3 on SO42− is reactive. After 60 min, all of the peaks associated with NH3 bands disappeared and new bands at 1613 cm−1, 1430 cm−1 and 1361 cm−1 were observed. The negative band at 1430 cm−1 can be assigned to NO adsorption on S![[double bond, length as m-dash]](https://www.rsc.org/images/entities/char_e001.gif) O of the surface SO42− sites.
O of the surface SO42− sites.
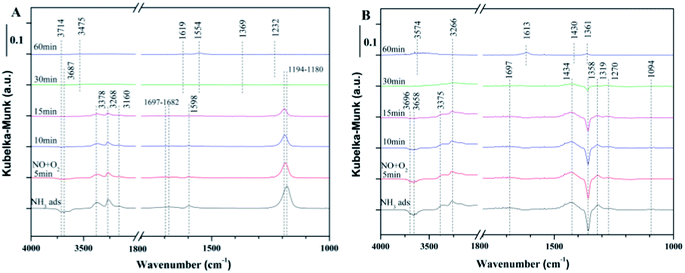 | ||
| Fig. 6 In situ DRIFTS of the reaction between NO + O2 and the pre-adsorbed NH3 at 240 °C over (A) fresh Ce/TiO2, (B) 180 °C sulfated catalyst. | ||
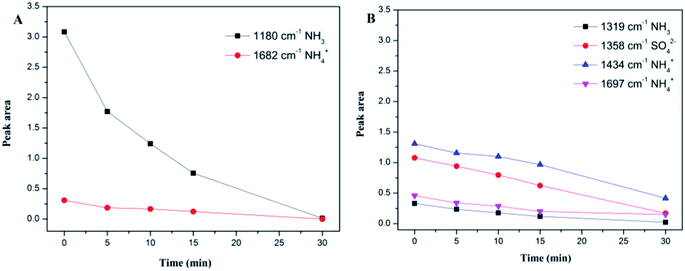
The integration areas of the adsorbed NH3 bands were calculated and are shown in Fig. 7. It can be seen from Fig. 7A that the intensities of the coordinated NH3 and NH4+ decreased rapidly. For the sulfated Ce/TiO2 catalyst, the bands associated with NH3 and NH4+ decreased slowly and still existed after purging with NO + O2 for 30 min, suggesting that the E–R reaction pathway between the adsorbed NH3 and gaseous NO was inhibited in spite of the enhanced acidity over the 180 °C-sulfated catalyst.
3.4 Kinetic studies
During the SCR reaction, the nonselective catalytic reduction reaction (NSCR reaction) and the catalytic oxidation of NH3 to NO (i.e., C–O reaction) may happen simultaneously. Therefore, in order to further identify the contribution of the SCR reaction following the L–H reaction pathway and the E–R reaction pathway, NSCR reaction and the C–O reaction over the fresh and sulfated Ce/TiO2 catalyst, the steady-state kinetic studies were performed as shown in Fig. S6 and S7.† It can be seen that the NH3 conversion rate (δNH3), NOx conversion rate (δNO) and N2O formation rate (δN2O) over the fresh and the sulfated catalysts increased with the increase in NO concentration. The rate of the SCR reaction (δSCR) also increased and exhibited a linear relationship with the NO concentration (the correlation coefficients are higher than 0.99), indicating that the reaction order of the SCR reaction in relation to the gaseous NO concentration is 1. Moreover, the rate of the C–O reaction (δC–O) decreased with the increase in gaseous NO concentration, indicating that the reaction order of the C–O reaction in relation to the gaseous NO concentration is less than zero.The SCR reaction, C–O reaction and NSCR reaction all contribute to NH3 conversion. Thus, the NH3 conversion rate can be described as
| δNH3 = δSCR + δC–O + δNSCR | (4) |
Both the SCR reaction and NSCR reaction contribute to the NOx conversion, while the C–O reaction contributes to the formation of NOx. Thus, the NO conversion rate can be described as
| δNO = δSCR + δNSCR − δC–O | (5) |
Therefore, the rates of SCR and C–O reaction can be described as
 | (6) |
 | (7) |
The kinetic models of the L–H reaction, E–R reaction, NSCR reaction and C–O reaction over the fresh Ce/TiO2 catalyst and the sulfated Ce/TiO2 catalyst are shown in ESI.† All the reaction paths have been widely recognized and are suitable for the ceria-based catalyst.38 According to eqn (10S) and (11S),† the rate of the SCR reaction over the ceria-based catalyst can be described as
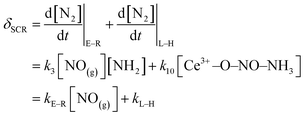 | (8) |
The rate of the NSCR reaction over the ceria-based catalyst can be described as
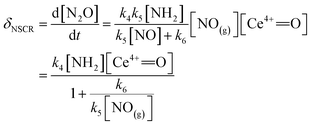 | (9) |
The rate of C–O reaction over the Ce/TiO2 catalyst can be described as
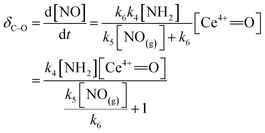 | (10) |
It can be seen from Fig. S6(D) and S7(D)† that the rate of the SCR reaction calculated according to eqn (6) is linear with the gaseous NO concentration (the correlation coefficients are higher than 0.99), which is in line with eqn (8). The parameters of kL–H and kE–R of the SCR reaction were calculated by the linear fitting of Fig. S6(D) and S7(D),† and the results are shown in Table 3.
| Temperature/°C | δ SCR = kE–R[NO(g)] + kL–H | δ C–O([NO] = 600 ppm) | |||
|---|---|---|---|---|---|
| k L–H | k E–R/106 | R 2 | |||
| Ce/TiO2 | 150 | 3.61 | 0.008 | 0.995 | 1.31 |
| 200 | 3.71 | 0.059 | 0.996 | 4.72 | |
| 250 | 4.672 | 0.165 | 0.998 | 19.90 | |
| 300 | 20.05 | 0.238 | 0.999 | 30.45 | |
| 350 | 89.16 | 0.443 | 0.999 | 62.69 | |
| 400 | 188.76 | 0.436 | 0.999 | 191.95 | |
| Sulfated Ce/TiO2 | 150 | 0.151 | 0.003 | 0.997 | 0.19 |
| 200 | 0.53 | 0.022 | 0.998 | 3.33 | |
| 250 | 14.84 | 0.043 | 0.999 | 15.49 | |
| 300 | 18.22 | 0.153 | 0.999 | 27.41 | |
| 350 | 87.53 | 0.414 | 0.999 | 50.6 | |
| 400 | 133.91 | 0.539 | 0.999 | 128.25 | |
According to eqn (8), kL–H is dependent on k10 and the concentration of surface NH4NO2. k10 increases rapidly with the increase in the reaction temperature and thus, kL–H increased with the increase in reaction temperature as shown in Table 3. The in situ DRIFTS results in Fig. 6 demonstrate that the reactivity of NO adsorbed on the fresh Ce/TiO2 catalyst at 240 °C is restricted, while the reaction between the adsorbed NO and gaseous NH3 over the sulfated Ce/TiO2 catalyst can proceed by the L–H reaction pathway due to the formation of NH4NO2 and its decomposition to N2 and H2O. Thus, the NH4NO2 formed on the sulfated Ce/TiO2 catalysts was much more than that on the fresh Ce/TiO2 catalyst at 240 °C, contributing to the higher concentration of the surface NH4NO2 over the sulfated Ce/TiO2 catalyst. Therefore, the kL–H value of the sulfated Ce/TiO2 catalyst at 250 °C is higher than that of the fresh Ce/TiO2 catalyst. With the increase in the reaction temperature, the chemical bonds between NO and the fresh Ce/TiO2 catalyst may be activated, facilitating the formation of NH4NO2 over the fresh Ce/TiO2 catalyst. Thus, the kL–H value of the fresh Ce/TiO2 catalyst is higher than that of the sulfated Ce/TiO2 catalyst.
According to eqn (16S),† the kE–R value is dependent on k3 and the concentration of surface NH2. According to eqn (12S),† the concentration of surface NH2 is mainly related to the oxidation of surface Ce4+, k2 and the concentration of adsorbed NH3. With the increase in the reaction temperature, the oxidation of Ce4+ and k2 increased while the adsorption of NH3 decreased. Thus, the concentration of surface NH2 may show a peak value with the increase in reaction temperature, contributing to the peak value of kE–R at 350 °C as shown in Table 3, which is in line with previous study.39 For the sulfated Ce/TiO2 catalyst, the promotion of acidity is more pronounced at middle temperatures than that at low temperatures as shown in Fig. 4. Thus, the concentration of surface NH2 may increase further, contributing to the increased kE–R with the increase in the reaction temperature to 400 °C.
3.5 The mechanism of the SCR performance of the fresh Ce/TiO2 catalyst is better than that of sulfated Ce/TiO2
Table 3 shows that the rate constant of the E–R reaction (kE–R) is much higher than that of the L–H reaction (kL–H), suggesting that the E–R reaction mechanism dominates in the standard SCR reaction. According to kinetic studies, the contribution of the C–O reaction and the NSCR reaction at low temperature can be neglected. Therefore, the severely inhibited low-temperature NO conversion of the sulfated Ce/TiO2 catalyst is due to the inhibited reaction rate of the SCR reaction, more precisely, the reaction rate of the E–R reaction. According to eqn (12S),† the concentration of NH2 is dependent on k2, the concentration of Ce4+![[double bond, length as m-dash]](https://www.rsc.org/images/entities/char_e001.gif) O and the adsorbed NH3. The H2-TPR results suggest that the reducibility of the sulfated Ce/TiO2 was severely inhibited, indicating that the rate constant of reaction (2S)† (k2) over the sulfated Ce/TiO2 catalyst is much lower than that over the fresh Ce/TiO2 catalyst. The XPS results show that the concentration of the surface Ce4+
O and the adsorbed NH3. The H2-TPR results suggest that the reducibility of the sulfated Ce/TiO2 was severely inhibited, indicating that the rate constant of reaction (2S)† (k2) over the sulfated Ce/TiO2 catalyst is much lower than that over the fresh Ce/TiO2 catalyst. The XPS results show that the concentration of the surface Ce4+![[double bond, length as m-dash]](https://www.rsc.org/images/entities/char_e001.gif) O over the sulfated Ce/TiO2 is less than that over the fresh Ce/TiO2 catalyst. NH3-TPD suggests that the concentration of NH3 adsorbed on the sulfated Ce/TiO2 catalyst is higher as compared to the fresh Ce/TiO2 catalyst, which is approximately 1.18 times that of the fresh Ce/TiO2 catalyst according to the NH3-DRIFT results (Table S1†). Thus, the concentration of NH2 over the sulfated Ce/TiO2 catalyst is much lower than that over the fresh Ce/TiO2 catalyst and, therefore, the k3[NH2] over sulfated Ce/TiO2 is much lower than that over fresh Ce/TiO2 catalyst, contributing to the much lower reaction rate of the E–R reaction (reaction (3S)†). It is suggested that reaction (2S)† is the rate-determining step in the SCR reaction following the E–R reaction pathway. In conclusion, the reason for the inhibited low-temperature performance with enhanced NH3 adsorption is as follows. Firstly, the NH3-TPD results demonstrate that the sulfated Ce/TiO2 catalyst has significantly more strongly acidic sites as compared to the fresh Ce/TiO2 catalyst. The strong binding of NH3 to the sulfated Ce/TiO2 catalyst restricts its reactivity with gaseous NO, which is hard to overcome for reaction (2S)† to proceed. Secondly, the formation of cerium sulfites/sulfates inhibited the reduction rate of Ce4+ to Ce3+ after the sulfation treatment, resulting in the inhibition of the reaction rate of reaction (2S)† (k2).
O over the sulfated Ce/TiO2 is less than that over the fresh Ce/TiO2 catalyst. NH3-TPD suggests that the concentration of NH3 adsorbed on the sulfated Ce/TiO2 catalyst is higher as compared to the fresh Ce/TiO2 catalyst, which is approximately 1.18 times that of the fresh Ce/TiO2 catalyst according to the NH3-DRIFT results (Table S1†). Thus, the concentration of NH2 over the sulfated Ce/TiO2 catalyst is much lower than that over the fresh Ce/TiO2 catalyst and, therefore, the k3[NH2] over sulfated Ce/TiO2 is much lower than that over fresh Ce/TiO2 catalyst, contributing to the much lower reaction rate of the E–R reaction (reaction (3S)†). It is suggested that reaction (2S)† is the rate-determining step in the SCR reaction following the E–R reaction pathway. In conclusion, the reason for the inhibited low-temperature performance with enhanced NH3 adsorption is as follows. Firstly, the NH3-TPD results demonstrate that the sulfated Ce/TiO2 catalyst has significantly more strongly acidic sites as compared to the fresh Ce/TiO2 catalyst. The strong binding of NH3 to the sulfated Ce/TiO2 catalyst restricts its reactivity with gaseous NO, which is hard to overcome for reaction (2S)† to proceed. Secondly, the formation of cerium sulfites/sulfates inhibited the reduction rate of Ce4+ to Ce3+ after the sulfation treatment, resulting in the inhibition of the reaction rate of reaction (2S)† (k2).
With the increase in the reaction temperature to 350 °C, although the adsorbed NH3 desorbed from the surface of the fresh and sulfated Ce/TiO2 catalyst, the adsorption of NH3 over the sulfated Ce/TiO2 catalyst at middle temperatures was obviously greater than that over the fresh Ce/TiO2 catalyst. Moreover, the weaker binding of NH3 with the sulfated Ce/TiO2 catalyst promoted the reactivity of the adsorbed NH3 with gaseous NO and the redox properties of the sulfated Ce/TiO2 catalyst was significantly enhanced, suggesting that more adsorbed NH3 dissociated into NH2 according to reaction (2S).† Thus, the reaction rate of the E–R reaction pathway over the sulfated Ce/TiO2 catalyst was close to that over the fresh Ce/TiO2 catalyst. Moreover, the rate of the C–O reaction of the sulfated Ce/TiO2 catalyst was obviously lower than that of the fresh Ce/TiO2 catalyst, shown in Fig. S6(E) and S7(E).† Therefore, NO conversion at 330 °C over the sulfated catalyst was higher than that over the fresh Ce/TiO2 catalyst. The promotion of NO conversion over the sulfated catalyst at 330 °C, as shown in Fig. 1, is attributed to both the increase in the reaction rate of the E–R reaction and the inhibition of the C–O reaction.
4. Conclusions
The sulfation effect of the Ce/TiO2 catalyst on NO conversion was found to be dependent on the reaction temperature. Significantly inhibited low-temperature SCR activity and enhanced SCR activity at higher temperature were found. Comprehensive characterizations, in situ DRIFT studies and kinetic studies were performed to investigate the mechanisms of these inhibiting and enhancing effects. It can be concluded that the different sulfation effects of the Ce/TiO2 on SCR activity at different reaction temperatures can be attributed to the different reaction rates of the E–R reaction (kE–R). At 150 °C, the contribution of the C–O reaction and the NSCR reaction can be neglected. The severely inhibited low-temperature SCR activity is due to the inhibited redox properties and excessive adsorption of NH3, which restrict the dissociation of NH3 to NH2, contributing to the much lower reaction rate of the E–R reaction over the sulfated Ce/TiO2 catalyst. With the increase in the reaction temperature, the reaction rate of the E–R reaction (kE–R) significantly increased due to the improved redox properties and the weakened binding of NH3 with the sulfated Ce/TiO2 catalyst. Moreover, the C–O reaction rate of the sulfated Ce/TiO2 catalyst is lower than that of the fresh Ce/TiO2 catalyst. Therefore, NO conversion at 330 °C over the sulfated catalyst is higher than that over the fresh Ce/TiO2 catalyst. It was demonstrated that the promotion of the NO conversion over the sulfated catalyst at 330 °C is attributed to both the increase in the reaction rate of the E–R reaction and the inhibition of the C–O reaction.Conflicts of interest
There are no conflicts to declare.Acknowledgements
This work was supported by the Policy leading Program (International Science and Technology Cooperation) Science and Technology Project of Jiangsu Province [grant number BZ2017014].References
- W. Müller, H. Ölschlegel, A. Schäfer, N. Hakim and K. Binder, Selective catalytic reduction-Europe's NOx reduction technology, Report 0148-7191, SAE Technical Paper, 2003 Search PubMed.
- J. Li, H. Chang, L. Ma, J. Hao and R. T. Yang, Catal. Today, 2011, 175, 147–156 CrossRef CAS.
- Y. Chen, C. Li, J. Chen and X. Tang, Environ. Sci. Technol., 2018, 52, 11796–11802 CAS.
- X. Li, X. Li, J. Li and J. Hao, Chem. Eng. J., 2017, 317, 70–79 CrossRef CAS.
- B. Li, Z. Ren, Z. Ma, X. Huang, F. Liu, X. Zhang and H. Yang, Catal. Sci. Technol., 2016, 6, 1719–1725 RSC.
- S. Deng, T. Meng, B. Xu, F. Gao, Y. Ding, L. Yu and Y. Fan, ACS Catal., 2016, 6, 5807–5815 CrossRef CAS.
- C. Li, G. Zeng, Y. Zhou and X. Zhang, Appl. Surf. Sci., 2015, 342, 174–182 CrossRef.
- D. W. Kwon, K. B. Nam and S. C. Hong, Appl. Catal., B, 2015, 166, 37–44 CrossRef.
- M. S. Maqbool, A. K. Pullur and H. P. Ha, Appl. Catal., B, 2014, 152, 28–37 CrossRef.
- L. Zhang, L. Li, Y. Cao, X. Yao, C. Ge, F. Gao, Y. Deng, C. Tang and L. Dong, Appl. Catal., B, 2015, 165, 589–598 CrossRef CAS.
- L. Xu, C. Wang, H. Chang, Q. Wu, T. Zhang and J. Li, Environ. Sci. Technol., 2018, 52, 7064–7071 CrossRef CAS.
- Shenyang Environmental Monitoring Central Station, Industry standard-environmental protection, 2009, HJ 533-2009 Search PubMed.
- F. Liu, K. Asakura, H. He, W. Shan, X. Shi and C. Zhang, Appl. Catal., B, 2011, 103, 369–377 CrossRef CAS.
- K. S. Sing, Pure Appl. Chem., 1985, 57, 603–619 CAS.
- M. Thommes, Chem. Ing. Tech., 2010, 82, 1059–1073 CrossRef CAS.
- A. Pfau and K. Schierbaum, Surf. Sci., 1994, 321, 71–80 CrossRef CAS.
- M. Y. Smirnov, A. V. Kalinkin, A. V. Pashis, A. M. Sorokin, A. S. Noskov, K. C. Kharas and V. I. Bukhtiyarov, J. Phys. Chem. B, 2005, 109, 11712–11719 CrossRef CAS PubMed.
- L. Zhang, W. Zou, K. Ma, Y. Cao, Y. Xiong, S. Wu, C. Tang, F. Gao and L. Dong, J. Phys. Chem. C, 2014, 119, 1155–1163 CrossRef.
- E. García-Bordejé, J. L. Pinilla, M. J. Lázaro, R. Moliner and J. L. G. Fierro, J. Catal., 2005, 233, 166–175 CrossRef.
- E. J. Romano and K. H. Schulz, Appl. Surf. Sci., 2005, 246, 262–270 CrossRef CAS.
- W. Wei, W. Ye, J. Wang, C. Huang, J.-B. Xiong, H. Qiao, S. Cui, W. Chen, L. Mi and P. Yan, ACS Appl. Mater. Interfaces, 2019, 11(5), 4900–4907 CrossRef.
- G. Zhang, W. Han, H. Zhao, L. Zong and Z. Tang, Appl. Catal., B, 2018, 226, 117–126 CrossRef CAS.
- W. Wei, W. Chen, L. Ding, S. Cui and L. Mi, Nano Res., 2017, 10, 3726–3742 CrossRef CAS.
- H. Wang, X. Chen, S. Gao, Z. Wu, Y. Liu and X. Weng, Catal. Sci. Technol., 2013, 3, 715–722 RSC.
- M. E. Yu, C. Li, G. Zeng, Y. Zhou, X. Zhang and Y. E. Xie, Appl. Surf. Sci., 2015, 342, 174–182 CrossRef CAS.
- P. Li, Y. Xin, Q. Li, Z. Wang, Z. Zhang and L. Zheng, Environ. Sci. Technol., 2012, 46, 9600–9605 CrossRef CAS.
- B. Murugan and A. V. Ramaswamy, J. Phys. Chem. C, 2008, 112, 20429–20442 CrossRef CAS.
- J.-a. Wang, Z.-l. Zhu and C.-l. Li, J. Mol. Catal. A: Chem., 1999, 139, 31–41 CrossRef CAS.
- L. Dall Acqua, I. Nova, L. Lietti, G. Ramis, G. Busca and E. Giamello, Phys. Chem. Chem. Phys., 2000, 2, 4991–4998 RSC.
- G. Ramis, L. Yi and G. Busca, Catal. Today, 1996, 28, 373–380 CrossRef CAS.
- M. A. Larrubia, G. Ramis and G. Busca, Appl. Catal., B, 2000, 27, L145–L151 CrossRef CAS.
- W. Hu, X. Gao, Y. Deng, R. Qu, C. Zheng, X. Zhu and K. Cen, Chem. Eng. J., 2016, 293, 118–128 CrossRef CAS.
- K. Hadjiivanov, Catal. Rev., 2000, 42, 71–144 CrossRef CAS.
- S. T. Choo, Y. G. Lee, I. S. Nam, S. W. Ham and J. B. Lee, Appl. Catal., A, 2000, 200, 177–188 CrossRef CAS.
- N. Y. Topsoe, H. Topsoe and J. A. Dumesic, J. Catal., 1995, 151, 226–240 CrossRef CAS.
- M. P. Ruggeri, T. Selleri, M. Colombo, I. Nova and E. Tronconi, J. Catal., 2015, 328, 258–269 CrossRef CAS.
- I. Nova, C. Ciardelli, E. Tronconi, D. Chatterjee and B. Bandl-Konrad, Catal. Today, 2006, 114, 3–12 CrossRef CAS.
- L. Ma, C. Y. Seo, M. Nahata, X. Chen, J. Li and J. W. Schwank, Appl. Catal., B, 2018, 232, 246–259 CrossRef CAS.
- S. Xiong, X. Xiao, Y. Liao, H. Dang, W. Shan and S. Yang, Ind. Eng. Chem. Res., 2015, 54, 11011–11023 CrossRef CAS.
Footnote |
| † Electronic supplementary information (ESI) available. See DOI: 10.1039/c9ra06985b |
| This journal is © The Royal Society of Chemistry 2019 |

