 Open Access Article
Three chiral one-dimensional lanthanide–ditoluoyl-tartrate bifunctional polymers exhibiting luminescence and magnetic behaviors†
Mei-rong
Han‡
 a,
Han-tao
Zhang‡
a,
Jia-nan
Wang
a,
Si-si
Feng
a,
Han-tao
Zhang‡
a,
Jia-nan
Wang
a,
Si-si
Feng
 *ab and
Li-ping
Lu
 *ab
*ab
aInstitute of Molecular Science, Key Laboratory of Chemical Biology and Molecular Engineering of the Education Ministry, Shanxi University, Taiyuan, Shanxi 030006, P. R. China. E-mail: ssfeng@sxu.edu.cn; luliping@sxu.edu.cn; Fax: +86-351-7011022; Tel: +86-351-7017974
bKey Laboratory of Materials for Energy Conversion and Storage of Shanxi Province, Shanxi University, Taiyuan, Shanxi 030006, P. R. China
First published on 10th October 2019
Abstract
Since Ln-CPs have excellent optical properties (higher color purity, longer fluorescence lifetime and higher quantum yield) and magnetic properties, it is of great significance to prepare dual magneto-optical materials based on Ln(III). Herein, we obtained three versatile Ln-CPs, [Ln(HDTTA)3(CH3OH)3]n, derived from reactions of lanthanide salts (Ln = Tb 1, Dy 2, Ho 3) and a chiral and flexible ligand, namely, (+)-di-p-toluoyl-D-tartaric acid (d-H2DTTA) in a methanol–water solution, at room temperature and pressure. The structures of these compounds have been characterized by single crystal and powder X-ray diffraction, infrared spectroscopy, elemental analyses and thermogravimetric analyses. Complexes 1–3 are isomorphic, crystallizing in the chiral trigonal R3 space group with the linkage of Ln3+ ions and featuring 1D propeller chain structures. The circular dichroism spectra confirm that the complexes maintain the chirality from the ligands. Furthermore, the luminescent and magnetic properties have been investigated, relying on intrinsic properties of the lanthanide ions. The photoluminescence measurements indicate that 1, 2 and 3 show strong green, white and blue emission bands with CIE chromaticity coordinates of (0.32, 0.56), (0.29, 0.26) and (0.21, 0.12), respectively. The decay lifetime curve of 1 shows the exponential decay with long lifetime of 1.169 ms and the relative quantum yield for 1 was 19.31%. In addition, the magnetic properties of complexes 1–3 have been investigated by measuring the magnetic susceptibility in the temperature range of 2–300 K. They are all dominated by spin–orbit coupling and ligand field perturbation, and the exchange coupling between Ln3+ ions is almost negligible. Therefore, complexes 1–3 are promising chiral, optical and magnetic multifunctional materials.
1. Introduction
In recent years, the rational design and syntheses of lanthanide coordination polymers (Ln-CPs) have attracted much attention due to their fascinating architectures and unique chemical and physical properties, especially optical and magnetic.1–4 A huge number of Ln-CPs have been investigated in luminescence fields due to their advantages of narrow emission spectra, good monochrome light performance, long luminescence lifetimes (milliseconds), high photoluminescence (PL) efficiency and large Stokes shifts.5–8 Compared to CPs based on transition metal ions, Ln-CPs have larger coordination spheres9 and more fascinating coordination geometries,10 which are especially beneficial for luminescent materials, because the luminescence intensity of lanthanide ions is very sensitive to structural details of the coordination environment. Beside luminescent properties, lanthanide ions also exhibit large magnetic moment and strong magnetic anisotropy, which could have potential applications in spintronics, quantum computing and information storage.11,12 So, lanthanide ions are good candidates for developing advanced multifunctional materials, which can incorporate both photoluminescent centers and magnetic properties simultaneously. Several classes of ligands such as cryptands,13 β-diketone,14 and carboxylic acid15 have been utilized to construct multifunctional Ln-CPs. Among all types of ligands, aromatic polycarboxylate ligands are most frequently used due to their plentiful coordination points, strong interactions with the lanthanide ions and various coordination modes, as well as the structuring effect through π stacking and hydrogen bonding. Moreover, aromatic polycarboxylate ligands may carry out multiple functions because they can be used as blue color sources and outstanding sensitizers to activate Ln3+ ions,16–19 and they can serve as mediators of the exchange spin coupling between metal ions by bridging carboxylate groups.20For the past few years, we have been working on Ln-CPs constructed by aromatic polycarboxylate ligands.21–23 As the following studies on this system, in the present work, we focus on novel Ln-CPs employing a chiral and flexible ligand, namely, ditoluoyl-tartaric acid (H2DTTA). This flexible dicarboxylic acid has two equal chiral carbon atoms, and the variable coordination modes provided by this carboxyl-rich molecule can lead to the isolation of metallo-organic hybrid topologies with multiple metal centers.24,25 Although the crystal structures of several ditoluoyl-tartrate metal/ammonium salts26–30 have been documented, however, only calcium,31 Ln (La, Nd, Eu, Gd and Tb),32,33 and Ln/K (Ln = Dy–Lu) complexes34 based l-H2DTTA have been reported. The coordination features and chemical properties of ditoluoyl-tartrate still need to be explored. Moreover, to the best of our knowledge, lanthanide complexes of d-H2DTTA enantiomer are practically unexplored, thus offering a good opportunity to exploit the chiral, optical and magnetic properties in view of the generation of new materials.
In this contribution, we used d-type (+)-di-p-toluoyl-D-tartaric acid (d-H2DTTA) and heavy lanthanide ions, and successfully prepared and structurally characterized three new coordination polymers, [Ln(HDTTA)3(CH3OH)3]n (Ln = Tb 1, Dy 2, Ho 3). It is worth mentioning that these compounds have been obtained at room temperature and pressure, even though Ln3+ coordination compounds are often synthesized via solvothermal methods.35 The structures of these Ln-CPs have been solved by single crystal X-ray diffraction, which crystallized in the chiral R3 space group, featuring 1D helical chain structure. Luminescence measurements show that upon excitation compound 1 mainly exhibits the characteristic transitions of corresponding Tb(III), and compound 2 exhibits white emissions originating from Dy(III) and the ligand, which evidences the presence of well-defined transitions characteristic for the considered lanthanide. The magnetic studies reveal that compounds 1–3 all exhibit the single ion magnetic behaviors. So these compounds are promising chiral, optical and magnetic multifunctional materials.
2. Experimental section
2.1. Materials and methods
The organic ligand d-H2DTTA was purchased from Jinan Henghua Sci. & Tec. Co. Ltd, and used directly without further purification. All reagents and solvents were of standard commercial grade and directly used without further purification. IR spectra were obtained on a BRUKER TENSOR27 spectrometer with KBr disks. Samples for EA experiments were dried under vacuum, and the analyses were performed with a CHN-O-Rapid instrument. PXRD data were collected on a Bruker D8 Advance X-ray diffractometer with Cu-Kα radiation (λ = 1.5418 Å). Thermogravimetric analyses (TGA) were performed on a Dupont thermal analyzer with a heating rate of 10 °C min−1 and under a nitrogen atmosphere. Circular dichroism (CD) spectra in the solid state were recorded with a JASCO J-810 dichrograph. The UV-vis diffuse reflectance spectra (DRS) were recorded by a TU-1950 spectrophotometer, and the wavelength ranged from 230–850 nm. Luminescence analyses were performed on a Fluoromax-4 Spectrofluorometer with a xenon arc lamp as the light source. Luminescence lifetime measurements were carried out on a Quantaurus-Tau Compact Fluorescence Lifetime Spectrometer C11347, and the quantum yields were measured on a Quantaurus-QY Absolute PL Quantum Yield Spectrometer C11347. The formula Φ = (Ec − Ea)/(La − Lc) was used for calculation, in which Ec represents the strongest emission spectrum of the samples, Ea for the emission spectrum of the “blank” at the same excitation wavelength as the samples, Lc for the samples absorption at the excitation wavelength and La for the “blank” absorption at the same excitation wavelength as the samples. Magnetic susceptibility measurements data were obtained with SQUID magnetometer (Quantum MPMS) in the temperature range 2.0–300 K by using an applied field of 1000 Oe.2.2. Syntheses of [Ln(HDTTA)3(CH3OH)3]n (Ln = Tb 1, Dy 2, Ho 3)
A 2.50 mL methanol solution of d-H2DTTA (69.50 mg, 0.18 mmol) was added to a 25 mL round-bottom flask. A 2.50 mL aqueous solution of TbCl3·6H2O or Dy(NO3)3·5H2O (52.60 mg/54.30 mg, 0.12 mmol) was added slowly to the solution. Then a 450 μL KOH (0.20 mol L−1) was carefully added to the solution and the pH values of the reaction solutions are 3, and 3.5, respectively. After stirring 7 h at room temperature, the filtrate was left undisturbedly for one week. Colorless needle-shaped crystals of 1 or 2 were obtained in 27.0% or 28.0% yield respectively based on d-H2DTTA.EA (%): calcd for C63H63O27Tb (1): C, 53.62; H, 4.50. Found: C 53.47, H 4.21. IR (KBr, ν/cm−1): 3467s, 2953w, 1734s, 1708s, 1673s, 1611s, 1509m, 1411m, 1267s, 1180s, 1109s, 1020m, 906w, 752s, 690w, 563w, 477w.
EA (%): calcd for C63H63O27Dy (2): C, 53.49; H, 4.49. Found: C 53.13, H 4.28. IR (KBr, ν/cm−1): 3459s, 2953w, 1733s, 1709s, 1674s, 1611s, 1509m, 1410m, 1267s, 1179s, 1108s, 1020s, 906w, 840w, 752s, 690w, 563w, 477w.
A 2.50 mL ethanol solution of d-H2DTTA (69.50 mg, 0.18 mmol) was added to a 25 mL round-bottom flask. A 2.50 mL aqueous solution of HoCl3·6H2O (45.50 mg, 0.12 mmol) was added slowly to the solution. Then a 600 μL KOH (0.20 mol L−1) was carefully added to the solution and the pH value of the reaction solution is 4. After stirring 7 h at room temperature, the mixture was filtered and left undisturbedly for one week. Light pink needle-shaped crystals of 3 were obtained in 30.0% yield based on d-H2DTTA. EA (%): calcd for C63H63O27Ho (3): C, 53.40; H, 4.48. Found: C 53.31, H 4.27. IR (KBr, ν/cm−1): 3462s, 2953w, 1734s, 1708s, 1674s, 1611s, 1509m, 1411m, 1338m, 1267s, 1180s, 1109s, 1020s, 906w, 841w, 752s, 689m, 563w, 477w.
2.3. X-ray crystallography
Single-crystal X-ray diffraction patterns for 1 were measured on a Bruker Smart Apex II diffractometer with a CCD area detector and Mo-Kα radiation (λ = 0.71073 Å) at room temperature. Single-crystal X-ray diffraction data for complexes 2 and 3 were collected at 100(2) K in the Beijing Synchrotron Radiation Facility (BSRF) beam-line 3W1A, which was equipped with a MARCCD-165 detector (λ = 0.7000 Å for 2 and 0.7200 Å for 3) with the storage ring working at 2.5 GeV. Data were collected by the MARCCD diffractometer and processed by using HKL 2000.36 Multi-scan program SADABS was used for absorption correction.37 The structures were solved by the direct method and refined by the full-matrix least squares method on F2 using the SHELXS-2014.38 All the non-H atoms were refined anisotropically. Hydrogen atoms attached to C and N atoms were placed geometrically and refined by using a riding model approximation, with C–H = 0.93–0.96 Å. Hydrogen atoms in hydroxyl and water molecules were located from difference Fourier maps and refined using their global Uiso value with O–H = 0.82 Å.A summary of the crystallographic data as well as the data collection and refinement parameters for compounds 1–3 is provided in Table 1. Crystallographic data in CIF format are deposited with the Cambridge Crystallographic Data Center as CCDC 1940269, 1939982 and 1939983 for 1–3. Selected bond lengths and angles for 1–3 are provided in Table S1.†
| Complex | 1 | 2 | 3 |
|---|---|---|---|
| a R 1 = ∑‖Fo| − |Fc‖/∑|Fo|. b wR2 = [∑w(Fo2 − Fo2)2/∑w(Fo2)2]1/2. | |||
| CCDC | 1940269 | 1939982 | 1939983 |
| Formula | C63H63TbO27 | C63H63DyO27 | C63H63HoO27 |
| Crystal system | Trigonal | Trigonal | Trigonal |
| Space group | R3 | R3 | R3 |
| a/Å | 27.187(1) | 27.165(9) | 27.072(9) |
| b/Å | 27.187(1) | 27.165(9) | 27.072(9) |
| c/Å | 7.617(8) | 7.652(1) | 7.637(1) |
| α/° | 90 | 90 | 90 |
| β/° | 90 | 90 | 90 |
| γ/° | 120 | 120 | 120 |
| V/Å3 | 4876.2(4) | 4890.5(5) | 4847.6(5) |
| T/K | 300(2) | 100(2) | 100(2) |
| Z | 3 | 3 | 3 |
| R int | 0.040 | 0.070 | 0.029 |
| GOF | 0.98 | 1.08 | 1.13 |
| F(000) | 2166 | 2169 | 2172 |
| D x /mg m−3 | 1.442 | 1.441 | 1.456 |
| μ, mm−1 | 1.17 | 1.18 | 1.35 |
| R 1/wR2 (I > 2σ(I))a | 0.0383/0.0934 | 0.0425/0.1037 | 0.0615/0.1504 |
| R 1/wR2 (all data)b | 0.0384/0.0935 | 0.0428/0.1042 | 0.0615/0.1504 |
| Δρmax, Δρmin (e Å−3) | 0.79, −0.57 | 1.55, −1.65 | 2.36, −0.63 |
3. Results and discussion
3.1. Syntheses and characterization of 1–3
The reaction routes of complexes 1–3 are shown in Scheme 1. The syntheses of 1–3 are pH dependent with the same reaction conditions, and the pH values of the reaction solutions are 3, 3.5, and 4, respectively (Scheme 1), which is related to the order of the lanthanide. In the case of Ho3+, it did not give crystalline compound, if maintaining the pH value between 3–3.5. That is, the pH value is important in the growth of single crystals, and a successive increase in the pH value is favorable for the complexes from Tb(III) to Ho(III). Similar pH dependent results of the lanthanide complexes were also reported.39 Complexes with heavy lanthanide ions (Er(III)–Lu(III)) are hard to obtain using the similar synthesis condition.3.2. IR spectra
The IR spectra of d-H2DTTA and complexes 1–3 are presented in Fig. S1.† The peaks of each group are similar in the range of 4000–400 cm−1. The absorption bands in the IR spectra show the characteristic stretching vibrations of O–H and COO− groups. The broad bands at 3467, 3459 and 3462 cm−1 indicate O–H stretching vibrations of the hydroxy groups and methanol molecules in the complexes 1–3.40,41 The strong bands at about 1734 and 1109 cm−1 are respectively assigned to the stretching vibrations of acyl C![[double bond, length as m-dash]](https://www.rsc.org/images/entities/char_e001.gif) O and ester C–O.42 The characteristic peaks of the asymmetric and symmetric stretching vibrations of the carboxylate groups are present at about 1673 and 1338 cm−1, which were clearly weaker in complexes compared to the free d-H2DTTA ligand, suggesting that the carboxylate groups in the complexes had been coordinated to the metal cations.43,44 The structural features of complexes as deduced from IR closely match the results of the single crystal X-ray analyses.
O and ester C–O.42 The characteristic peaks of the asymmetric and symmetric stretching vibrations of the carboxylate groups are present at about 1673 and 1338 cm−1, which were clearly weaker in complexes compared to the free d-H2DTTA ligand, suggesting that the carboxylate groups in the complexes had been coordinated to the metal cations.43,44 The structural features of complexes as deduced from IR closely match the results of the single crystal X-ray analyses.
3.3. Structure description
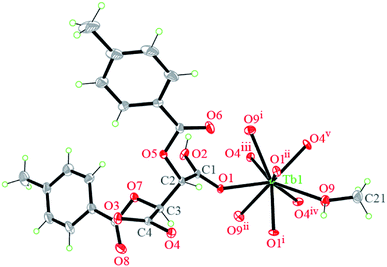
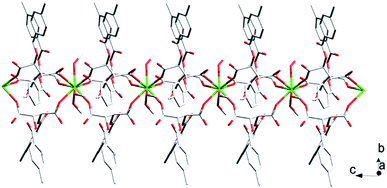
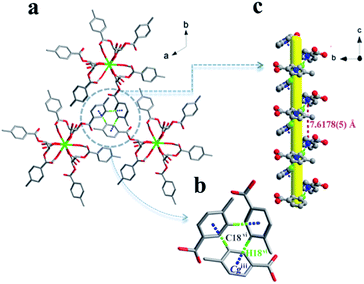
Notable are the patterns of snowflakes viewed from the crystallographic c-axis of complex 1, and the molecules are fully eclipsed (Fig. 4a). And it exhibits that a C18–H18⋯π inter-action with the centroid (Cg) of the benzene ring (atoms C14–C19), with a H18vi⋯Cgiii distance of 2.55 Å and a C18vi–H18vi⋯Cgiii angle of 155.2° (Table S2† and Fig. 4b). Complex 1 utilizes the C–H⋯π inter-actions to form a helical chain-like structure along the c axis, as shown in Fig. 4c. The yellow line shows the location of the 31 screw axis, with the pitch of screw 7.6178(5) Å, and the height of one complete helix turn is 1/3 translation of the c axis.
3.4. PXRD patterns and thermal analyses
To check the phase purity, the samples of complexes 1–3 were characterized by PXRD. As can be seen in Fig. S2,† the experimental PXRD patterns are almost identical to the calculated ones. The thermal stabilities have been investigated by TGA experiments under nitrogen atmosphere (Fig. S3†). Complexes 1–3 present the similar thermostability, so 1 is described here as a representative. The thermal gravimetric curve of 1 demonstrates that a weight of 6.7% in the temperature range 25–170 °C is lost, corresponding to the decomposition of three coordinated methanol molecules (calculated weight loss 6.8%) and showing the distinct endothermic peak. Above that the linked ligands begin to decompose rapidly. TG results show that the number of solvent molecules is almost consistent with the results of elemental analyses and crystal structure analyses, and the 1D skeleton structure is stable up to about 200 °C.3.5. UV-vis diffuse reflectance and circular dichroism spectrum
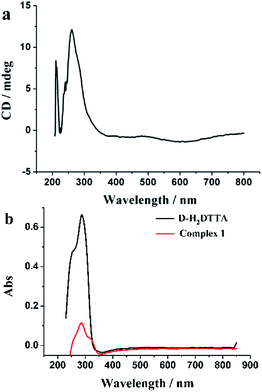
CD and DRS spectra of compound 1 were measured in solid. The CD spectra measured in KBr pellets further verify the chirality of the complexes. As seen in Fig. 5a, the CD spectrum of complex 1 shows two positive Cotton effects at 260 and 211 nm due to the n–π* transition in the carboxylic group. The chirality is consistent with that of d-tartaric acid which shows a single positive Cotton effect at 214 nm because of the different electronic nature of the carboxy group in the free acid and in its complex, and corresponds to the UV/vis DRS were measured for powder samples of complex 1 and d-H2DTTA, with the main absorption is in the range of 280–330 nm (Fig. 5b).49,503.6. Luminescence properties
It is a common sense to us that the carboxylate ligands can sensitize luminescence of trivalent lanthanide ions through an intramolecular energy-transfer process. Thus, the solid-state photoluminescent properties of d-H2DTTA and complexes were investigated at room temperature (Fig. 6). As shown in Fig. 6b, upon excitation at 300 nm, the d-H2DTTA ligand has a broad emission at 350 nm, relating to the transition between the ground state and the excited states of the intramolecular charge-transfer process.51,52 Interestingly, complex 1 features co-luminescence of the ligand and Tb3+ ion (Fig. 6a), and dominated by characteristic peaks of the Tb3+ ion. In the emission range of 300–450 nm, complex 1 keeps the same emission profile as the ligand with blue shift to 345 nm, and in the range of 450–800 nm, it displays the sharp characteristic peaks of the Tb3+ ion at 488, 543, 584 and 620 nm, which are attributed to the 5D4 → 7Fj (j = 6, 5, 4, 3) transitions, respectively. The strongest peak at 543 nm derives from the 5D4 → 7F5 transition, which is responsible for the bright green luminescence (Fig. S4a†) with CIE color coordinates of 0.32 and 0.56 (Fig. 6a, inset). The decay lifetime curve of 1 shows the exponential decay with reasonable long lifetime of 1.169 ms (Fig. 6a, inset) and the relative quantum yield for 1 was 19.31%, rendering this compound a promising candidate for the preparation of luminescent materials.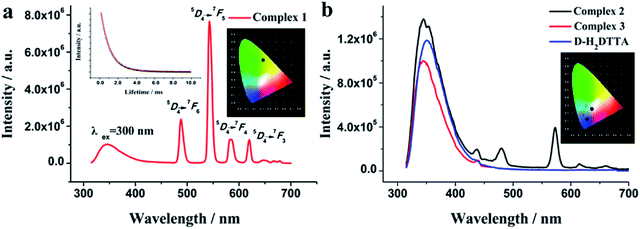 | ||
| Fig. 6 The luminescence spectra of complexes 1–3 and d-H2DTTA ligand at 293 K in the solid state (λex = 300 nm) (inset: the emission lifetime (left) and the CIE chromaticity diagram (right)). | ||
The emission spectrum of the dysprosium complex 2 is displayed in Fig. 6b; it exhibits broad fluorescence emission band of the ligand at 346 nm under excitation at 300 nm. The observed blue-shift compared to d-H2DTTA can be attributed to an intra-ligand π–π* transition. Moreover, complex 2 shows two weak emission bands originating from the f–f transitions of the Dy3+ ion in the visible region. The major emission bands at 479 and 572 nm correspond to the characteristic emissions originating from the 4F9/2 → 6H15/2 and 4F9/2 → 6H13/2 transitions of the Dy3+ ion,53–55 resulting in the white luminescence with CIE color coordinates of 0.29 and 0.26 (Fig. 6b, inset and Fig. S4b†). So far, Ln-CPs of single-component emitting white light remain rare to date,56–59 because luminescent emissions of Dy(III) complexes are usually weak. Comparable with 1, the emission arising from d-H2DTTA ligand observed in the spectrum of 2 indeed indicates the incomplete energy transfer from d-H2DTTA to the Dy3+ ion.19 A Dy-CP can be considered to emit both yellow (based on Dy) and blue (based on ligand) colors simultaneously. The BY dichromatic strategy is adopted to achieve white light emission in the balance of blue (B) and yellow (Y) colors, by changing the excitation wavelength. It is noteworthy that, this will provide an alternative approach to use Ln-CPs as single-phase white light emission for optical materials such as solid-state lighting, displays, biosensors, etc., which will make the preparation and operation easier, compared to the common strategy of using mixed-metal Ln-CPs (e.g. Eu and Tb) for white light emission.54,57–59
Notably, the characterized peaks for Ho3+ ion in complex 3 were almost undetected. It exhibits the CIE chromaticity coordinate (0.21, 0.12), which only presents blue-shift emission bands of d-H2DTTA at 345 nm under excitation at 300 nm, caused by the poor sensitization efficiency of the ligand for the Ho3+ ion.
The aromatic tartaric acid derivatives have been confirmed to be suitable for the sensitization of the luminescence of Ln3+ ions.25,32,45 The characteristics of luminescence emission in our complexes reconfirm the antenna effect of d-H2DTTA. Interestingly, complexes 1 and 2 display co-luminescence of ligand and Ln3+ ion, in which complex 1 features in the Tb3+ luminescence while complex 2 shows the combination luminescence of d-H2DTTA and Dy3+; whereas complex 3 dominates the blue luminescence of d-H2DTTA (Fig. 6b, inset and Fig. S4c†). The intensities of the energy transitions from d-H2DTTA ligand to the similar heavy lanthanide ions are different, possibly due to the different band gaps of various Ln3+ cations.
3.7. Magnetic properties
The temperature-dependent magnetic susceptibilities of the three complexes were measured in the range 2–300 K in an external magnetic field of 1000 Oe, and their magnetic behaviors are shown in Fig. 7. For 1, the χmT value is 12.53 cm3 mol−1 K at 300 K, which is slightly higher than the expected value of 11.82 cm3 mol−1 K for an isolated Tb3+ ion (7F6, S = 3, L = 3/2, g = 3/2). The similar situations have also been reported in the mononuclear Tb3+ complexes.21,60 When decreasing the temperature, the χmT product gradually decreases until 100 K and then decreases rapidly to 8.11 cm3 mol−1 K at 2 K (Fig. 7a). In the case of complex 2 shown in Fig. 7b, the χmT value at room temperature is 12.89 cm3 mol−1 K, which is slightly lower than the expected value (14.17 cm3 mol−1 K) for one isolated Dy3+ ion (6H15/2, S = 5/2, L = 5, g = 4/3). As the temperature decreases, the χmT value decreases gradually to 12.50 cm3 mol−1 K at 100 K, then it decreases rapidly to 10.43 cm3 mol−1 K at 2 K. For complex 3, the room temperature χmT value is 13.76 cm3 mol−1 K, which is close to the theoretical value of 14.07 cm3 mol−1 K for Ho3+ ion (5I8, S = 2, L = 6, g = 5/4). Upon cooling, the value increases gradually to reach a maximum of 14.20 cm3 mol−1 K at 157 K, and then decreases to 8.55 cm3 mol−1 K at 2 K (Fig. 7c). These behaviors are ascribed to the depopulation of the low lying states (mJ states) arising from the 7F6 (Tb3+), 6H15/2 (Dy3+) and 5I8 (Ho3+), and ground states split through the action of the crystal field (for these ions, the ground state is well below the first excited J state).61 Using the free-ion approach and the isotropic (z) component of the susceptibility, the value of the zero-field splitting (ZFS), Δ, was evaluated for each ion using the expressions in Scheme S1 in the ESI,† leading to Δ = 0.46(4) cm−1 and g = 1.58(1); Δ = 0.22(1) cm−1 and g = 1.35(2) and Δ = 0.28(1) cm−1 and g = 1.30(1) for Tb, Dy and Ho, respectively.61,62 These values are in the range of those reported in the literatures.61,62 | ||
| Fig. 7 Temperature dependence of χmT and χmversus T of 1–3. The solid red lines represent the fits obtained with equations in Scheme S1.† | ||
The molar magnetizations at 2 K for 1–3 do not get saturated in fields as high as 80 kOe, but rather, rise rapidly at low fields and then increase gently to 2.30, 2.52 and 2.46 Nβ at 80 kOe (Fig. 7, inset), which are much lower than theoretical value of 9 Nβ for 1 (one free Tb3+ ion), 10 Nβ for 2 and 3 (one free Dy3+ or Ho3+ ion);63 such behavior can be attributed to the ligand-field-induced splitting of the Stark level, as well as magnetic anisotropy with a lower effective spin.64
Moreover, alternating current (ac) susceptibility measurements for 1 were performed under a zero direct current field with a 3.0 Oe alternating current field to examine the dynamic spin behavior (Fig. S5†). No obvious  and
and  signal are observed at frequencies from 10 to 1311 Hz at temperatures ranging from 2 to 22 K, which can be attributed to the fast quantum tunneling effect for the complex;65 therefore, there is no slow relaxation of the magnetization for the complex.66
4. Conclusions
In conclusion, three chiral coordination polymers featuring 1D spiral chain structures were prepared by Ln3+ ions (Ln = Tb, Dy and Ho) and (+)-di-p-toluoyl-D-tartaric acid (d-H2DTTA). Ditoluoyl-tartrate displays cis-conformation, and acts as a 1,4-dicarboxylate linker in the complexes. The benzoylation of 2- and 3-hydroxyl groups can hinder the coordination of hydroxyl and avoid forming of complicated entangled structures. The single crystal structures and the CD spectra confirm the chirality of the complexes. Photoluminescence spectra reveal that HDTTA− anions are able to sensitize the luminescence of Tb3+ and Dy3+ ions in complexes 1 and 2, respectively. Moreover, complexes 1–3 exhibit magnetic properties that are characteristic for the considered lanthanide ions, which are dominated by the spin–orbit coupling and the ligand field perturbation with an almost negligible contribution of the exchange spin coupling between the lanthanide atoms, corresponding to the long Ln⋯Ln distances. The structures and properties of these coordination networks indicate that they may be good potential candidates for chiral, luminescent and magnetic multifunctional materials.Conflicts of interest
There are no conflicts to declare.Acknowledgements
We acknowledge Wei Cao (Shanxi University) and Zeng-Qiang Gao (BSRF) for the help of single crystal X-ray diffraction data collection and reduction. This work was supported by the Natural Science Foundation of China [Grant No. 21571118 & 21671124]; the Natural Science Foundation of Shanxi Province [201701D121039]; the Fund for Shanxi “1331 Project” Key Innovative Research Team (1331KIRT); and the Undergraduate Research Training Plan Project of Shanxi University. A portion of this work was performed on the Scientific Instrument Center of Shanxi University of China.Notes and references
- K.-M. Wang, L. Du, Y.-L. Ma, J.-S. Zhao, Q. Wang, T. Yan and Q.-H. Zhao, CrystEngComm, 2016, 18, 2690–2700 RSC.
- N. Wei, M.-Y. Zhang, X.-N. Zhang, G.-M. Li, X.-D. Zhang and Z.-B. Han, Cryst. Growth Des., 2014, 14, 3002–3009 CrossRef CAS.
- S. Biswas, H. S. Jena, S. Goswami, S. Sanda and S. Konar, Cryst. Growth Des., 2014, 14, 1287–1295 CrossRef CAS.
- X. Y. Xu, X. Lian, J. N. Hao, C. Zhang and B. Yan, Adv. Mater., 2017, 29, 1702298 CrossRef.
- L. Zhou, Z.-G. Wang, H.-Y. Dong, K. Zhao, Y.-J. Hu, Z.-J. Gao, S.-N. Tie and H.-G. Zheng, Inorg. Chem. Commun., 2017, 78, 1–4 CrossRef CAS.
- Y. Yang, K. Z. Wang and D. Yan, ACS Appl. Mater. Interfaces, 2017, 9, 17399–17407 CrossRef CAS.
- X. Yang, X. Lin, Y. Zhao, Y. S. Zhao and D. Yan, Angew. Chem., Int. Ed., 2017, 56, 7853–7857 CrossRef CAS.
- L.-N. Zheng, F.-H. Wei, H.-M. Hu, C. Bai, X.-L. Yang, X. Wang and G. Xue, Polyhedron, 2019, 161, 47–55 CrossRef CAS.
- J.-J. Yang, X.-Y. Yu, Y.-H. Luo, H. Zhang and W.-P. Gao, Inorg. Chem. Commun., 2015, 61, 16–20 CrossRef CAS.
- S. C. Chen, A. Q. Dai, K. L. Huang, Z. H. Zhang, A. J. Cui, M. Y. He and Q. Chen, Dalton Trans., 2016, 45, 3577–3589 RSC.
- I. Oyarzabal, B. Fernández, J. Cepeda, S. Gómez-Ruiz, A. J. Calahorro, J. M. Seco and A. Rodríguez-Diéguez, CrystEngComm, 2016, 18, 3055–3063 RSC.
- J. M. Seco, I. Oyarzabal, S. Perez-Yanez, J. Cepeda and A. Rodriguez-Dieguez, Inorg. Chem., 2016, 55, 11230–11248 CrossRef CAS.
- T. F. Jenkins, D. H. Woen, L. N. Mohanam, J. W. Ziller, F. Furche and W. J. Evans, Organometallics, 2018, 37, 3863–3873 CrossRef CAS.
- H. R. M. Silva, W. M. Faustino, E. E. S. Teotonio, H. F. Brito, O. L. Malta and M. C. F. C. Felinto, J. Lumin., 2019, 207, 182–187 CrossRef CAS.
- J.-F. Song, H.-F. Wen, J.-J. Luo, Y.-Y. Jia, X.-Y. Zhang, L.-J. Su and R.-S. Zhou, J. Solid State Chem., 2019, 269, 43–50 CrossRef CAS.
- K.-X. Shang, S. Jing, D.-C. Hu, X.-Q. Yao, L.-H. Zhi, C.-D. Si and J.-C. Liu, Cryst. Growth Des., 2018, 18, 2112–2120 CrossRef CAS.
- Y.-L. Ma, L. Du and Q.-H. Zhao, Inorg. Chem. Commun., 2017, 77, 1–5 CrossRef.
- J. Wu, H. Zhang and S. Du, J. Mater. Chem. C, 2016, 4, 3364–3374 RSC.
- J. Zhao, G. H. Zhu, L. Q. Xie, Y. S. Wu, H. L. Wu, A. J. Zhou, Z. Y. Wu, J. Wang, Y. C. Chen and M. L. Tong, Dalton Trans., 2015, 44, 14424–14435 RSC.
- N. Ahmed, C. Das, S. Vaidya, A. K. Srivastava, S. K. Langley, K. S. Murray and M. Shanmugam, Dalton Trans., 2014, 43, 17375–17384 RSC.
- Y.-Q. Jia, S.-S. Feng, M.-L. Shen and L.-P. Lu, CrystEngComm, 2016, 18, 5344–5352 RSC.
- L.-Y. Zhang, L.-P. Lu, M.-L. Zhu and S.-S. Feng, CrystEngComm, 2017, 19, 1953–1964 RSC.
- Y.-Y. An, L.-P. Lu, S.-S. Feng and M.-L. Zhu, CrystEngComm, 2018, 20, 2043–2052 RSC.
- C. Feng, J. W. Sun, P. F. Yan, Y. X. Li, T. Q. Liu, Q. Y. Sun and G. M. Li, Dalton Trans., 2015, 44, 4640–4647 RSC.
- J.-W. Sun, S.-J. Li, P.-F. Yan, X. Yao and G.-M. Li, CrystEngComm, 2016, 18, 3079–3085 RSC.
- T. J. Rutherford, P. A. Pellegrini, J. Aldrich-Wright, P. C. Junk and F. R. Keene, Eur. J. Inorg. Chem., 1998, 1677–1688 CrossRef CAS.
- K. Bernauer, F. Gretillat, H. Stoeckli-Evans and R. Warmuth, Helv. Chim. Acta, 1993, 76, 545 CrossRef CAS.
- A. Sellmer, H. Stangl, M. Beyer, E. Grunstein, M. Leonhardt, H. Pongratz, E. Eichhorn, S. Elz, B. Striegl, Z. Jenei-Lanzl, S. Dove, R. H. Straub, O. H. Kramer and S. Mahboobi, J. Med. Chem., 2018, 61, 3454–3477 CrossRef CAS.
- A. C. Smith, S. Cabral, D. W. Kung, C. R. Rose, J. A. Southers, C. N. Garcia-Irizarry, D. B. Damon, S. W. Bagley and D. A. Griffith, J. Org. Chem., 2016, 81, 3509–3519 CrossRef CAS.
- Z. S. Han, W. Shi and P. Cheng, Chin. Chem. Lett., 2018, 29, 819–822 CrossRef CAS.
- P. Bagi, K. Karaghiosoff, M. Czugler, D. Hessz, M. Kállay, M. Kubinyi, T. Szilvási, P. Pongrácz, L. Kollár, I. Timári, K. E. Kövér, L. Drahos, E. Fogassy and G. Keglevich, Heteroat. Chem., 2016, 27, 91–101 CrossRef CAS.
- W.-Y. Niu, C. Feng, N.-y. Fan, X.-Y. Wang, P.-F. Yan, J.-W. Sun and G.-M. Li, Synth. Met., 2016, 221, 319–325 CrossRef CAS.
- W. Y. Niu, P. F. Yan, Y. X. Li, G. H. An and G. M. Li, Sci. Adv. Mater., 2016, 8, 2189–2196 CrossRef CAS.
- W. Y. Niu, J. W. Sun, P. F. Yan, Y. X. Li, G. H. An and G. M. Li, Chemistry, 2016, 11, 555–560 CAS.
- B. Casanovas, S. Speed, M. S. El Fallah, R. Vicente, M. Font-Bardia, F. Zinna and L. Di Bari, Dalton Trans., 2019, 48, 2059–2067 RSC.
- Z. Otwinowski and W. Minor, Methods Enzymol., 1997, 276, 307–326 CAS.
- G. M. Sheldrick, Acta Crystallogr., Sect. A: Found. Crystallogr., 2008, 64, 112–122 CrossRef CAS.
- G. M. Sheldrick, Acta Crystallogr., Sect. C: Struct. Chem., 2015, 71, 3–8 Search PubMed.
- Y.-F. Liu, G.-F. Hou, Y.-H. Yu, P.-F. Yan, J.-Y. Li, G.-M. Li and J.-S. Gao, Cryst. Growth Des., 2013, 13, 3816–3824 CrossRef CAS.
- N. Zhao, F. Sun, H. He, J. Jia and G. Zhu, Cryst. Growth Des., 2014, 14, 1738–1743 CrossRef CAS.
- F. Su, L. Lu, S. Feng and M. Zhu, CrystEngComm, 2014, 16, 7990–7999 RSC.
- X.-L. Ma, Z.-X. Wang, X. He, M. Shao and M.-X. Li, Inorg. Chem. Commun., 2018, 92, 131–135 CrossRef CAS.
- L. Li, S. Wang, T. Chen, Z. Sun, J. Luo and M. Hong, Cryst. Growth Des., 2012, 12, 4109–4115 CrossRef CAS.
- M.-J. Zhou, B. Li, L. Liu, Y.-L. Feng and J.-Z. Guo, CrystEngComm, 2014, 16, 10034–10039 RSC.
- Y. X. Li, S. J. Li, P. F. Yan, X. Y. Wang, X. Yao, G. H. An and G. M. Li, Chem. Commun., 2017, 53, 5067–5070 RSC.
- J. Q. He, S. F. Xie, B. L. Lai, M. Yang, W. B. Chen, Y. Q. Zhang and W. Dong, Dalton Trans., 2018, 47, 14975–14984 RSC.
- P. Kalita, J. Goura, J. Manuel Herrera Martínez, E. Colacio and V. Chandrasekhar, Eur. J. Inorg. Chem., 2019, 212–220 CrossRef CAS.
- R. G. Gámez-Heredia, A. Cruz-Enríquez, R. Aceves, H. Höpfl, M. Parra-Hake, R. E. Navarro and J. J. Campos-Gaxiola, Inorg. Chim. Acta, 2019, 486, 377–386 CrossRef.
- X. Fang, T. M. Anderson and C. L. Hill, Angew. Chem., Int. Ed., 2005, 44, 3540–3544 CrossRef CAS.
- J. Gawroński and J. Grajewski, Org. Lett., 2003, 5, 3301–3303 CrossRef PubMed.
- M. Pan, B. B. Du, Y. X. Zhu, M. Q. Yue, Z. W. Wei and C. Y. Su, Chem.–Eur. J., 2016, 22, 2440–2451 CrossRef CAS.
- Y. Zhang, K. Wang, G. Zhuang, Z. Xie, C. Zhang, F. Cao, G. Pan, H. Chen, B. Zou and Y. Ma, Chem.–Eur. J., 2015, 21, 2474–2479 CrossRef CAS.
- S. Shuvaev, V. Utochnikova, L. Marciniak, A. Freidzon, I. Sinev, R. Van Deun, R. O. Freire, Y. Zubavichus, W. Grunert and N. Kuzmina, Dalton Trans., 2014, 43, 3121–3136 RSC.
- X. Q. Zhao, P. Cui, B. Zhao, W. Shi and P. Cheng, Dalton Trans., 2011, 40, 805–819 RSC.
- C. Tedeschi, J. Azema, H. Gornitzka, P. Tisnes and C. Picard, Dalton Trans., 2003, 1738–1745 RSC.
- Y. Xiao, S.-H. Wang, F.-K. Zheng, M.-F. Wu, J. Xu, Z.-F. Liu, J. Chen, R. Li and G.-C. Guo, CrystEngComm, 2016, 18, 721–727 RSC.
- Q. Y. Yang, K. Wu, J. J. Jiang, C. W. Hsu, M. Pan, J. M. Lehn and C. Y. Su, Chem. Commun., 2014, 50, 7702–7704 RSC.
- Y. Liu, M. Pan, Q.-Y. Yang, L. Fu, K. Li, S.-C. We and C.-Y. Su, Chem. Mater., 2012, 24, 1954–1960 CrossRef CAS; M. Pan, W. M. Liao, S. Y. Yin, S. S. Sun and C. Y. Su, Chem. Rev., 2018, 118, 8889–8935 CrossRef.
- M. Pan, W. M. Liao, S. Y. Yin, S. S. Sun and C. Y. Su, Chem. Rev., 2018, 118, 8889–8935 CrossRef CAS.
- W. Zhou, X. Feng, H. Ke, Y. Li, J. Tang and E. Wang, Inorg. Chim. Acta, 2013, 394, 770–775 CrossRef CAS.
- P. Farger, C. Leuvrey, M. Gallart, P. Gilliot, G. Rogez, J. Rocha, D. Ananias, P. Rabu and E. Delahaye, Beilstein J. Nanotechnol., 2018, 9, 2775–2787 CrossRef CAS.
- J. Cepeda, R. Balda, G. Beobide, O. Castillo, J. Fernandez, A. Luque, S. Perez-Yanez and P. Roman, Inorg. Chem., 2012, 51, 7875–7888 CrossRef CAS.
- J. L. Liu, Y. C. Chen and M. L. Tong, Chem. Soc. Rev., 2018, 47, 2431–2453 RSC.
- J. Tang, I. Hewitt, N. T. Madhu, G. Chastanet, W. Wernsdorfer, C. E. Anson, C. Benelli, R. Sessoli and A. K. Powell, Angew. Chem., Int. Ed., 2006, 45, 1729–1733 CrossRef CAS.
- S. P. Bera, A. Mondal, S. Roy, B. Dey, A. Santra and S. Konar, Dalton Trans., 2018, 47, 15405–15415 RSC.
- J. Wang, M. Zhu, C. Li, J. Zhang and L. Li, Eur. J. Inorg. Chem., 2015, 1368–1375 CrossRef CAS.
Footnotes |
| † Electronic supplementary information (ESI) available. CCDC X-ray crystallographic data for compounds 1–3 in CIF format (CCDC 1940269, 1939982 and 1939983), selected bond lengths and bond angles, the figures of IR spectra, PXRD patterns, TGA plots, and molar magnetization figures are presented. For ESI and crystallographic data in CIF or other electronic format see DOI: 10.1039/c9ra06920h |
| ‡ These authors contribute equally to this work. |
| This journal is © The Royal Society of Chemistry 2019 |


