
 Open Access Article
 This Open Access Article is licensed under a Creative Commons Attribution-Non Commercial 3.0 Unported Licence
Mechanisms of pattern and colour generation of Chinese Tianmu glaze
Xiaotao Shi,
Yougen Yu,
Qian Sun,
Weiya Zhu,
Cheng Peng and
Jianqing Wu *
*
School of Material Science and Engineering, South China University of Technology, Guangzhou 510640, China. E-mail: ceramicgroup@163.com
First published on 17th December 2019
Abstract
Tianmu glaze wares are a very famous form of ancient Chinese porcelain. The samples were prepared with local raw materials and traditional technology. X-ray diffraction, scanning electron microscopy, optical microscopy and energy dispersive spectroscopy were used to analyse the phase composition, microstructure and chemical composition of the Tianmu glaze. The results show that the patterns were created by the process that includes phase separation, the iron-rich phase moving to the surface, the growth of nanosized magnetite and hematite crystals, the aggregation of a thin crystal layer, and the appearance and collapse of bubbles. Scattering, diffraction and interference of nanosized grains are the primary colour rendering mechanism.
1. Introduction
Tianmu glaze wares, which are called Jian ware or Jianzhan, are produced in Jianyang, Fujian Province, China; these wares were popular during the Song Dynasty (approximately A.D. 960–1279). Tianmu glaze wares have a variety of colourful patterns on their surfaces such as ‘hare's fur’ and ‘oil spot’, because of their unique formulas and firing processes. Many experts have studied phase-separated crystalline glazes such as Tianmu glaze.1–9 In this paper, the microstructures of oil spot Tianmu glaze were studied, and the formation mechanism of oil spot speckles was probed into. Zhou et al.1 investigated a commercial Tianmu glaze bowl and a sample that they prepared. They determined that there was a crystal layer with a thickness of one to a few hundred nanometres on the Tianmu glaze surface that was composed of pseudo-cubic spinel dendrite crystals. The light interference, which resulted from the crystal layer governed the colour appearance of the glaze. Catherine Dejoie et al.2 found that the surface patterns of an ancient oil spot Tianmu wares were exclusively made of ε-Fe2O3 crystals up to several micrometers in size and were organized in a periodic two-dimensional fashion. They believed that the surface colour and patterns are linked to the crystallization of iron oxides. Shi et al.10–13 explained the effect of Ca2+ and P5+ ions on the phase separation in Jun ware glaze containing iron oxide. They speculated that glaze colour is a structural colour that is caused by amorphous photon crystals and a chemical colour from Cu ions. In this study, we prepared samples from local raw materials using traditional technology in Jianyang, where Tianmu glaze originated. The crystal phase and microstructure of the products were analysed by X-ray diffraction, optical microscopy, energy dispersive spectroscopy and field emission electron microscopy. On the basis of the abovementioned results, the pattern and colour formation mechanisms of Tianmu glaze were proposed.2. Experimental procedure
2.1 Raw materials
The raw materials for the glaze include Jianyang glaze stone, feldspar, quartz, calcite, calcined bovine ashes, talc and other mineral raw materials. The chemical composition is shown in Table 1. The chemical raw material Fe2O3 is a colouring agent, and its purity is ≥98%.| SiO2 | Al2O3 | P2O5 | Fe2O3 | CaO | MgO | K2O | Na2O | I.L | |
|---|---|---|---|---|---|---|---|---|---|
| Feldspar | 64.65 | 20.05 | — | 0.08 | 0.41 | 0.27 | 11.08 | 2.80 | 0.44 |
| Quartz | 97.40 | 0.88 | — | 0.09 | 0.29 | 0.23 | 0.18 | 0.46 | 0.27 |
| Calcite | 0.25 | 0.15 | — | 0.04 | 55.39 | 0.10 | — | 0.21 | 43.81 |
| Ashes | 0.40 | 0.13 | 46.49 | — | 51.90 | — | 0.24 | 0.18 | 0.66 |
| Talc | 62.06 | — | — | 0.64 | 0.81 | 32.23 | 0.04 | 0.07 | 4.14 |
| Jianyang glazed stone | 63.76 | 14.54 | 0.04 | 5.03 | 1.19 | 2.04 | 4.90 | 1.14 | 7.36 |
| Iron oxide | ≥98 |
The green body was composed of Jianyang local iron-containing and local high-alumina clays. The chemical compositions of glaze and green body are shown in Table 2.
| SiO2 | Al2O3 | P2O5 | Fe2O3 | CaO | MgO | K2O | Na2O | I.L | |
|---|---|---|---|---|---|---|---|---|---|
| Glaze | 47.69 | 11.18 | 0.74 | 7.17 | 8.25 | 3.64 | 4.02 | 0.89 | 16.42 |
| Body | 61.48 | 20.07 | 0.15 | 5.25 | 0.10 | 0.29 | 2.44 | — | 10.22 |
2.2 Glaze slurry preparation
The glaze raw materials were batched and loaded into a planetary mill jar. The weight ratio of raw materials![[thin space (1/6-em)]](https://www.rsc.org/images/entities/char_2009.gif) :ball:water was 1:2:0.8 and the milling time was 30 min. The fineness of the glaze was controlled by the sieve residue to less than 0.3% after a 150 mesh screening. The glaze consistency was adjusted by adding water, and the water content of the glaze was controlled to be approximately 50%.
:ball:water was 1:2:0.8 and the milling time was 30 min. The fineness of the glaze was controlled by the sieve residue to less than 0.3% after a 150 mesh screening. The glaze consistency was adjusted by adding water, and the water content of the glaze was controlled to be approximately 50%.
2.3 Firing process
The glaze slurry was coated on the green bodies by the immersion method. After drying, the wares were fired in an electric furnace with a round hole for adding small pine fragments. The firing temperature was raised from room temperature to 1370 °C in 7 hours under oxidizing atmosphere and maintained for one and a half hours at the highest firing temperature. Then, pine wood fragments were added through the round hole, and the wares were soaked in a heavy reducing atmosphere for another 1 hour after the hole was sealed. During the natural cooling process, the temperature was decreased from 1370 °C to 1150 °C, and a weak reducing atmosphere was maintained by adding a small amount of pine wood into the furnace. Below 1150 °C, the atmosphere was changed to oxidizing.2.4 Measurements
The crystal phases were determined by X-ray diffraction analysis (PANalytical X'pert PRO, Almelo, Netherlands) using Cu Kα radiation (40 kV and 40 mA) in the range of 10° to 70°. The XRD pattern was recorded with a step of 0.0178°, and the duration of each step was 8 seconds. Secondary electron and backscattered electron images were observed by scanning electron microscopy (ZEISS Merlin and EVO 18, Oberkochen, German). An energy dispersive X-ray spectrometer (INCA Energy 300, Oxford instruments, High Wycombe, UK) attached to the SEM was used to obtain the chemical composition of different microscopic regions. The glaze was etched with a 1 vol% HF solution for 30 seconds before observation.14,153. Results and discussion
Fig. 1(a) shows the optical images of the Tianmu glaze ware. There are many colourful oil spots on the surface. Fig. 1(b)–(e) show the optical microscopy images acquired at different magnification times. Fig. 1(d) and (e) show the typical rainbow-like appearance inside and outside the oil spot area. The colour varies around salient points and forms clear interference fringes. This reminds us that the beautiful colour of Tianmu glaze is mainly obtained by thin film interference.1,16,17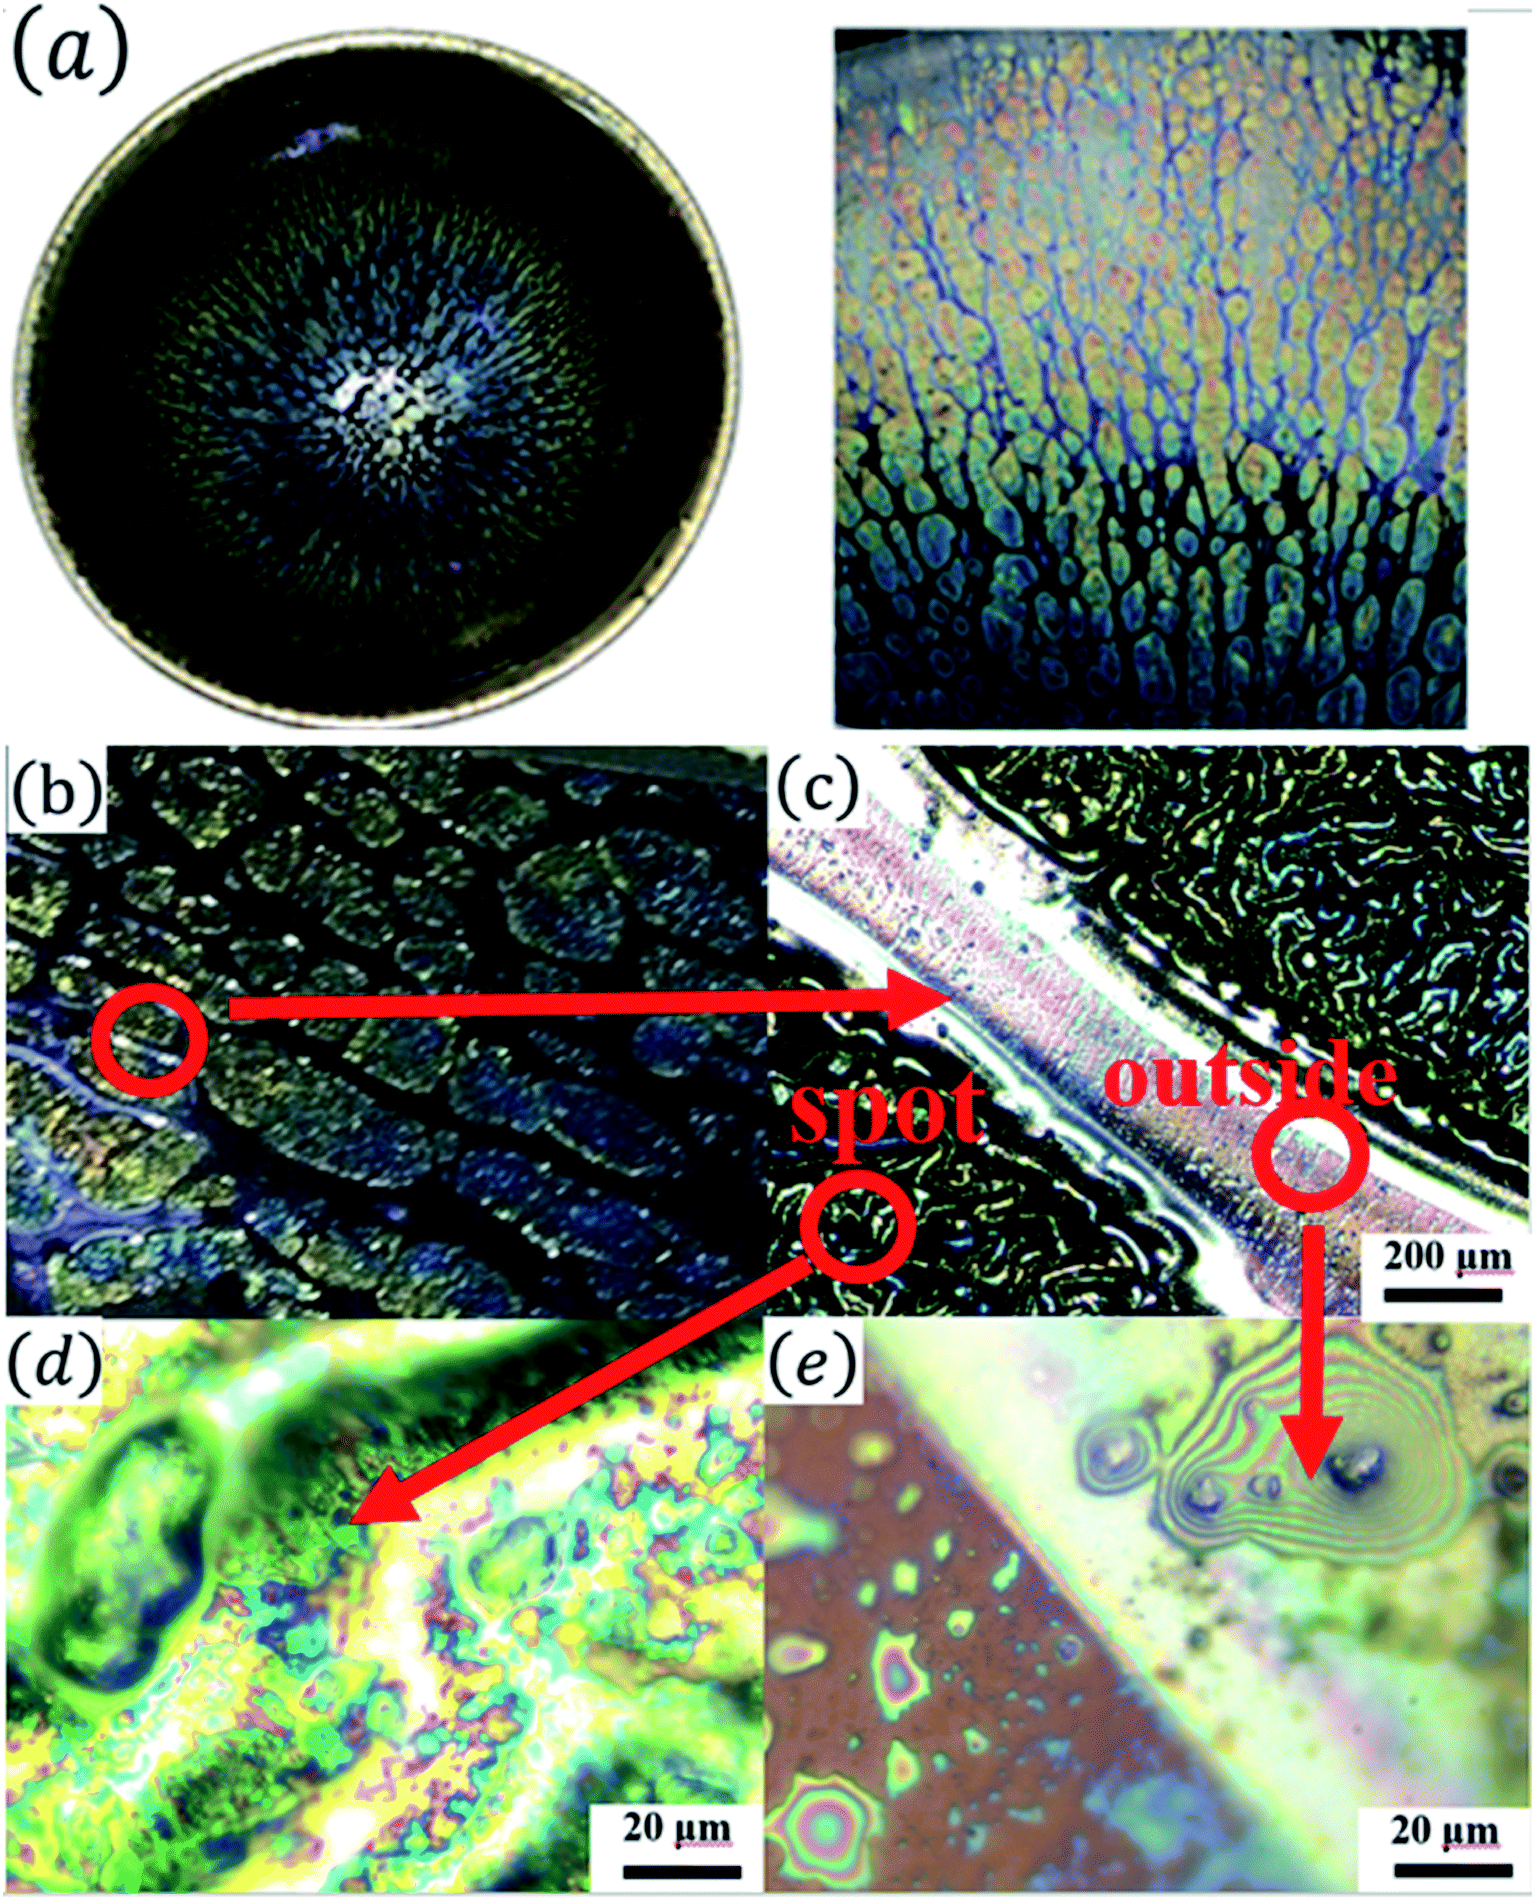 | ||
| Fig. 1 Optic microscopy images of the Tianmu glaze surface. (a) Tianmu glaze ware; (b) oil spot patterns; (c) oil spot patterns of the red circled area in (b); (d) in the oil spot; (e) outside the oil spots. | ||
Fig. 2 shows the optical and scanning electron microscopy images of the glaze. The glaze patterns are composed of oil spots with wrinkled surfaces, as shown in Fig. 2(b) and (d). On the surfaces of oil spots, clear hole markings are observed which were left behind when gas escaped from the bubbles (Fig. 2(d)). Further close-up observation of the red circled areas in Fig. 2(b) and (d) show that the surfaces are covered by nanosized particles (Fig. 2(c) and (e)). The particles on the blue spot (Fig. 2(e)) are significantly finer than those on the yellow spot (Fig. 2(c)). According to the principle of physical optics, when the particle size of phase separation crystallization is less than 100 nm, the colouring mechanism of ceramic glazes conforms to Rayleigh scattering. The scattering intensity is determined using the following formula.16,18
 | (1) |
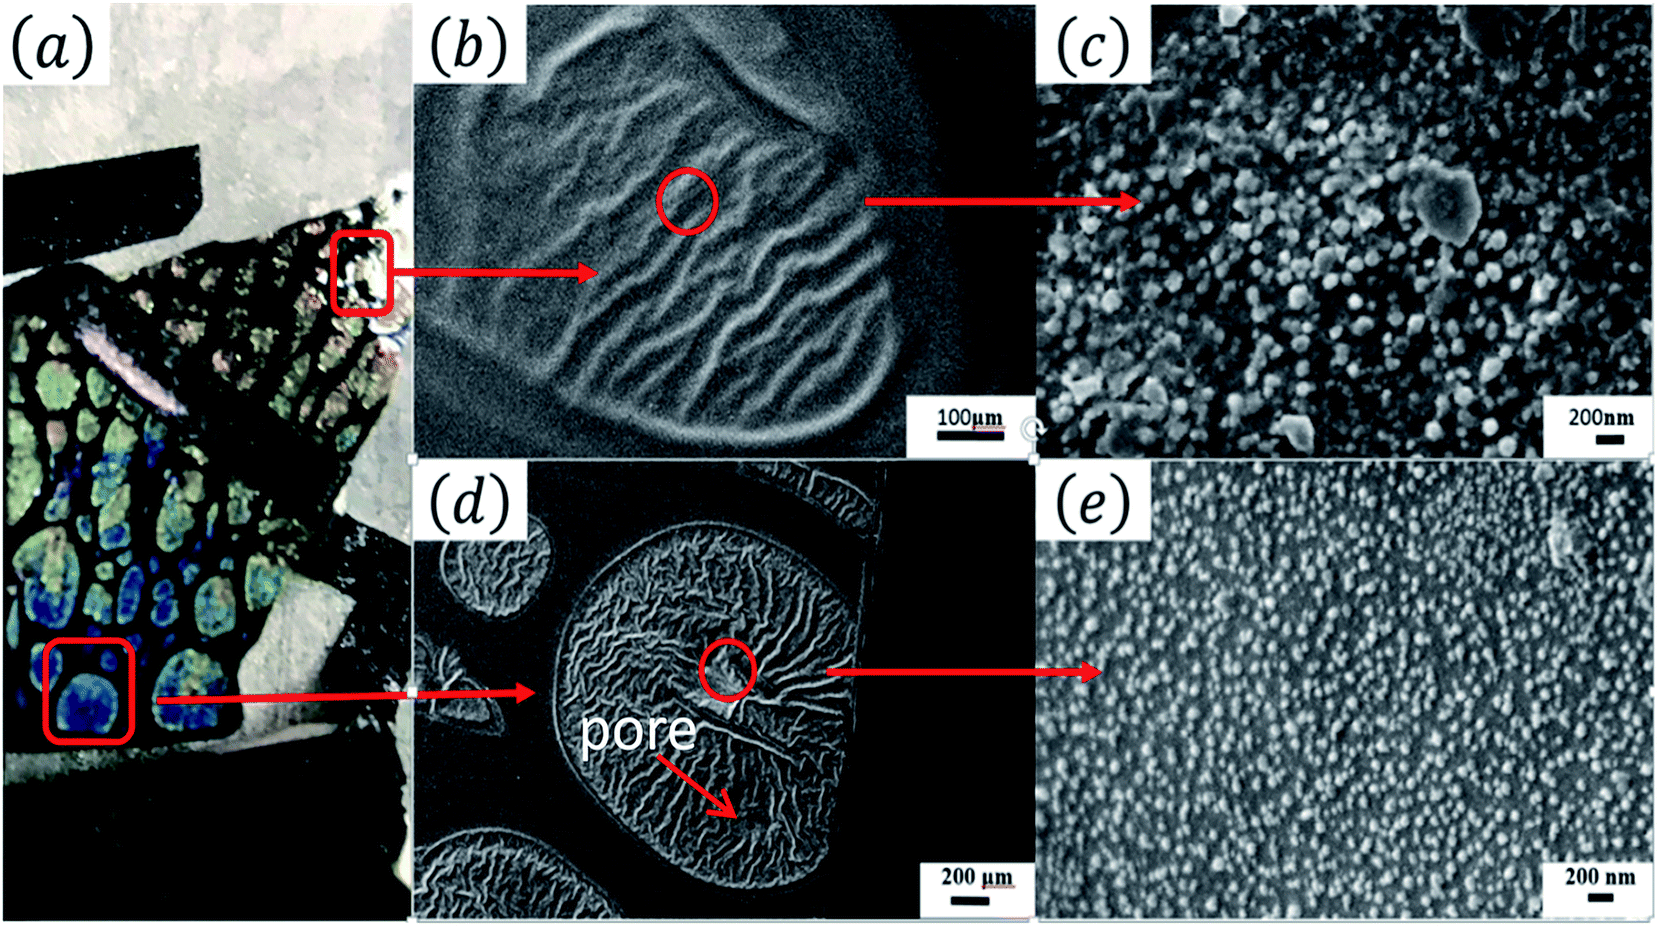 | ||
| Fig. 2 Optical and scanning electron microscopy images of the glaze. (a) Optic photograph; (b) SEM image of the yellow spot; (c) SEM image of the grains on the yellow spot; (d) SEM image of the blue spot; (e) SEM image of the grains on the blue spot. | ||
The XRD pattern (Fig. 3(b)) indicates that in the oil spot area the crystalline phases are mainly magnetite and hematite. This is consistent with the minerals of other ancient Jianye Tianmu glazes.19–21 Fig. 3(c)–(f) are the elemental mapping results. Clearly, Fe and Ca are concentrated in the oil spot areas, and Si and Al have higher contents outside the spot area. In general, modifiers (e.g., K2O, Na2O, CaO, and MgO) increase the O:Si ratio in the melt and destroy the bridging linkage of the silica network. The free energy of the glass system with high potential ions is high, and it is difficult to form a thermodynamically stable and uniform glass; thus phase separation spontaneously occurs. The potential of Ca2+ is 1.89, and it easily forms strong bonds with O2−, Therefore, Tianmu glaze with a high Ca content is prone to phase separation at high temperatures.
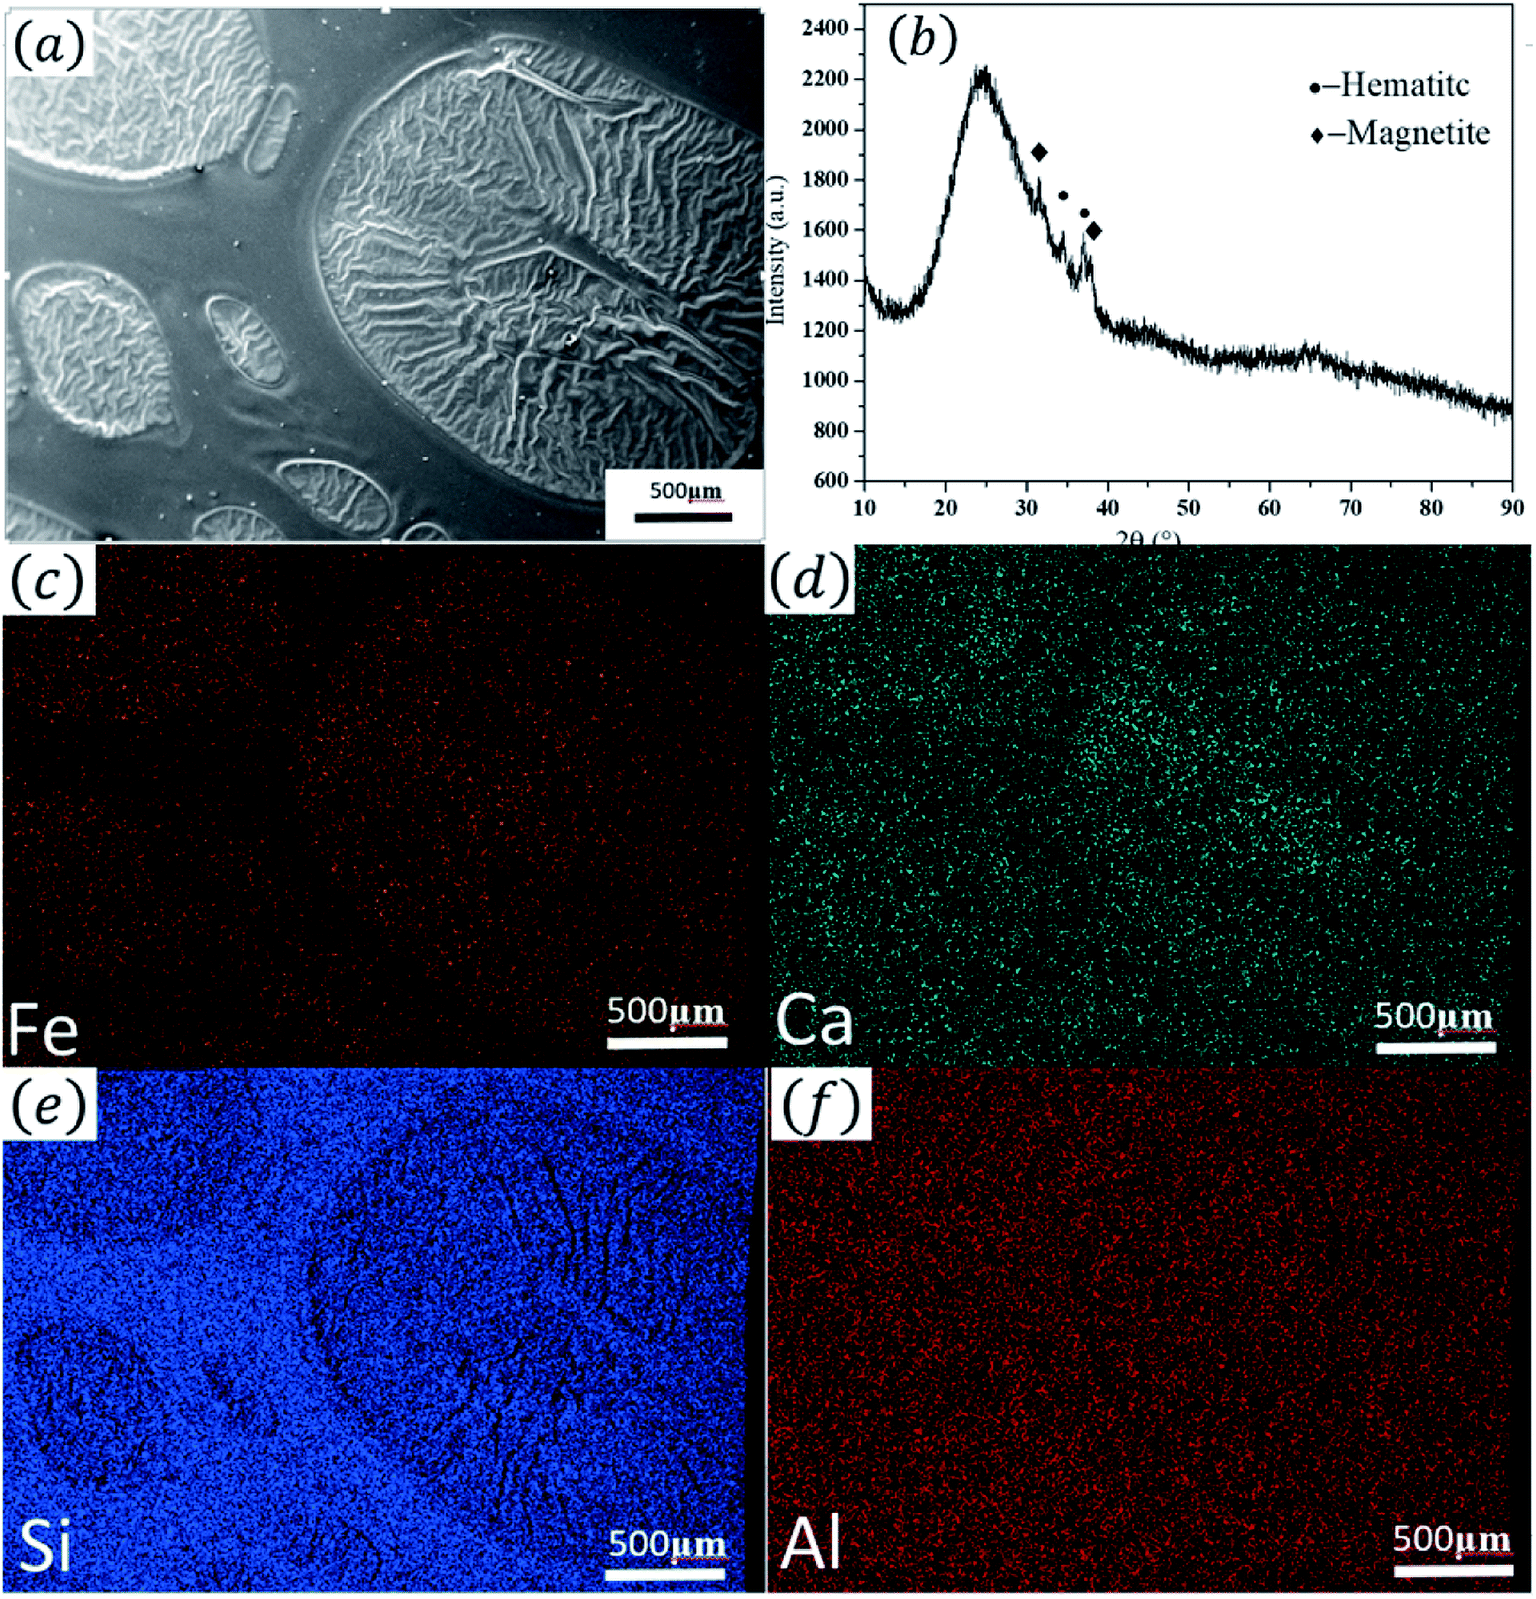 | ||
| Fig. 3 XRD pattern and the elemental mapping analysis. (a) SEM image of the area used for element mapping; (b) XRD pattern; (c–f) element distribution maps. | ||
The presence of spots with wrinkled and stomata surfaces is a good confirmation of the relationship between the iron-rich phase and the spots. In high-temperature melting glaze, Fe2O3 is reduced to FeO and release oxygen. Clearly, the iron-rich phase releases more oxygen and forms many bubbles in the phase that makes the phase ‘lighter’ than the iron-poor phase. The oxygen bubbles in the iron-rich phase brought the phase clusters to the glaze surface by the buoyancy force. During the process of bubbles reaching the surface, small bubbles in the iron-rich phase merged into large bubbles and emerged on the glaze surface. Then, the bubbles burst due to the oxygen pressure. Once the pressure exceeded the strength of the bubble wall, the bubble broke at the weakest point, and the gas escaped from the created hole. As the bubbles collapsed oil spots with wrinkled surface were formed. Bubble surface is a gas–liquid interface, which is an ideal place for crystal nucleation. As the bubble formed, iron oxide grains began to nucleate and grow on the bubble walls.
Fig. 4 shows the cross-sectional SEM micrographs of the Tianmu glaze. Fig. 4(b)–(d) are the successively enlarged SEM images of the red circled area in Fig. 4(a). Fig. 4(d) clearly shows that the grains reached the glaze surface and formed a thin film with a thickness of approximately 100 nm to 200 nm. The crystal grains in the spot region are mainly hematite (refractive index of 2.94–3.22) and magnetite (refractive index of 2.42), and the refractive indices of both crystals are higher than that of the glaze glass phase (1.5 to 1.8). Because the grain intensity in the thin film is much higher than that in the other areas, the film can be consider to have a relatively high equivalent refractive index. When visible light shines on the surface, the corresponding film interference colour is presented. Meanwhile, coherent diffraction and scattering occur in the grain region, and a reverse colour occurs on the upper and lower sides of the film. Thus, the glaze colour is a combination of film interference colour, coherent diffraction colour and small grain or particle scattering colour.
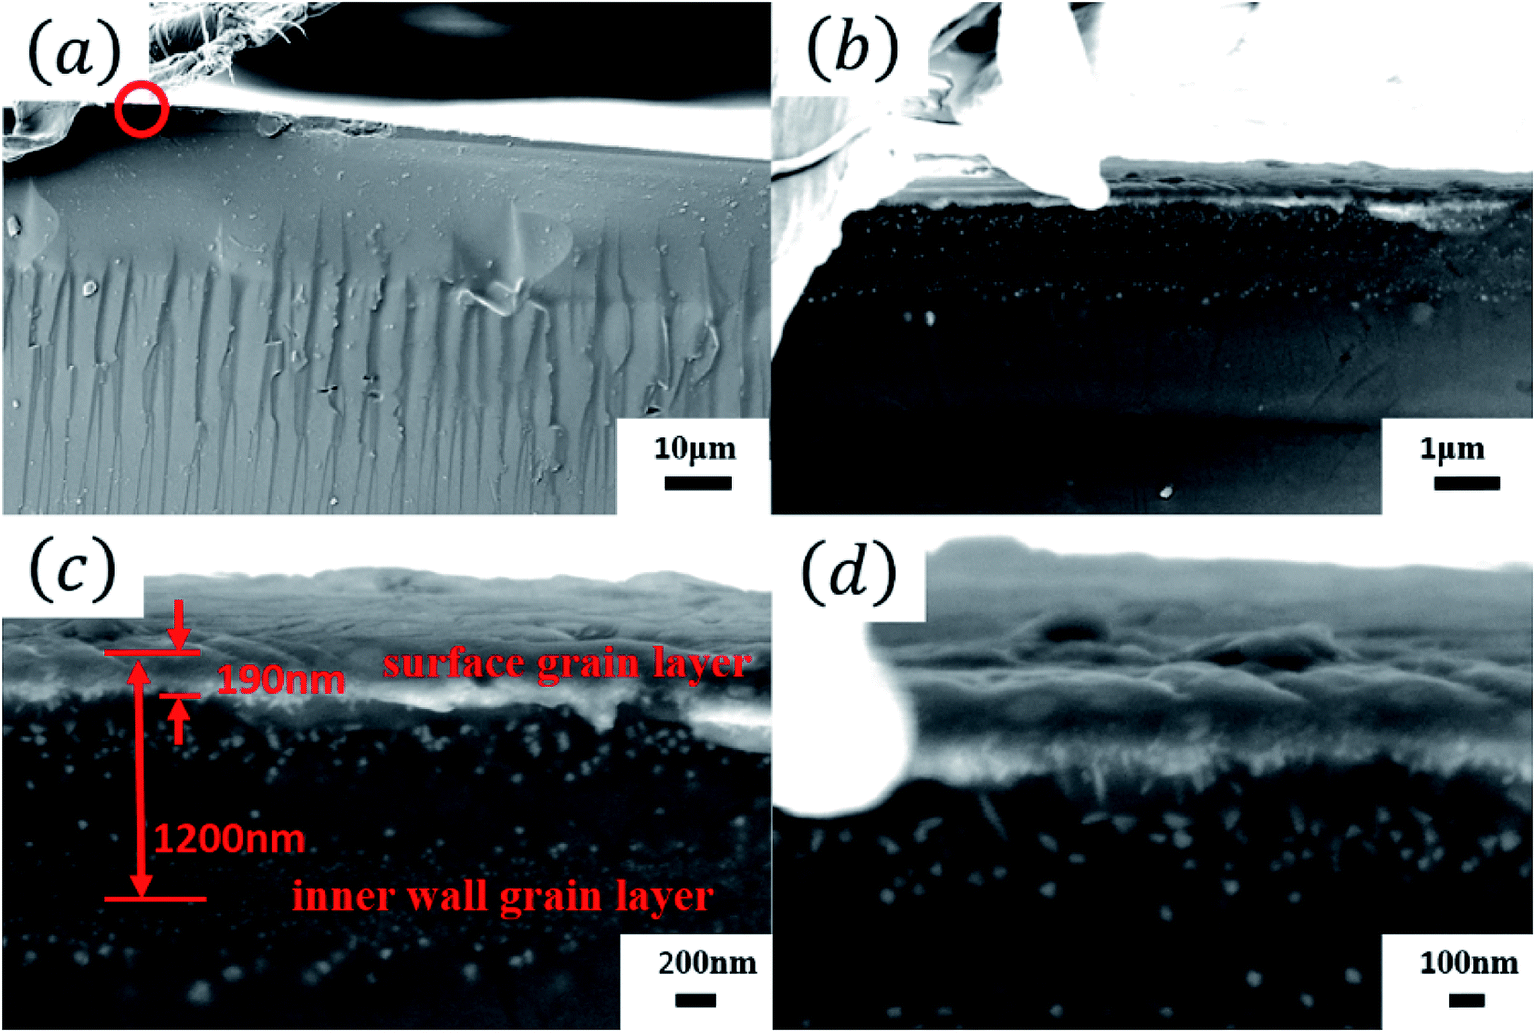 | ||
| Fig. 4 (a) Cross-sectional SEM images of the Tianmu glaze. (b–d) Successively enlarged SEM images of the red circled area in (a). | ||
Fig. 4(c) shows that below the surface grain layer, there is an inner wall grain layer. Because the layer is a combination of two inner walls of a collapsed bubble, the thickness of the bubble wall, which emerged from the glaze surface, is approximately 1290 nm, as shown in Fig. 4(c). Fig. 5 shows the EDS analysis results of the glaze cross section. From the inside to outside, the Fe content increases. This confirms that the iron-rich phase moved towards the glaze surface due to the buoyancy force, and the iron content in the outer layer was higher than that in the inner layer.
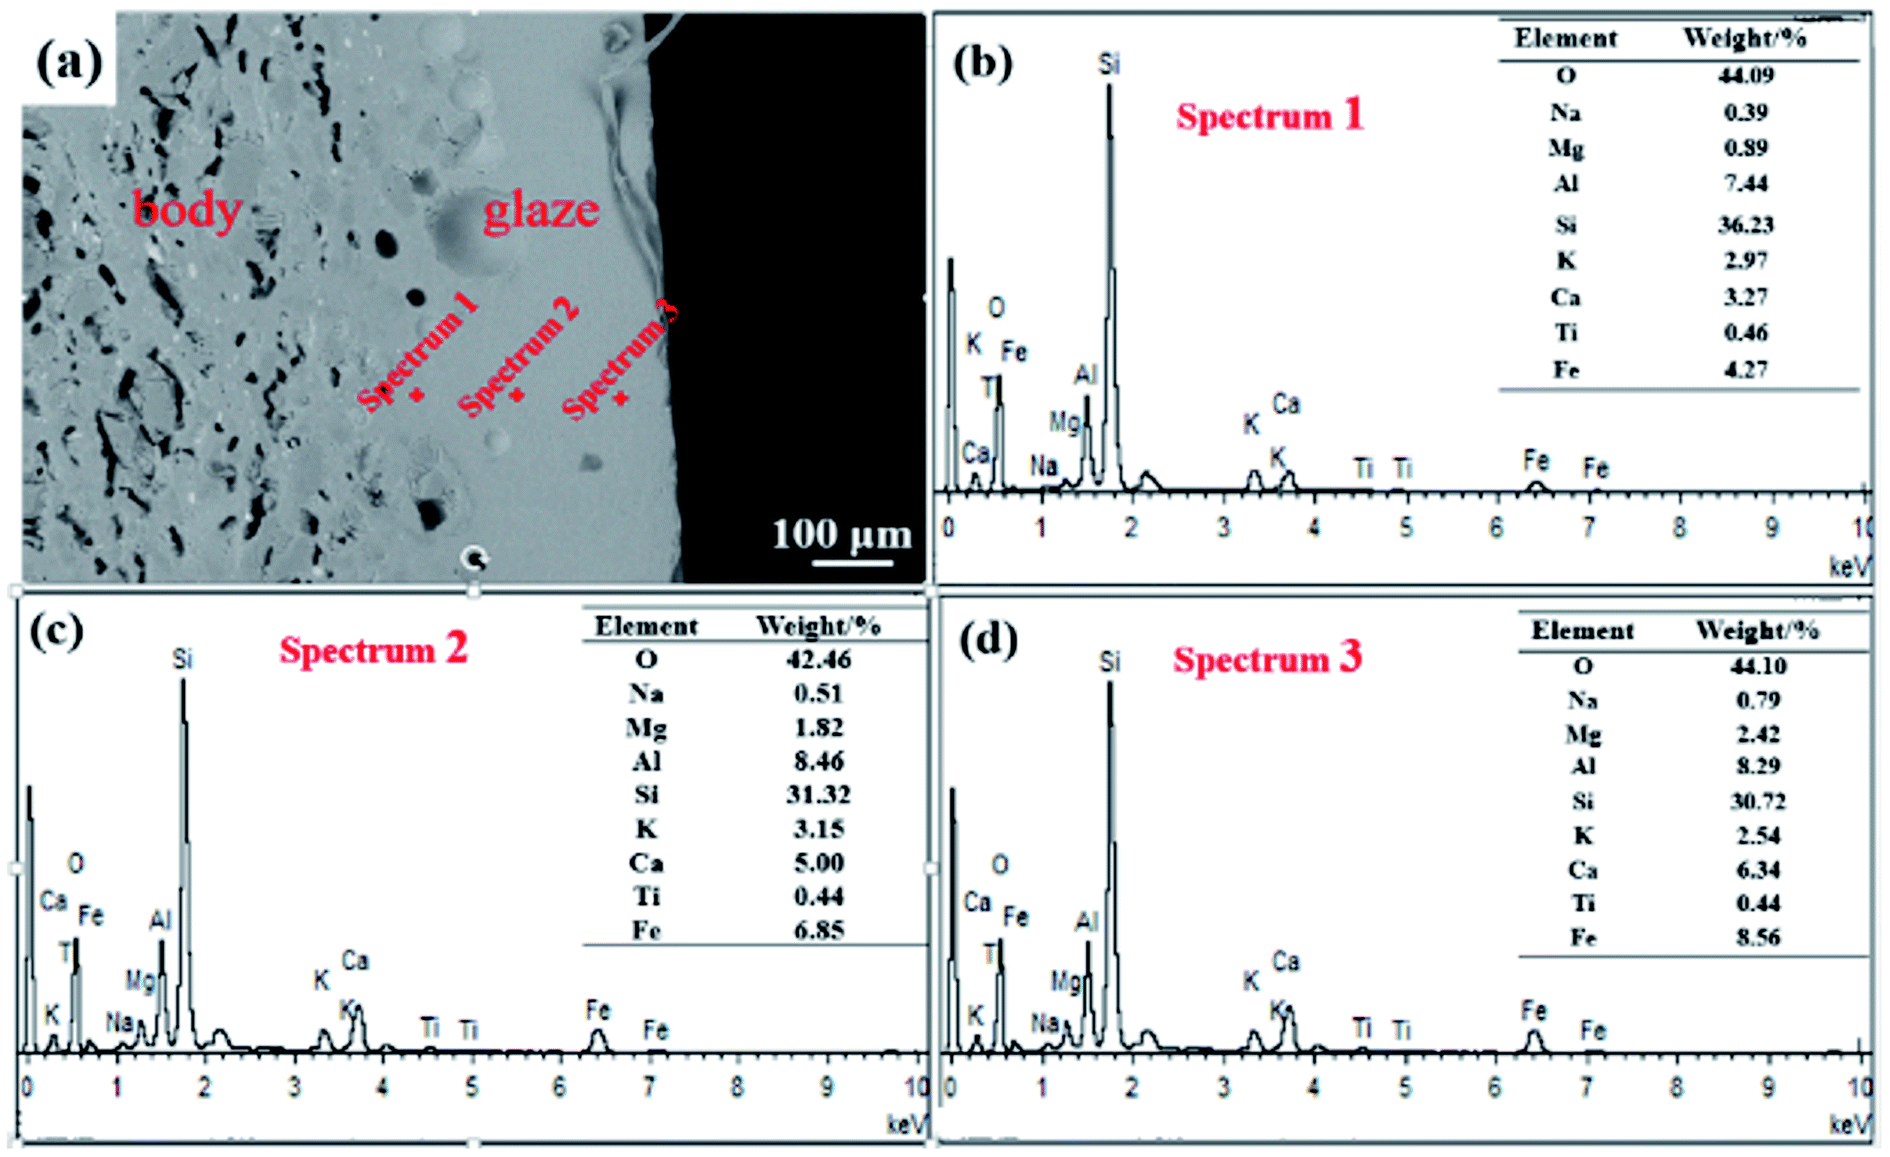 | ||
| Fig. 5 EDS analysis of the glaze cross section. | ||
Fig. 6 is a schematic diagram of the crystal layer formation on the surface of the Tianmu glaze. The above mentioned figure shows the evolution of spots and colours of oil spot Tianmu glaze. (1) At high temperature, phase separation occurs, part of Fe2O3 is reduced to FeO, and oxygen is released. (2) The Fe-rich phase release more oxygen and makes the phase ‘lighter’ than the Fe-poor phase; the buoyant force causes the bubbles in the Fe-rich phase to float up. Crystalline nuclei formed on the inner wall of the bubbles. (3) Small and medium bubbles merged into large bubbles, and the grains grew on the inner walls. (4) Bubbles emerged out of the glaze surface, and grains formed on both sides of the bubble wall. (5) Bubbles broke and collapsed, and oil spot speckles with wrinkled and dense nanosized grains surfaces were formed.
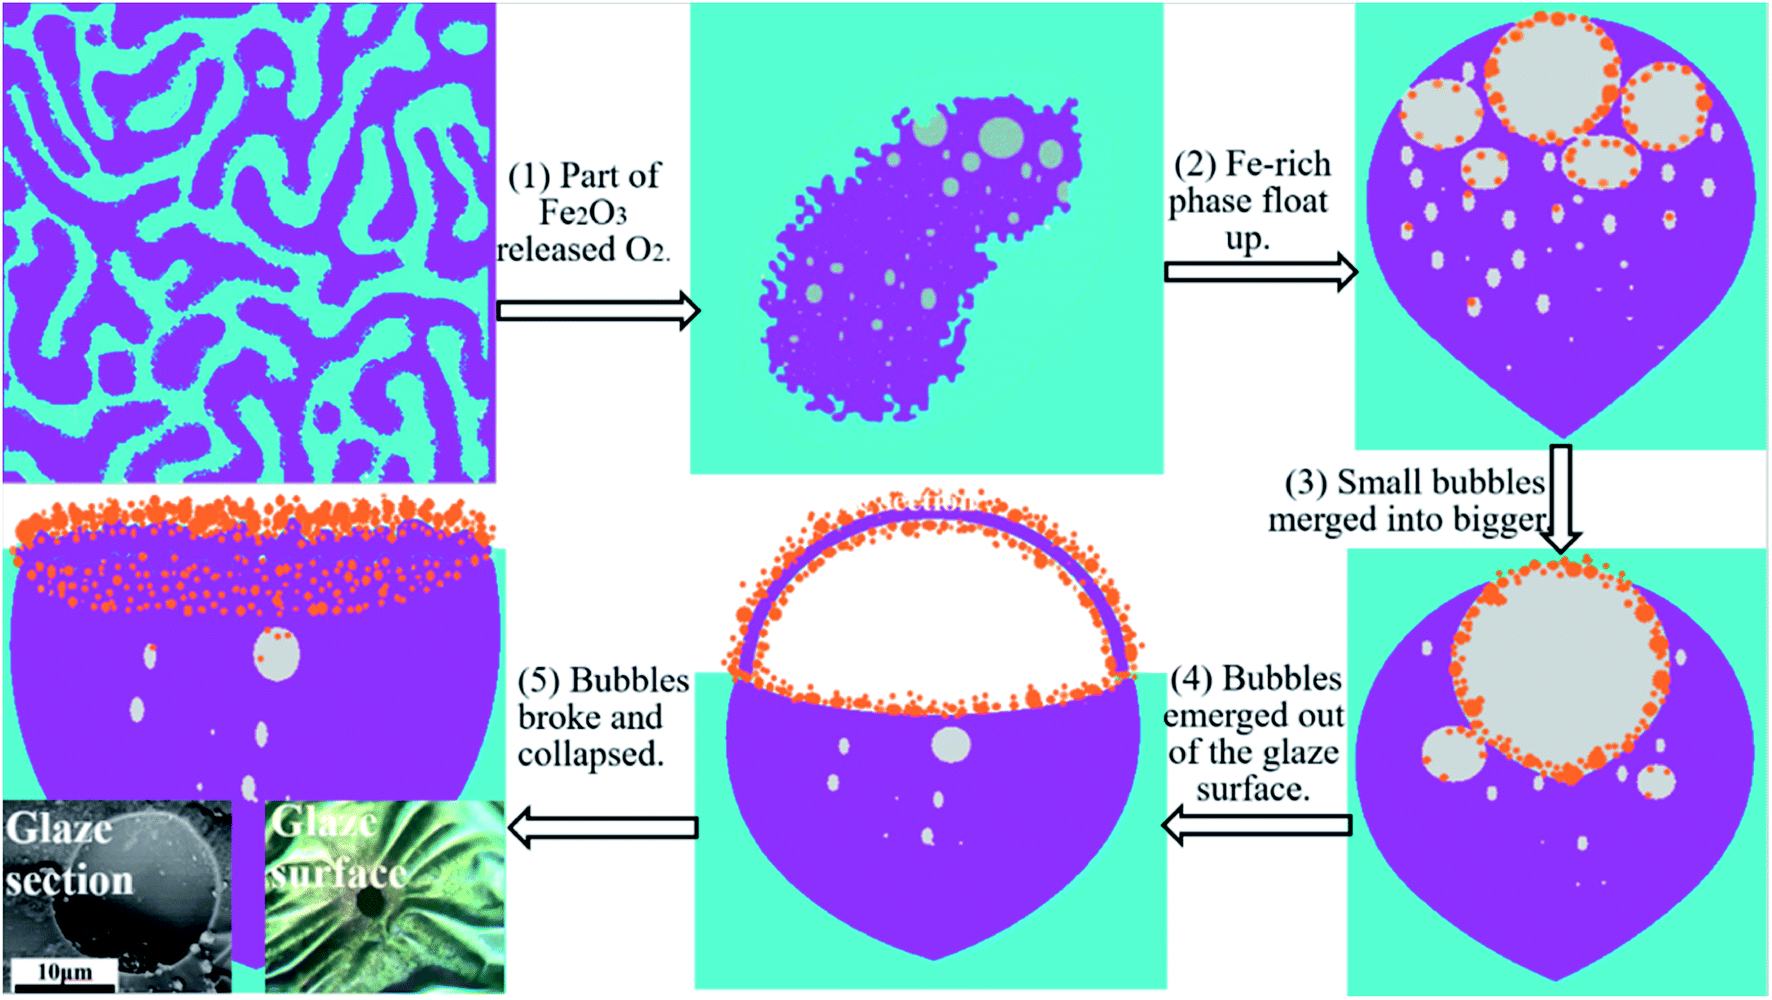 | ||
| Fig. 6 Schematic diagram of the crystal layer formation. | ||
4. Conclusion
The process and mechanism of the Tianmu glaze pattern and colour formation are described as follows. At high temperature the melting glaze was separated into iron-rich and iron-poor phases. The iron rich phase released more oxygen and formed bubbles, which made it ‘lighter’ than the iron-poor phase; thus, the iron rich phase moved to the glaze surface. The iron content in the glaze gradually increased from inside to outside. Hematite and magnetite grains preferentially grew on the bubble wall and finally formed an approximately 100 nm to 200 nm thick film. The thickness of the bubble wall on the glaze surface is approximately 1200 nm. In addition to being coloured by iron oxide, the Tianmu glaze colour is a combination of film interference colour, coherent diffraction colour and small grain or particle scattering colour.Conflicts of interest
There are no conflicts to declare.Acknowledgements
This work was financially supported by the National Natural Science Foundation of China (Grant No. 51472092) and the Major Science and Technology Project of Foshan City, Guangdong, China (Grant No. 2016AG101315).References
- C. Chiang, H. F. Greer, R. Liu and W. Zhou, Ceram. Int., 2016, 42, 7506–7513 CrossRef CAS.
- C. Dejoie, P. Sciau, W. Li, L. Noé, A. Mehta, K. Chen, H. Luo, M. Kunz, N. Tamura and Z. Liu, Sci. Rep., 2014, 4, 4941 CrossRef CAS.
- J. Hou, T. Pradell, Y. Li and J. Miao, J. Eur. Ceram. Soc., 2018, 38, 4290–4302 CrossRef CAS.
- J. Zhu, P. Shi, F. Wang and T. Zhao, J. Eur. Ceram. Soc., 2015, 35, 4603–4609 CrossRef CAS.
- W. Li, J. Li, Z. Deng, J. Wu and J. Guo, Ceram. Int., 2005, 31, 487–494 CrossRef CAS.
- R. F. Huang, X. Q. Chen and S. P. Chen, Chin. Ceram., 1988, 17–21 CAS.
- O. C. Pereira and A. M. Bernardin, J. Hazard. Mater., 2012, 233–234, 103–111 CrossRef CAS PubMed.
- K. Pekkan, H. Başkırkan and M. Çakı, Ceram. Int., 2018, 44, 4789–4794 CrossRef CAS.
- J. Wu, M. Zhang, T. Hou, Q. Li and J. Wu, Ceram. Int., 2015, 41, 6851–6857 CrossRef CAS.
- P. Shi, F. Wang, J. Zhu, B. Zhang, T. Zhao, Y. Wang and J. Wang, Ceram. Int., 2018, 44, 16407–16413 CrossRef CAS.
- P. Shi, F. Wang, J. Zhu, H. Yang, Y. Wang, Y. Fang, B. Zhang and J. Wang, J. Eur. Ceram. Soc., 2018, 38, 2228–2233 CrossRef CAS.
- B. Zhang, J. Zhu, P. Shi, F. Wang, J. Wang and Z. Ren, J. Eur. Ceram. Soc., 2019, 39, 1925–1931 CrossRef CAS.
- J. Zhu, P. Shi, F. Wang, T. Zhao and H. Jiang, Ceram. Int., 2016, 42, 5250–5257 CrossRef CAS.
- S. Wang, C. Peng, Z. Huang, J. Zhou, M. Lü and J. Wu, J. Eur. Ceram. Soc., 2014, 34, 541–547 CrossRef CAS.
- S. Wang, C. Peng, M. Lü and J. Wu, J. Am. Ceram. Soc., 2013, 96, 2054–2057 CrossRef CAS.
- J. D. Forster, H. Noh, S. F. Liew, V. Saranathan, C. F. Schreck, L. Yang, J. Park, R. O. Prum, S. G. J. Mochrie, C. S. O'Hern, H. Cao and E. R. Dufresne, Adv. Mater., 2010, 22, 2939–2944 CrossRef CAS PubMed.
- H. W. Yin, Study on the coloring mechanism and preparation method of structural color, Fudan University, 2008 Search PubMed.
- J. Hou, T. Pradell, Y. Li and J. Miao, J. Eur. Ceram. Soc., 2018, 38, 4290–4302 CrossRef CAS.
- W. Li, H. Luo, J. Li, J. Li and J. Guo, Ceram. Int., 2008, 34, 1473–1480 CrossRef CAS.
- X. Li, J. Lu, X. Yu, J. Zhou and L. Li, Ceram. Int., 2016, 42, 15269–15273 CrossRef CAS.
- Y. Xu, Y. Qin and F. Ding, Ceram. Int., 2017, 43, 8636–8642 CrossRef CAS.
| This journal is © The Royal Society of Chemistry 2019 |