
 Open Access Article
 This Open Access Article is licensed under a
 Creative Commons Attribution 3.0 Unported Licence
Biological and catalytic potential of sustainable low and high valent metal-Schiff base sulfonate salicylidene pincer complexes†
Mohamed Shaker S. Adam *ab,
Omar M. El-Hadyb and
Farman Ullahc
*ab,
Omar M. El-Hadyb and
Farman Ullahc
aDepartment of Chemistry, College of Science, King Faisal University, P. O. Box 380, Al Hofuf, Al Ahsa 31982, Saudi Arabia. E-mail: madam@kfu.edu.sa; shakeradam61@yahoo.com
bChemistry Department, Faculty of Science, Sohag University, Sohag-82534, Egypt
cDepartment of Chemistry, Winnipeg University, 515 Portage Avenue, Winnipeg, Manitoba, R3B 2E9 Canada
First published on 25th October 2019
Abstract
ONO-Pincer Schiff base salicylidene (HSaln ligand) complexes with VO2+, UO22+, MoO22+ and Mn2+ ions (MSaln complexes = VOSaln, UO2Saln, MoO2Saln and MnSaln, respectively) were synthesized and fully characterized by different physico-chemical tools. The VOSaln complex was further treated with 1,10-phenanthroline which afforded a new VO-complex (VOSaln-Ph). All complexes and their ligands, as eco-friendly reagents, were explored for their biological potential as antibacterial and antifungal agents. Reactivity of MSaln complexes against the tested pathogen strains exhibited a remarkable inhibitory effect compared to the coordinated ligand (HSaln) and applicable standard drugs. Moreover, the MSaln complex-DNA interaction was investigated by ultraviolet-visible spectroscopy, viscosity and gel electrophoresis techniques affording binding strengths in the order: UO2Saln > MnSaln > MoO2Saln > VOSaln-Ph > VOSaln. Additionally, the biological potential of the investigated compounds was further explored by molecular docking to illustrate the nature of the drug–DNA interactions. All MSaln complexes show respectable anti-proliferative potential as anticancer agents against selected human carcinoma cell lines. Aside from the biological activities these complexes (MSaln complexes) were also investigated for catalytic efficiency in the Suzuki–Miyaura cross-coupling system of phenylboronic acid with 2-bromopyridine in water, sustainably. The results indicated that the MnSaln catalyst performed well with high yield. The catalytic potential of MnSaln was compared in water, water–ionic liquid mixtures and ionic liquids.
1. Introduction
Schiff bases, as azomethine or imine derivatives (–CH![[double bond, length as m-dash]](https://www.rsc.org/images/entities/char_e001.gif) N–), are the most famous chelating ligands for complexation with transition metal ions of different oxidation states to afford highly stable metal pincer complexes.1,2 Wide applicability of M-Schiff base pincer chelates could be observed in many areas, e.g. biological (antibacterial, antifungal, antiviral and anti-inflammatory effectiveness),3–5 pharmaceutical,6 catalysts,7–11 sensors,12 and organic photovoltaic materials.13 The indispensable function of the metal ion and its charge in the Schiff base complexes could help to measure their potential biologically, e.g. with DNA cleavage.14,15 The structural features of oxy- or dioxy-vanadium Schiff base chelates16,17 are of interest biologically,18 as an inhibitor of protein-tyrosine phosphatase 1B19 and DNA interacting reagents, as reported in the literature.15,20 Some biological studies of vanadyl Schiff bases and other metal Schiff base complexes have been reported recently by Rudbari et al.21 and by Shah et al.,22 respectively.
N–), are the most famous chelating ligands for complexation with transition metal ions of different oxidation states to afford highly stable metal pincer complexes.1,2 Wide applicability of M-Schiff base pincer chelates could be observed in many areas, e.g. biological (antibacterial, antifungal, antiviral and anti-inflammatory effectiveness),3–5 pharmaceutical,6 catalysts,7–11 sensors,12 and organic photovoltaic materials.13 The indispensable function of the metal ion and its charge in the Schiff base complexes could help to measure their potential biologically, e.g. with DNA cleavage.14,15 The structural features of oxy- or dioxy-vanadium Schiff base chelates16,17 are of interest biologically,18 as an inhibitor of protein-tyrosine phosphatase 1B19 and DNA interacting reagents, as reported in the literature.15,20 Some biological studies of vanadyl Schiff bases and other metal Schiff base complexes have been reported recently by Rudbari et al.21 and by Shah et al.,22 respectively.
Cancer remains the main cause of death globally. The International Agency for Research on Cancer (IARC) recently reported that 7.6 million deaths globally were due to cancer with millions of new cases per year being reported worldwide. With continues growth of cancer patients globally pushing the scientific community to discover new drugs with minimum side effects. Many research groups are focused to overcome the massive chemotherapeutic drugs side effects, as metal-complex drugs.14,20 Hence, many reported works highlighted on the research for the development of various metal Schiff base chelates as anticancer agents along with the study of their side effects.23 DNA binding and the anticancer reactivity on transition metal Schiff base complexes have been evaluated recently and reported in details, e.g. by Abdel-Rahman et al.24,25
The high reactivity of M-Schiff base pincer chelates towards DNA play pivotal role for such progressing in nucleic acids biochemically as foot-printing reagents, models for limited enzymes and therapeutic use as drugs.26 Currently, there are many published literatures reporting the anticancer activities of various transition metal Schiff base complexes, Abd El-Halim et al.27 studied the Cr2+, Fe2+, Mn2+, Cu2+, Cd2+, Co2+ and Ni2+-1,10-phenanthroline–Schiff base complex as high antimicrobial and anticancer reagents. The antimicrobial and anticancer activity of Bi3+, Pb2+, Cr3+, Cu2+, Cd2+, Ba2+, Ni2+, Fe2+, Nd2+ and Sn2+–Schiff base complexes are studied by Sheng et al.28 and Sharaby et al.29 They investigated the microbial and anticancer potentials of sulfonamide imine and mixed coordinated ligand complexes with glycine spectroscopically. Mahmoud et al. published many biological studies of bidentate Schiff base ferrocene metal complexes derived from amino acids.30–33 Manganese and some other metal chelates of polymeric Schiff base ligand were studied as antimicrobial reagents by Rasool and Hasnain.34 Moreover, the coordination chemical behaviour and biological activity of Zn2+, Cu2+, Ni2+, Co2+ and Mn2+ towards ONO-tridentate imine ligand, i.e. 2-[(2-hydroxy-naphthalen-1-ylmethylene)-amino]-benzoic acid, as a non-water-soluble ligand was investigated and reported by Refat et al.35 Zayed et al. presented the coordination chemistry, biological efficiency and molecular docking studies of various transition metal complex.36–39 All previous biological reported studies assigned important results for the high potential of M-Schiff base pincer chelates towards bacteria, fungi and cancers, as well as, high DNA-cleavages.
C–C, C–O and C–N cross-coupling protocols are one of the most famous catalytic organic approaches for various organic syntheses.40 High oxidation state metal complexes are widely known as catalysts for oxidation and oxygenation processes, e.g. MoO22+, WO22+, UO22+, VO2+ and VO+ species.20,41–43 Low valent metal complexes, e.g. M2+ ions, are highly active catalysts for most of the cross couplings44,45 in order to generate M0 active catalysts. For example, Mn2+-pincer chelates display an effective role as homogeneous catalysts for most versatile and prevalent recent synthetic devises under sustainable conditions.46 Sustainably, the incorporated sodium sulfonate group to the synthesized Schiff base ligand improves its reactivity and the corresponding metal complexes under green conditions.41 Ionic liquids, as imidazolium- and pyridinium-based liquids are of interest as solvents47–50 or co-catalysts51–54 for many C–C biaryls syntheses, e.g. Suzuki–Miyaura cross-coupling protocols.
In the present work, we present the synthesis, biological activities and catalytic performance of the polar chelate pincer complexes, synthesized from the water-soluble Schiff base pincer ligand with various metal ions, i.e. MoO22+, UO22+ and VO2+ and Mn2+ ions. Their biological reactivity was investigated as antimicrobial and anticancer agents. Moreover, DNA interaction with the prepared complexes was explored and supported by the molecular docking studies. We also report the catalytic behavior with the high valent metal ions in their Schiff base complex catalysts, i.e. MoO22+, UO22+ and VO2+ ions, as well as, Mn2+-complex in Suzuki–Miyaura cross-coupling processes of arylboronic acid with different aryl halides, representatively.
2. Results and discussion
2.1. Synthesis and structure estimation
ONO-Tridentate polar pincer ligand (HSaln ligand) was prepared according to the well-known condensation reaction protocol, which was obtained from the reaction of 1.0 equivalent of anthranilic acid in ethanol with 1.0 equivalent of 5-salicylaldehyde-sodium sulfonate sustainably.41 HSaln ligand was fully characterized by the most valuable spectroscopic techniques (Tables 1 and 2, which are supported by attached files in the ESI†). Moreover, the coordination features of HSaln ligand were investigated by complexation with M2+ ions in an aqueous media.41 Hence, a new series of complexes with metal ions of high and low oxidation states, i.e. with VO2+, MoO22+, UO22+ and Mn2+ ions as MSaln complexes were synthesized. All MSaln complexes were prepared under sustainable conditions, i.e. in H2O, with 1![[thin space (1/6-em)]](https://www.rsc.org/images/entities/char_2009.gif) :1 ligand metal ions ratio afforded VOSaln, MoO2Saln, UO2Saln and MnSaln, respectively (Scheme 1). VOSaln in ethanol was further treated with 1,10-phenanthroline (1:1 ratio) provided a new complex (VOSaln-Ph) by substitution of the two coordinated H2O molecules as observed elsewhere.43 To avoid oxidation of Mn2+ ions to Mn3+ ion in the synthetic pathway of MnSlan, the reaction carried out under N2 atmosphere.46
:1 ligand metal ions ratio afforded VOSaln, MoO2Saln, UO2Saln and MnSaln, respectively (Scheme 1). VOSaln in ethanol was further treated with 1,10-phenanthroline (1:1 ratio) provided a new complex (VOSaln-Ph) by substitution of the two coordinated H2O molecules as observed elsewhere.43 To avoid oxidation of Mn2+ ions to Mn3+ ion in the synthetic pathway of MnSlan, the reaction carried out under N2 atmosphere.46
| Compound | MW (g mol−1) | Elemental analysis found%, (calc.%) | Color | Mp (°C) | Electronic transition spectra | Mass spectra (m/z) | |||||
|---|---|---|---|---|---|---|---|---|---|---|---|
| C | H | N | λmax (nm) | εmax (mol−1 cm−1) | Assign. | [M + Na+] | [M − Na+] | ||||
| HSaln ligand | 343.29 | 49.25 (48.98) | 3.08 (2.94) | 3.81 (4.08) | Pale yellow | 164 | 325, 256 | 5894, 12436 |
n → π*, π → π* | ||
| VOSaln | 444.24 | 38.11 (37.85) | 2.98 (2.72) | 3.07 (3.15) | Dark green | 288 | 395, 310, 249 | 5073, 8211, 12099 |
LM-CT, n → π*, π → π* | 465, 467, 468, 469, 471 | 419, 420, 421, 422, 423 |
| VOSaln-Ph.·H2O | 606.43 | 51.76 (51.50) | 3.02 (2.99) | 7.36 (6.93) | Brownish green | >300 | 376, 322 | 4863, 8956 | LM-CT, n → π* | 610, 611, 612 | 565, 566 |
| UO2Saln | 629.31 | 27.10 (26.72) | 1.94 (1.60) | 2.12 (2.23) | Deep yellow | 304 | 388, 299, 271, 238 | 3418, 5874, 6693, 10112 |
LM-CT, n → π*, π → π*, π → π* | 604, 605, 606, 607 | 651, 652, 653 |
| MnSaln | 250.25 | 37.47 (37.35) | 3.44 (3.13) | 2.86 (3.11) | Brown | 294 | 416, 329, 284 | 3015, 7488, 18894 |
LM-CT, n → π*, π → π* | 471, 473, 474 | 425, 427, 428 |
| MoO2Saln | 287.24 | 34.66 (34.51) | 1.77 (2.07) | 2.53 (2.87) | Orange | >300 | 449, 320, 262 | 2322, 6152, 15749 |
LM-CT, n → π*, π → π* | 4645, 465 | 510, 511, 512 |
![[small nu, Greek, macron]](https://www.rsc.org/images/entities/char_e0ce.gif) , cm−1), distinguished magnetic moments (μ) and molar conductivity values (Λm) of HSaln ligand and its MSaln complexes ([compound] = 1 × 10⁻³ mol dm−3) in DMSO and DMF at ambient temperaturea
, cm−1), distinguished magnetic moments (μ) and molar conductivity values (Λm) of HSaln ligand and its MSaln complexes ([compound] = 1 × 10⁻³ mol dm−3) in DMSO and DMF at ambient temperaturea
| Group | Compound | ||||||
|---|---|---|---|---|---|---|---|
| HSaln ligand | VOSaln | VOSaln-Ph | UO2Saln | MoO2Saln | MnSaln | ||
| a br (broad), s (strong), m (moderate), w (weak), ar (aromatic CH), alph (aliphatic CH). | |||||||
| O–H(water) | 3420(m br), 3342(m br) | 3368(m br) | 3403(w), 3135(w br) | 3352(w br), 3296(m br) | 3308(m br), 3233(m br) | ||
| O–H | 3401(w br) | ||||||
| C–Har | 3058(w) | 3062(w) | 3080(w) | 3074(w br) | 3124(w) | ||
| CO |
1601(m) | 1597(s) | 1585(s) | 1589(m) | 1693(m) | 1643(m) | |
| C–O(phenolic) | 1494(w) | 1451(m) | 1455(m) | 1470 (m) | 1478(w) | 1455(m) | |
| C–O(carboxylic) | 1419(w) | 1422(m) | 1410(w) | 1409 (w) | 1403(m) | ||
| CN(azomethine) |
1577(w) | 1518(s) | 1531(s) | 1559(m) | 1612(m) | 1589(m) | |
| C–N | 1236(m) | 1175(s) | 1154(m) | 1159(m) | 1162(s) | 1164(s) | |
| S–O− | 1382(w) | 1340(m) | 1372(m) | 1362(m) | 1378(w) | 1402(m) | |
| SO |
1103(m) | 1142(m) | 1108(m) | 1099(m) | 1112(s) | 1107(s) | |
| MO |
962(m) | 964(m) | 900(m) | 919(w) | |||
| M–O | 722(w) | 743(w) | 723(m) | 749(w) | 751(w) | ||
| M–N | 608(m) | 608(m) | 666(w) | 583(m) | 601(w) | ||
| Λm (Ω−1 cm2 mol−1) | DMSO | 139 | 140 | 130 | 117 | 125 | 142 |
| DMF | 158 | 154 | 149 | 142 | 151 | 163 | |
| μ (B.M.) | — | 2.79 | 2.24 | — | — | 5.74 | |
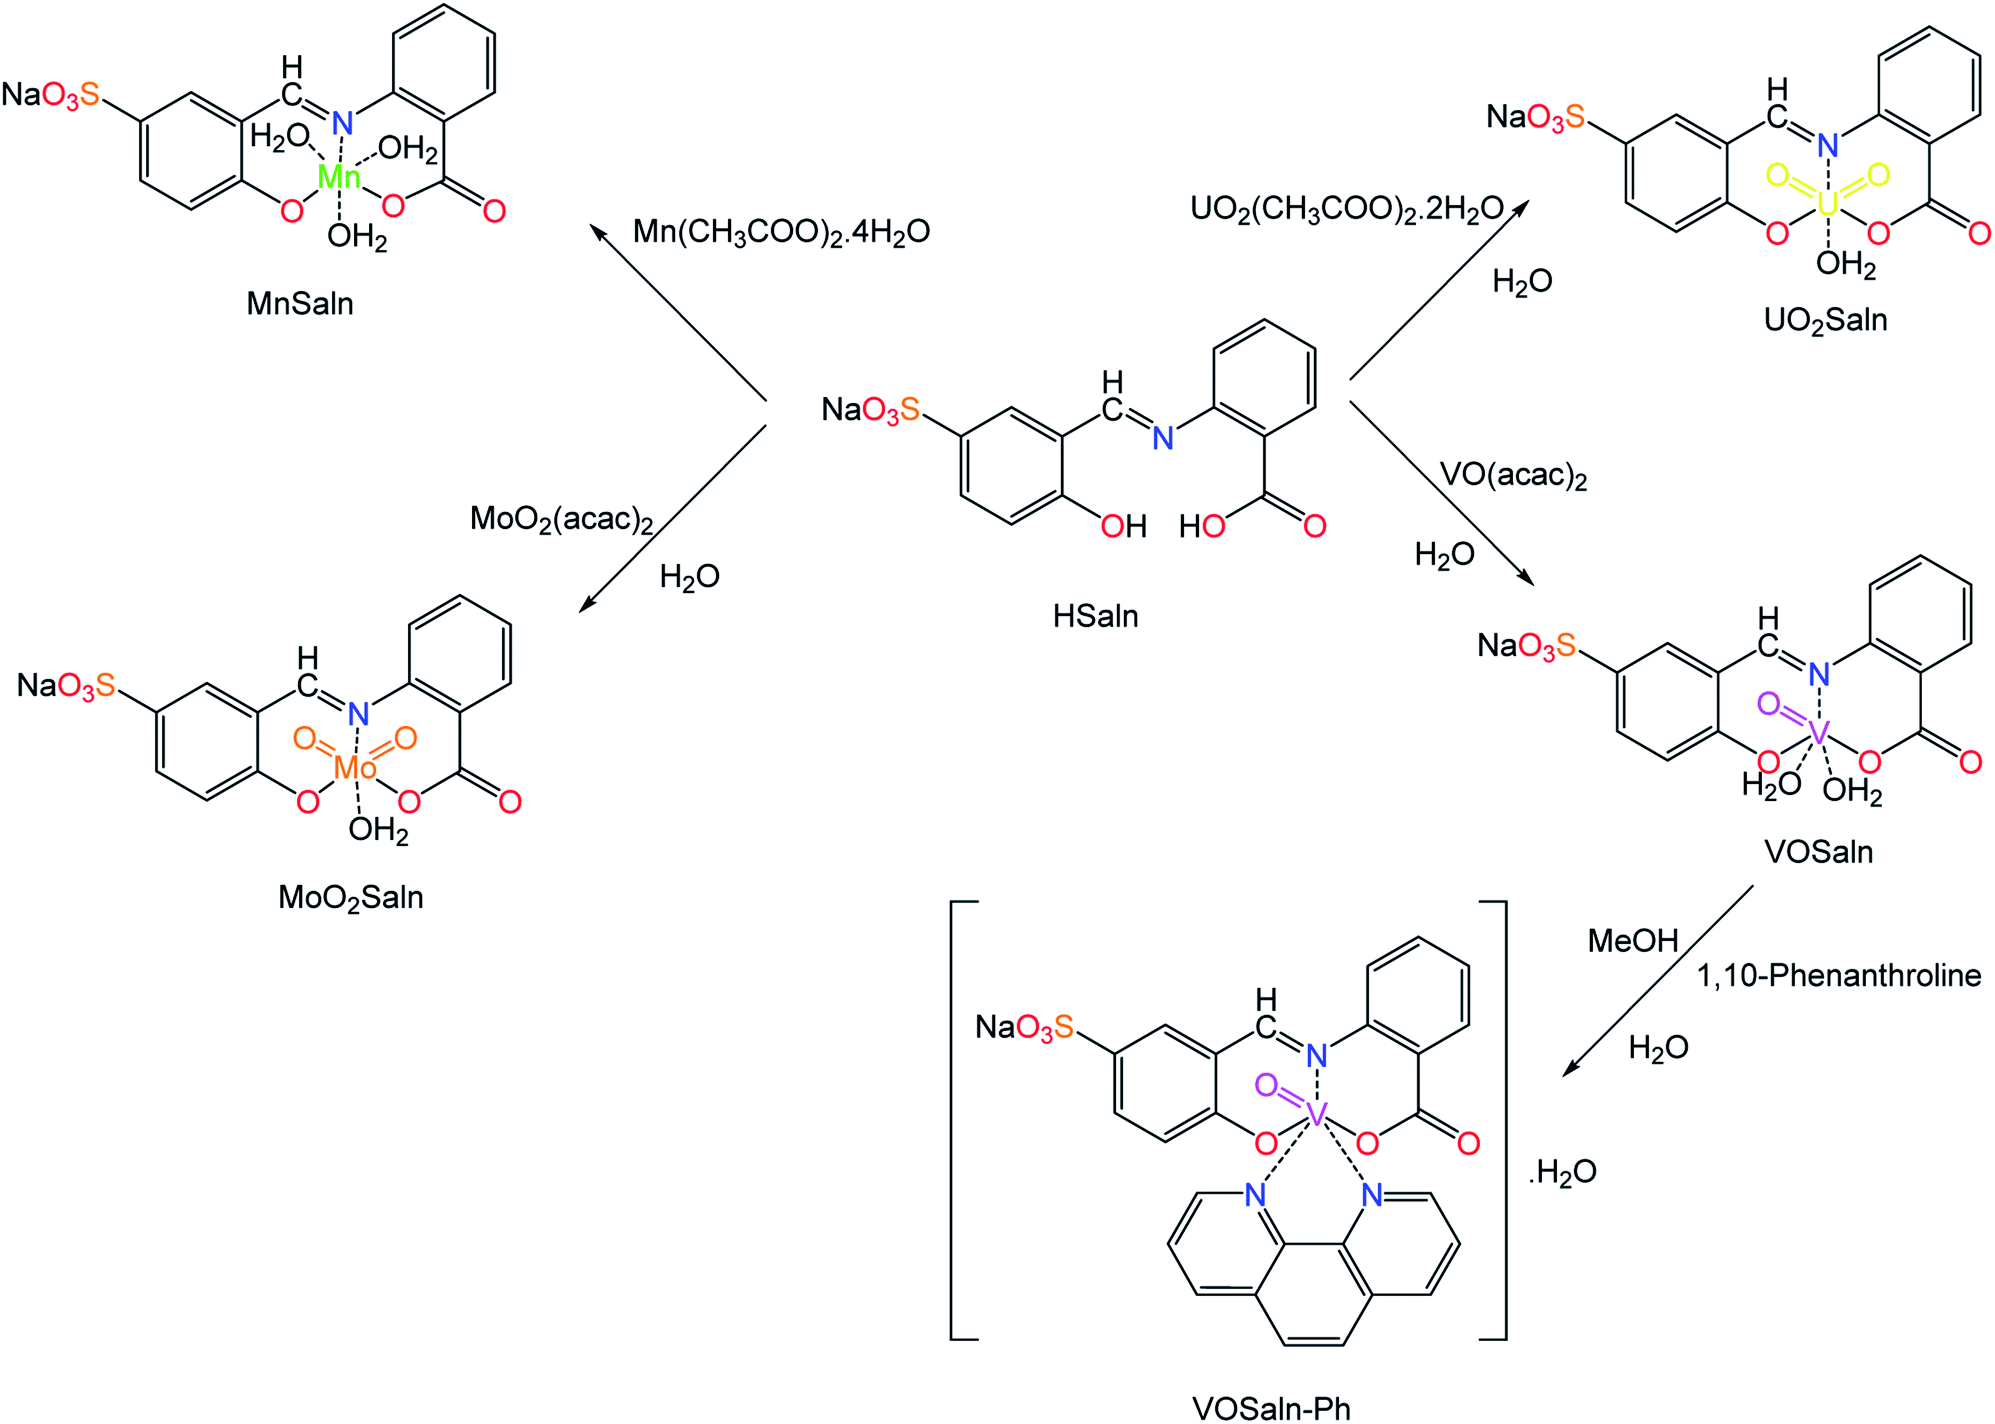 | ||
| Scheme 1 Diagrammatic scheme for the synthesis of MSaln complexes from HSaln ligand. | ||
All M-complexes (MSaln) were characterized 1H-NMR, 13C-NMR, infrared, electronic and mass spectra, elemental analyses, thermogravimetric analyses (TGA), measurements of conductance, and magnetic susceptibilities were utilized to estimate the complexation mode of those metal ions with HSaln ligand.44 They are fairly soluble in water due to the presence of a polar group (Na+SO3−–) and in DMSO as high coordinated solvent. They are sparingly soluble in acetone, methanol and acetonitrile. C, H and N percentages values of the elemental analysis, as recorded in Table 1, are very close to the proposed structure of all MSaln complexes, with very little difference up to ±0.4% referring to high purity of all MSaln complexes.
1H and 13C NMR spectra of HSaln ligand are reported, presented in the ESI†41 and compared to those complexes, i.e. MoO2Saln, and UO2Saln. NMR spectra of MoO2Saln and UO2Saln were measured in DMSO-d6 at room temperature and presented in Fig. S5–S9 in the ESI.†
In 1H NMR spectra, the disappearance of a singlet at 10.26 ppm which belongs to –OH group of the HSaln ligand in MoO2Saln and UO2Saln is the indication for the de-protonation of hydroxyl and formation of desired complexes.41 Similarly, the distinguished –OH of the carboxylic group in HSaln ligand within deprotonation coordinated to M2+ ion. The characteristic broad singlet signal of the Schiff base (–CHN–) was shifted from 10.82 ppm (HSaln ligand) to 11.00 and 9.34 ppm in MoO2Saln and UO2Saln respectively, by the coordination of nitrogen lone pair in the Schiff base moiety, as observed elsewhere55 (Scheme 1). From 13C NMR spectral scans, the signal of the Schiff base group (–CHN–) was clearly observed when shifted after coordination to MoO22+ and UO22+ ions from 192.20 ppm to 163.41 and 161.20 ppm in MoO2Saln and UO2Saln, respectively. Moreover, the carboxylate CO group was little shifted from 169.22 ppm41 to 169.92 and 174.11 ppm in MoO2Saln and UO2Saln, respectively.
The electronic transitions in the aqueous solution of all MSaln complexes were recorded at λmax, nm, with calculating the molar absorptivity, εmax, mol−1 cm−1, in Table 1 (Fig. 1). It was found some specific transitions of π → π* and n → π* in the UV region for HSaln ligand (256 and 325 nm, respectively) with little shift after bonding to the metal ions, MSaln complexes, to be 249 and 310 nm for VOSaln, 262 and 320 for MnSaln and 284 and 329 nm for MoO2Saln, respectively. VOSaln-Ph shows only one band at 322 nm for n → π* transition. UO2Saln displays two high energy bands at 238 and 271 nm for π → π* and an additional band at 299 nm for n → π* transition (Fig. 1). In the colored area of the visible region, all MSaln complexes assign broad bands at 395, 376, 388, 449 and 416 nm for probably the M-LCT transitions for VOSaln, VOSaln-Ph, UO2Saln, MnSaln, MoO2Saln, respectively.56 No detection for the d → d transition in any of the complexes could be observed even at higher concentration of MSaln (1.0 × 10⁻³ mmol). This result suggested that the metal complexes are in high spin-state.
 | ||
| Fig. 1 Electronic spectral scans of HSaln ligand and its MSaln complexes, [compound] = 1 × 10⁻⁵ mol dm−3 in an aqueous medium at room temperature. | ||
The distinct infrared spectral bands values for HSaln ligand are listed in Table 2, which also affected by the presence of M2+ ions. The IR spectrum of all compounds is given in Fig. S10–S15, in the ESI.† From Table 2, a broad spectral band of HSaln ligand at 3401 cm−1, which corresponded to the hydroxy-phenolic group and/or the hydroxyl-carboxylic group, completely disappeared in all MSaln complexes. Other broad vibrating bands appeared at the same area at 3342 and 3420 cm−1 for VOSaln, 3135 and 3403 cm−1 for UO2Saln, 3296 and 3352 cm−1 for MoO2Saln, and 3233 and 3308 cm−1 for MnSaln due to the presence of the coordinated H2O ligands. The presence of the –OH band of VOSaln-Ph is due to the H2O molecule in the crystal lattice of the complex at 3368 cm−1. The characteristic band of Schiff base group –CN– (1577 cm−1) is also highly shifted after bonding to M2+ ions to be 1518, 1531, 1559, 1612 and 1559 cm−1 for VOSaln, VOSaln-Ph, UO2Saln, MoO2Saln and MnSaln, respectively. Particularly, the single bond of C–N at 1236 cm−1 for HSaln ligand was also influenced by the complexation to be 1175, 1154, 1159, 1162 and 1164 cm−1 for VOSaln, VOSaln-Ph, UO2Saln, MoO2Saln and MnSaln, respectively. Moreover, the vibrational spectra of the C–O single bond of the phenolic and carboxylic groups was shifted due to the complexation from 1494 and 1419 cm−1 to be 1451 and 1422 cm−1 for VOSaln, 1455 and 1410 cm−1 for VOSaln-Ph, 1470 and 1409 cm−1 for UO2Saln, 1478 and 1403 cm−1 for MoO2Saln, and 1455 cm−1 for MnSaln (Table 2). The coordination feature of the carboxylate group was similar to that reported by Ziegler (2003).55 New stretching bands were explored in the infrared spectra of the novel M-complexes at 962, 964, 900 and 919 cm−1 for VOSaln, VOSaln-Ph, UO2Saln and MoO2Saln, resulted from the bond stretching of MO. Furthermore, the coordination bonds could be found for the M–O and M–N bonding at 722 and 608 for VOSaln, 743 and 608 cm−1 for VOSaln-Ph, 723 and 666 cm−1 for UO2Saln, 749 and 583 cm−1 for MoO2Saln, and 751 and 601 cm−1 for MnSaln, respectively.55
Mass spectra of HSaln ligand was reported previously,41 whereas, that measurement for VOSaln, VOSaln-Ph, UO2Saln, MoO2Saln and MnSaln was supported by Fig. S16–S20 in the ESI.† All MSaln complexes show characteristic base peaks for the complex as [M + Na+] and as complex anion without sodium cation [M − Na+]. Evaluation of H2O in the M-complexes as coordinated or crystalline molecules could be established by TGA. The TGA results as mass lose percentages of the represented complexes are shown in Fig. S21 (ESI†), those all complexes have various numbers of diagnostic H2O molecules in the lattice or in the coordination sphere. VOSaln, MnSaln, MoO2Saln and UO2Saln complexes have mass lose percentage only in the temperature range from 180 to 230 °C (Δmexp. = 7.9, 12.4, 3.2 and 2.5%), which are almost convenient with the calculated mass lose percentages of H2O in the coordination sphere (Δmcal. = 8.1, 12.0, 3.7 and 2.8%, respectively). Hence, VOSaln, MnSaln, MoO2Saln and UO2Saln have two, three, one and one coordinated water molecules, respectively. On the other hand, VOSaln-Ph has no observed mass lose percentage in that range, however, it has mass lose percentage in the temperature range from 100 to 130 °C, which is corresponded to the crystal lattice molecules. The mass lose percentage is, Δmexp., 3.1% referring to the presence of one H2O molecule in the lattice per one molecule of VOSaln-Ph complex (Δmcal. = 2.9%, approximately).
Conductance values, Λm, of all complexes in DMSO or DMF were measured and listed in Table 2, which informed us about the polar nature of studied compounds and the number of ions in the solution.57 The high conductivity of HSaln ligand and all MSaln complexes refers to that they are polar compounds with, particularly, two counter ions in their solutions, because of the presence of –SO3− and Na+ ions. Magnetic features of the binary MSaln complexes proposed that VOSaln, VOSaln-Ph and MnSaln complexes have high spin via para-magnetic properties as 2.79, 2.24 and 5.74 B.M., respectively.
For V(IV) ion with d1 electronic configuration, the expected magnetism is agreed with the derived value for VOSaln and VOSaln-Ph. The observed for manganese complex with oxidation state of +2, a d5 ion of Mn2+ could exist as high spin (5 unpaired electrons) due to the magnetic moment value. The reported magnetic values in Table 2 illustrate that there is no possibility for interaction between the central metal ions in their chelates.20
2.2. Stability and thermodynamic properties
The stability of all MSaln complexes was determined by spectrophotometric continuous variation with appreciation of the stoichiometric molar ratios of MSaln complexes,20,58 which referred to that 1 equivalent of M2+ ion formed a complex with 1 equivalent of HSaln ligand, as presented in Fig. 2. The stability constants Kf of MSaln complexes were deduced from eqn (1)20,41 and tabulated in Table 3. Kf magnitudes elucidated that all MSaln complexes are quite stable in the aqueous media, moreover, UO2Saln is the most stable complex and VOSaln is the less stable one. The stability order could be presented for all MSaln as follow: MoO2Saln > UO2Saln > MnSaln > VOSaln-Ph > VOSaln complex. | ||
| Fig. 2 Continuous variation plots for the stoichiometric molar ratios in MSaln complexes in an aqueous- medium at [MSaln] = 1 × 10⁻⁴ mol dm−3 and 25 °C. | ||
| Complex | T (°C) | Kf × 108 (L mol−1) | −ΔfG (kJ mol−1) | −ΔfH (kJ mol−1) | −ΔfS (J mol−1 K−1) |
|---|---|---|---|---|---|
| VOSaln | 20 | 49.23 | 54.36 | 6.99 | 86.27 |
| 25 | 38.31 | 54.67 | |||
| 30 | 22.93 | 54.29 | |||
| 35 | 14.45 | 54.00 | |||
| 40 | 7.58 | 53.20 | |||
| VOSaln | 20 | 51.22 | 54.46 | 2.38 | 72.85 |
| 25 | 40.99 | 54.83 | |||
| 30 | 29.08 | 54.89 | |||
| 35 | 18.12 | 54.58 | |||
| 40 | 10.50 | 54.05 | |||
| MoO2Saln | 20 | 54.77 | 54.80 | 2.01 | 72.15 |
| 25 | 48.75 | 55.03 | |||
| 30 | 40.12 | 55.13 | |||
| 35 | 35.65 | 55.33 | |||
| 40 | 27.49 | 54.19 | |||
| MnSaln | 20 | 59.02 | 54.80 | 2.02 | 72.20 |
| 25 | 44.41 | 55.03 | |||
| 30 | 32.01 | 55.13 | |||
| 35 | 24.26 | 55.33 | |||
| 40 | 11.08 | 54.19 | |||
| UO2Saln | 20 | 62.18 | 54.93 | 11.50 | 32.52 |
| 25 | 55.82 | 55.60 | |||
| 30 | 47.62 | 56.13 | |||
| 35 | 39.65 | 56.59 | |||
| 40 | 30.31 | 56.81 |
Kf values could be applied to estimate the thermodynamic parameters values for all MSaln complexes from eqn (2) (Gibb's–Helmholtz equation as a function of the temperature reciprocal in Kelvin, 1/T) (Fig. S22, ESI†). The thermodynamic parameters, ΔfH and ΔfS, could be derived from eqn (2). Conclusively, the Gibb's free energy values (ΔfG) were determined as negative values. So, the spontaneous complexation between HSaln ligand and M2+ ion under given conditions is the result of the negative ΔfG. Moreover, the negative values of ΔfH illustrate the exothermic nature of the complexation reaction and the strong bonding between HSaln ligand and the central metal ion in all MSaln complexes.57
The high stability pH range (3.1–9.7) for the new MSaln chelates and typical dissociation curves were displayed by pH-plot, i.e. absorbance values versus different pH at λmax of each M-chelate, as demonstrated in (Fig. 3). This explained that the consistency of the metal chelate could be greatly stabilized by Schiff base ligands within complexation. Hence, proper pH extent for different applicability for the novel MSaln derives from pH = 3.1 to pH = 10.0. The proposed formula for the metal chelates is identified by correlation among the existence of magnetic measurements, molar conductance, elemental analysis, electronic spectra and infrared spectra.
 | ||
| Fig. 3 Dissociation plot of MSaln complexes in an aqueous media at various pHs. | ||
2.3. Biological studies
N–) improved the antimicrobial potential of all studied reagents, furthermore, the addition of this group increased the potential of MSaln complexes relative to the HSaln ligand. One explanation for this comes from the chelation theory effect.59,60 The high positive charge and the strong coordination capability of the central metal ion are considered to play an observable role in improving the antimicrobial action of the HSaln ligand. This effect was seen in the current data as the highest antimicrobial potential was seen with UO2Saln and MnSaln complexes. UO2Saln could increase its coordination number as a 4f element61 and also, MnSaln, which has the highest number of the labile coordinated solvent molecules.62 Additionally, the π-electron delocalized rings over the antimicrobial reagents and their lipophilic character could enhance their action and effect. The high solubility of the current compounds resulted from the bonded p-sodium sulfonate group14 and their conductivity could be the reason for their valuable antimicrobial action. The activity index percentages, A, of the antibacterial and antifungal potential of HSaln ligand and MSaln complexes, which are calculated according to eqn (3) and recorded in Tables S1 and S2 (ESI†). The antimicrobial capability of our studied compounds could also be measured by activity index percentages.
| Compound | Inhibition zone (mm) | |||||
|---|---|---|---|---|---|---|
| Serratia marcescens (−ve) | Escherichia coli (−ve) | Staphylococcus aureus (+ve) | ||||
| Conc. (μg mL−1) | 10 | 20 | 10 | 20 | 10 | 20 |
| HSaln ligand | 7 ± 0.23 | 10 ± 0.33 | 5 ± 0.21 | 8 ± 0.15 | 9 ± 0.18 | 14 ± 0.24 |
| VOSaln | 15 ± 0.17 | 34 ± 0.16 | 14 ± 0.43 | 33 ± 0.13 | 18 ± 0.14 | 40 ± 0.12 |
| VOSaln-Ph | 13 ± 0.21 | 30 ± 0.27 | 12 ± 0.24 | 29 ± 0.21 | 16 ± 0.11 | 36 ± 0.17 |
| MnSaln | 16 ± 0.18 | 36 ± 0.24 | 15 ± 0.14 | 34 ± 0.27 | 19 ± 0.16 | 42 ± 0.19 |
| MoO2Saln | 14 ± 0.11 | 33 ± 0.12 | 13 ± 0.04 | 32 ± 0.19 | 17 ± 0.05 | 38 ± 0.17 |
| UO2Saln | 17 ± 0.05 | 38 ± 0.27 | 16 ± 0.07 | 35 ± 0.19 | 20 ± 0.11 | 44 ± 0.25 |
| Gentamycin | 19 ± 0.71 | 40 ± 0.33 | 17 ± 0.15 | 37 ± 0.72 | 22 ± 0.93 | 46 ± 0.11 |
| Compound | Inhibition zone (mm) | |||||
|---|---|---|---|---|---|---|
| Candida albicans | Aspergillus flavus | Trichophyton rubrum | ||||
| Conc. (μg mL−1) | 10 | 20 | 10 | 20 | 10 | 20 |
| HSaln ligand | 4 ± 0.14 | 7 ± 0.16 | 3 ± 0.21 | 8 ± 0.34 | 5 ± 0.10 | 11 ± 0.07 |
| VOSaln | 22 ± 0.13 | 34 ± 0.37 | 13 ± 0.18 | 23 ± 0.18 | 14 ± 0.41 | 29 ± 0.17 |
| VOSaln-Ph | 18 ± 0.17 | 29 ± 0.12 | 9 ± 0.17 | 19 ± 0.12 | 10 ± 0.16 | 25 ± 0.15 |
| MnSaln | 21 ± 0.11 | 33 ± 0.27 | 12 ± 0.27 | 22 ± 0.22 | 13 ± 0.23 | 28 ± 0.13 |
| MoO2Saln | 19 ± 0.10 | 32 ± 0.12 | 11 ± 0.10 | 21 ± 0.09 | 12 ± 0.05 | 27 ± 0.12 |
| UO2Saln | 23 ± 0.14 | 36 ± 0.17 | 14 ± 0.11 | 24 ± 0.21 | 15 ± 0.13 | 30 ± 0.23 |
| Fluconazole | 24 ± 0.55 | 37 ± 0.62 | 14 ± 0.71 | 25 ± 0.90 | 16 ± 0.49 | 31 ± 0.88 |
Table 6 presents the minimum inhibitory concentration (MIC) potential of HSaln ligand and MSaln complexes versus both the bacteria and fungi strains. The MIC values of the HSaln ligand and its MSaln complexes versus the chosen bacterial and fungi strains indicate that the HSaln ligand has the lowest antimicrobial potential compared to the metal pincer chelates (Fig. 4). This suggests that the central M2+ ion plays an essential role in the antimicrobial potential of the studied compounds.24
| Compound | Minimum inhibition concentration (MIC) μg mL−1 | |||||
|---|---|---|---|---|---|---|
| S. Marcescens | E. coli | S. aureus | C. albicans | A. flavus | T. rubrum | |
| HSaln ligand | 6.25 | 7.50 | 5.50 | 5.75 | 8.50 | 6.75 |
| VOSaln | 3.25 | 2.75 | 2.25 | 4.25 | 5.25 | 5.00 |
| VOSaln-Ph | 4.75 | 4.25 | 3.75 | 3.00 | 3.75 | 3.50 |
| MnSaln | 3.75 | 3.25 | 2.75 | 2.75 | 4.25 | 4.00 |
| MoO2Saln | 4.50 | 3.75 | 3.25 | 4.00 | 4.75 | 4.50 |
| UO2Saln | 2.75 | 2.50 | 1.75 | 2.25 | 3.50 | 3.00 |
 | ||
| Fig. 4 Histogram showing MIC values for antimicrobial activity of HSaln ligand and MSaln complexes. | ||
The variation in the activity of the metal complexes against the different microbes possibly results from a difference in the ribosomes of the various microbial cells or a difference in the cell membrane permeability of these microbes. The lower activity of complexes as compared to others may be attributed to the low lipid solubility of these complexes. If this is the case, the metal ion may not be able to reach its site of action within the cell. Chelation itself plays a significant role in determining antibacterial behavior of the MSaln complexes but concurrently factors such as solubility, size, dipole moment, coordinating sites, redox potential of metal ion, solubility, bond length between metal and the ligand, geometry of complexes, steric, pharmacokinetic, concentration and hydrophobicity also have substantial influence on the antibacterial activity. Given that the tested complexes were more active against Gram (+ve) than Gram (−ve) bacteria, it may be concluded that the antibacterial activity of the compounds is related to the cell wall structure of the bacteria.
2.3.2.1. Electronic spectroscopy. The nature of bonding of MSaln complexes with DNA was estimated with electronic spectrophotometrically.14,20,24,25 There are three reported types of bonding with DNA; the first is an interaction of two grooved DNA double spiral, the second one is an intercalation of the arranged native DNA base pairs, and the third one is an electrostatic interaction with the nucleic sugar-phosphate negative charge (which is parallel to the external double spiral DNA without any selectivity).20,63 The DNA–MSaln complexes interaction was confirmed in buffered solutions of DNA by the electronic transition spectral values (Table 7), which provided the hypochromic character of that interaction and increase of the high π → π* interaction transition (Fig. 5). The nature of π → π* transition could be a result of the nitrogenous DNA base pairs and the delocalized aromatic system in the coordinated ligand in MSaln complexes.14,64 UO2Saln complex shows observable enhancement of the π → π* transition band, with increased energy due to the DNA and UO2Saln complex interaction (Fig. 5). Hypochromism is the consequence of interaction between the coordinated ligand orbital and the DNA base pairs orbitals via intercalation mode. Hence, there is a red shift in the visible region of the transition band for the interaction of DNA and MnSaln complex (from the maximum values at 449 to 368 nm; Fig. 6) with a hypochromatic character due to the decreasing of the maximum absorption.14
| Compound | λmax free (nm) | λmax bound (nm) | Δn | Chromism | Kb × 105 | ΔG≠b kJ mol−1 | |
|---|---|---|---|---|---|---|---|
| % | Type | ||||||
| a Kb, mol−1 dm3. | |||||||
| MnSaln | 251 | 240 | 11 | 4.00 | Hypo | 3.92 | −31.20 |
| 403 | 325 | 78 | 8.65 | ||||
| MoO2Saln | 252 | 252 | 0 | 3.80 | Hypo | 2.60 | −30.20 |
| 271 | 271 | 0 | 5.91 | ||||
| 289 | 288 | 1 | 9.23 | ||||
| 396 | 394 | 2 | 39.76 | ||||
| VOSaln-Ph | 251 | 252 | 1 | 2.14 | Hypo | 1.35 | −29.27 |
| 272 | 271 | 1 | 1.59 | ||||
| 289 | 288 | 1 | 3.03 | ||||
| UO2Saln | 252 | 252 | 0 | 1.65 | Hypo | 6.50 | −32.43 |
| 320 | 325 | 5 | 23.93 | ||||
| 386 | 386 | 0 | 44.62 | ||||
| VOSaln | 239 | 238 | 1 | 2.20 | Hypo | 1.70 | −29.18 |
| 252 | 251 | 1 | 2.10 | ||||
| 270 | 269 | 1 | 2.10 | ||||
| 288 | 286 | 2 | 2.58 | ||||
| 354 | 352 | 2 | 7.22 | ||||
| 382 | 376 | 6 | 19.05 | ||||
 | ||
| Fig. 5 The UV-vis spectral scans of UO2Saln in the buffer solution in absence and presence of DNA with interval time 15 min. | ||
 | ||
| Fig. 6 The UV-vis spectral scans of MnSaln complex in absence and presence of DNA with interval time 15 min. | ||
The measured value of the DNA–MSaln complexes interaction is the binding constant. These spectrophotometric parameters (Kb) were derived from eqn (4) and are recorded in Table 7. Kb is a measure of the strength of the DNA–MSaln complexes binding interaction. The binding order of DNA with MSaln complexes is as follows: UO2Saln > MnSaln > VOSaln > MoO2Saln > VOSaln-Ph complex. From Table 7, the chromism type and values for the DNA–MSaln complexes interacting binding and Δn, which points out to the characteristic absorption band shift for MSaln complexes due to its DNA-interaction. The Gibbs' free energy values ΔG≠b are presented as negative values, which could be the measurement of the binding strength of DNA–MSaln complexes (Table 7). The most negative ΔG≠b is for UO2Saln as −32.43 kJ mol−1 and −31.20, −30.20, −29.27 and −29.18 kJ mol−1 for MnSaln, MoO2Saln, VOSaln and VOSaln-Ph complexes, respectively. The variation in the Gibbs' free energy values between the MSaln complexes is due to the nature of the central metal ion.
Besides what is mentioned above about the nature of binding between DNA and MSaln complexes, the structural feature of MSaln complexes could have an important impact on the variation between the studied complexes in such binding. Both UO2Saln and MnSaln complexes have the highest interaction potential with DNA (Table 7). There are two additional factors might account for their high DNA interaction. For the UO2Saln complex, the central metal ion as 4f element has a higher coordination potential than transition metal ions (M2+) in MSaln complexes. Usually the UO22+ ion can form complexes with more than 6 coordination number, as observed elsewhere.55 This could increase the strength of the bonding interaction of the UO2Saln complex with DNA more than the other MSaln complexes, via the intercalative mode (Fig. 5). Moreover, MnSaln complex has the highest number of the labile coordinated solvent molecules, i.e. three H2O,65 and could have progressed reactivity towards DNA binding more than the other MSaln complexes within replacement. This could be suggested by the DNA interaction reactivity of VOSaln and VOSaln-Ph complexes in which VOSaln is more reactive than VOSaln-Ph complex. The secondary coordinated ligand, liable solvent water in VOSaln and 1,10-phenanthroline in VOSaln-Ph complex, increases the DNA interaction in case of water and reduces in case of 1,10-phenanthroline. Particularly, 1,10-phenanthroline is a stronger coordinated ligand compared to water, which would increase the VOSaln-Ph complex could be bound to DNA via interaction more than that of the coordinated water.27,66 The conclusion of the ΔG≠b values supports strongly the replacement mechanism.14
2.3.2.2. Viscosity measurements. The measured viscosities of DNA with and without MSaln complexes can provide information on the bonding features between DNA and MSaln complexes (calculated according to eqn (7) and (8); as reported previously for different transition metal-Schiff base complexes14,20,24). Ethidium bromide (EB) is known to bind to DNA and cause an increase in the DNA viscosity (Fig. 7).65 Similarly, the interaction of DNA with increasing concentrations of MSaln complexes in the reaction media can cause increases in the DNA viscosity, i.e. increased DNA–MSaln complexes binding to intercalation sites in DNA.67
 | ||
| Fig. 7 The effect of MSaln complexes amounts on the CT-DNA relative viscosity at [DNA] = 0.5 mM and 25 °C. | ||
From Fig. 7, the distinction between the reacted MSaln complexes depends on the type of M2+ ion. UO2Saln complex shows the highest increase in the viscosity for a given increase in concentration. This means that UO2Saln complex forms the strongest complex with DNA in our studied series of MSaln complexes. The order of the viscosity measurements of the studied MSaln complexes were: UO2Saln > MnSaln > MoO2Saln > VOSaln > VOSaln-Ph complex. This indicates that the UO2Saln complex could be binding to DNA via intercalation and coordinated water replacement binding, as shown in Scheme 2.
 | ||
| Scheme 2 Type of interaction of DNA–UO2Saln complex via intercalation and/or coordinated water replacement bindings. | ||
2.3.2.3. Gel electrophoresis. Another important tool to probe the DNA–MSaln complexes is the gel electrophoresis.24 When comparing the DNA gels before and after mixing of DNA with MSaln complexes, it could be seen that the staining intensity of the gel was slightly reduced for all instances when the DNA was mixed with the MSaln complexes. With UO2Saln and MnSaln complexes, in particular, the DNA staining intensity disappeared, possibly due to strong DNA cleavage14 (Fig. 8). Therefore, it is possible that the effects of these complexes on the pathogenic organism growth could be attributed to the genomic interaction of the current MSaln complexes.
 | ||
| Fig. 8 The interaction of the studied reagents with CT-DNA was studied by agarose gel electrophoresis; where lane 1: DNA ladder; lane 2: CT-DNA + VOSaln-Ph; lane 3: CT- DNA + VOSaln; lane 4: CT-DNA + UO2Saln; lane 5: CT-DNA + MnSaln; lane 6: CT-DNA + MoO2Saln. | ||
 | ||
| Fig. 9 IC50 values of HSaln ligand and MSaln complexes against human colon carcinoma cells (HCT-116 cell line), hepatic cellular carcinoma cells (HepG-2) and breast carcinoma cells (MCF-7) cell line. | ||
| Compound | kb | S | Econf. |
|---|---|---|---|
| HSaln ligand | 1.09 | −2.2441 | −100.1223 |
| VOSaln | 2.67 | −4.1794 | −247.6790 |
| VOSaln-Ph | 2.05 | −4.0727 | −206.5358 |
| MnSaln | 4.33 | −4.4996 | −794.3703 |
| MoO2Saln | 3.91 | −4.3615 | −551.9431 |
| UO2Saln | 4.76 | −5.1609 | −975.1266 |
 | ||
| Fig. 10 Molecular docking results of HSaln ligand and its MSaln complexes. | ||
The molecular docking studies showed that the p-polar substituent (p-sodium sulfonate group) of chelating ligand in HSaln ligand had no feasibility in binding between DNA and HSaln ligand or MSaln complexes (Fig. 10), due to their lipophobic characters. Furthermore, the functional groups of the phenolic or carboxylic hydroxyl group in HSaln ligand are seemed to be the most reactive in binding with the DNA. For the VOSaln-Ph complex, the π-hydrogen interaction could be observed due to the presence of coordinated 1,10-phenanthroline moiety, with lipophilic character.
 | ||
| Scheme 3 C–C cross-coupling system of phenylboronic acid and 2-bromopyridine catalyzed by MSaln complexes. | ||
After optimizing the reaction condition, all catalysts were tested under the same reaction condition. When the metal-complex catalyst was excluded from the reaction mixture no cross-coupling product was observed. The higher catalytic activity of the MnSaln complex could be resulted from the easily reduction of Mn2+ to Mn0 in the catalytic cycle.73 The higher stability of high valent metal complexes could resist the reduction step in order to prepare the active catalyst of the low oxidation state in the catalytic cycle.38,74 Although, Mn-complexes presented in high oxidation state Mn(V)-Salen as an effective catalyst for polymerization of furan derivatives awarding poly(silylether)s,75 the high valent M-complexes (UO2Saln, MoO2Saln, VOSaln and VOSaln-Ph complexes) as catalysts for such coupling systems did not promote the catalytic process. Most probably the low efficiency of UO2Saln, MoO2Saln, VOSaln and VOSaln-Ph complexes could be due to the doubly bonded oxygen to the metal ion (Mo6+, U6+ and V4+ ion), forming the high stable oxidation state of those metal ions, preventing its reduction to lower oxidation state in such cross-coupling mechanisms.40,76
As shown in Table 10, by using ionic liquids, the yield of the desired product was significantly improved in contrast to that in water catalyzed by MnSaln complex catalyst (entries 1, 3, 5 and 7, Table 9). Consequently, by using the mixture of ionic liquid with water also helped to increase the percentages yield of the C–C product (entries 2, 4, 6 and 8) due to the considered acceleration effect on such cross-couplings,47,77 by enhancing the solubility of the polar inorganic compounds and the substantial effect of the cations and anions on the ionic liquid, as reported elsewhere.47,54,77
| Entrya | Ionic liquid | Yield (%)b |
|---|---|---|
| a Phenylboronic acid (1.0 mmol), 2-bromopyridine (1.1 mmol), base (K2CO3, 2.0 mmol) and catalyst (0.10 mmol) in 10 mL solvent or 6.7 mL solvent:3.3 mL H2O (1:1), at 100 °C for 6 hours.b The yield percentages of the C–C product analyzed by GC-MS.c 1-Butyl-3-methylimidazolium bis(trifluoromethylsulfonyl)imide.d 1-Ethyl-3-methylimidazolium bis(trifluoromethylsulfonyl)imide.e 1-Octyl-3-methylimidazolium bis(trifluoromethylsulfonyl)imide.f 1-Butyl-3-methylimidazolium hexafluorophosphate. |
||
| 1 | [bmim][Tf2N]c | 90 |
| 2 | [bmim][Tf2N]:H2O (3:1) |
94 |
| 3 | [emim][Tf2N]d | 87 |
| 4 | [emim][Tf2N]:H2O (3:1) |
91 |
| 5 | [omim][Tf2N]e | 84 |
| 6 | [omim][Tf2N]:H2O (3:1) |
89 |
| 7 | [bmim][PF6]f | 88 |
| 8 | [bmim][PF6]:H2O (3:1) |
90 |
Depending upon the nature of the substrates (electron-donating, and electron-withdrawing group on the aryl halides) the obtained product percentages yield showed variation from moderate to high, (entries 1, 2 and 3, Table 11), with aryl bromide, the yield was promoted, as seen in entries 2, 4–7 (Table 11), whereas, with the other aryl halides, i.e. chloride and iodide, the yield of C–C products was little reduced (entries 1, 3 and 8). When the electron-donating group on aryl bromides was attached, the yield was enhanced (entries 2, 4–6). The o-methyl group on bromobenzene slightly improved the percentage amount to 94% (entry 4),47 whereas, the p-methyl group or the p-methoxy group on bromobenzene showed slight reduction in the yield (90 or 89%) respectively.78 In contrast, the electronic extended conjugation or electron-withdrawing substituent (–NO2) on aryl halide reduced the % yield of the cross-coupling product s (entries 7 and 8).


3. Conclusions
The complexation of the high and low valent metal ions (VO2+, UO22+, MoO22+ and Mn2+ ions) with ONO-tridentate pincer Schiff base salicylidene sodium sulfonate (HSaln ligand) ligand provided water-soluble M-pincer chelates (MSaln complexes = VOSaln, VOSaln-Ph, UO2Saln, MoO2Saln and MnSaln complexes, respectively), which was fully characterized by various spectroscopic tools. Spectrophotometrically, the stability constants were derived by continuous variation method for MSaln complexes, UO2Saln and MoO2Saln are found to be the most stable complexes. Biologically, the antibacterial and antifungal potentials of MSaln complexes showed that UO2Saln and MoO2Saln complexes have the highest activity against some bacterial and fungal strains and the rest showed reasonably good potential. With selected human carcinoma cell lines, the anticancer effects of HSaln ligand and all MSaln complexes manifest high interaction. The interaction between MSaln complexes and CT-DNA with the type of binding was studied by UV-vis spectroscopy, viscosities and gel electrophoresis. All MSaln complexes exhibited good interaction with CT-DNA. The two complexes (UO2Saln and MnSaln complexes) demonstrated strong interaction with CT-DNA. The biological potential of MSaln complexes was studied by the molecular docking to illustrate the active site of the drug and the type of bonding between complex and DNA. As anticancer agents, all MSaln complexes and ligand showed remarkable anti-proliferative potential. The catalytic efficiency of MSaln complexes was studied in Suzuki–Miyaura cross-coupling reaction of phenylboronic acid with 2-bromopyridine in sustainable conditions. The result showed that the MnSaln complex has the highest catalytic potential, providing the highest % yield of the cross-coupling product. Moreover, the catalytic potential of the MnSaln complex was further improved in ionic liquid–aqueous mixtures (3:1). Generally, the biological and catalytic potential of the various MSaln complexes is following a similar trend.
4. Experimental
4.1. Reagents, apparatus and methodology
The starting materials were ordered from Acrös and Fluka, which was used as such for further work. The micro-elemental analyses of HSaln ligand and all MSaln complexes were done by a CHNS machine GMBH VarioEl model V2.3. Electronic transition spectroscopy was executed by a Jasco Ultra Violet-Visible Spectrophotometer V-570 model with 1.0 cm quartz cells in the thermostated holder at 25 °C. NMR spectroscopy was carried out by a FT-NMR multinuclear spectrometer model Bruker ARX400 at 25 °C with 400.1 MHz for 1H-nucleus and 100.6 MHz for 13C-nucleus. Mass spectroscopy was measured by the apparatus Agilent Technology 6310 (Ion Trap LC/MS – 1200 Series). Thermogravimetric analysis was obtained by using Shimadzu TGA-50H thermal analyzer under inert nitrogen atmosphere (with rate 20 cm3 min−1) as carrier gas using rate of heating 10 °C per min for the temperature range from 30 to 400 °C. IR vibrational spectroscopy was measured in the region of 4000–400 cm−1 as KBr pellet using Shimadzu FTIR-8101 Fourier transform infrared spectrophotometer. Conducting features were evaluated in a Jenway conductometer model 4320, supported by an epoxy bodied conductivity cell (two electrodes, shiny) with cell constant calibration from 0.01 to 19.99 at 25 °C. Magnetic measurements were achieved by a Gouy's balance with diamagnetic correction by Pascal's constants and mercury(II) hexacyanocobaltate, as a calibrating agent, at 25 °C.4.2. Synthesis
:1 mixture of methanol–water provided 69, 74, 76 and 72% yield of VOSaln, MoO2Saln, MnSaln and UO2Saln complexes, respectively.N) (Fig. S5 and S6†).13C NMR (100 MHz, DMSO-d6, Dept-135): δ 116.55 (CH), 116.83 (CH), 119.82 (CH), 120.07 (Cq), 126.86 (CH), 129.74 (CH), 131.53 (Cq), 141.06 (Cq), 147.07 (CH), 156.74 (CH), 157.73 (Cq), 162.84 (Cq), 163.41 (CH, CHN) and 169.92 ppm (Cq, CO).
UO2Saln, 1H NMR (DMSO-d6, 400 MHz): δ 2.43 (s, 2H, H2O), 6.98 (d, 3J = 8.0 Hz, 1H), 7.20 (d, 3J = 8.0 Hz, 1H), 7.40 (t, 3J = 8.0 Hz, 1H), 7.59 (t, 3J = 8.0 Hz, 1H), 7.81 (d, 3J = 8.0 Hz, 1H), 8.02 (s, 1H), 8.19 (d, 3J = 8.0 Hz, 1H) and 9.34 ppm (s, 1H, CHN) (Fig. S7–S9†).
13C NMR (100 MHz, DMSO-d6, Dept-135): δ 110.23 (CH), 117.03 (CH), 121.52 (CH), 126.95 (CH), 131.55 (Cq), 132.73 (Cq), 134.25 (CH), 151.57 (Cq), 155.57 (Cq), 161.20 (CH, CHN) and 174.11 ppm (Cq, CO).
:1 mixture of methanol–water.4.3. Stability constants of the prepared MSaln complexes
All MSaln complexes were synthesized by the reaction of equimolar ratios of the metal ion and HSaln ligand. This could be determined by the continuous variation method,20 which is helpful to deduce the MSaln complexes stability constants Kf at various applied temperatures (20, 25, 30, 35 and 40 °C),41 by using eqn (1):
 | (1) |
The Gibb's free energy (ΔfG) of all MSaln complexes was calculated according to eqn (2), and the thermodynamic parameters, ΔfH and ΔfS, were deduced from the Gibb's–Helmholtz equation as function reciprocal of T in kelvin:
|
ΔfG = −RTlnKf
| (2) |
4.4. Antibacterial investigations
HSaln ligand and its corresponding M-chelates were examined as antibacterial reagents. Using DMSO (dimethylsulfoxide) as a solvent and the agar well dilution method,14 three different bacterial strains, Serratia marcescens (−ve), Escherichia coli (−ve) and Staphylococcus aureus (+ve) using were evaluated. The various bacterial strains were grown on nutrient agar in sterile Petri plates at room temperature. In holes created by using a sterile cork borer, a sterile paper saturated with a solution (10 and 20 μg mL−1) of HSaln ligand or its MSaln complexes was placed. The resultant plates were incubated for 1 day at 37 °C.14 Gentamycin, was used as a positive control. There was no antibacterial potential of the DMSO alone.4.5. Antifungal investigations
By applying the well diffusion method, HSaln ligand and its MSaln complexes were studied as antifungal reagents versus three fungal strains, Candida albicans, Aspergillus flavus and Trichophyton rubrum, under the environment of potato dextrose agar.24 From the infected areas of the host plant, the applied fungal species were extracted, mixed with potato dextrose agar and poured in Petri dishes. Using DMSO as a solvent, the compounds (10 and 20 μg mL−1) were applied to the Petri dishes. The resultant plates were then incubated for 72 hours at 35 °C. Fluconazole was used as a positive control.4.6. Minimal inhibitory concentration (MIC) and activity index (A), of antimicrobial potential
To determine the MIC, a range of compound concentrations were tested. The zone of inhibition (in mm) of the investigated metal complexes was compared with available standard drugs. The MIC is defined as the smallest concentration of the compound that inhibits the growth of the microorganisms.The activity index (A), is calculated from eqn (3):24,25
 | (3) |
4.7. Interaction of CT-DNA with MSaln chelates
A stock solution of CT-DNA was prepared by mixing Tris–HCl (5 mM) and NaCl (50 mM) in deionized water (pH = 7.5). The UV absorbance of the DNA stock solution was measured at 260 nm and its molar absorption coefficient calculated (6600 mol−1 cm−1). The electronic absorbance ratio (A260/A280) of the stock DNA solution was 1.83 (almost between 1.8–1.9) indicating that there was no protein contamination of the prepared CT-DNA solution.25 The DNA stock solution was stored at 4 °C and used for 4 days only. The ethidium bromide (EB) concentration was evaluated at 480 nm (ε = 5860 mol−1 cm−1). The interaction-binding experiments were performed with 10−3 M Tris-buffer (Tris–HCl (5 mM) and NaCl (50 mM) in Tris-buffer with pH = 7.5). Solutions of MSaln complexes were prepared in fresh DMSO (VOSaln, VOSaln-Ph, UO2Saln, MnSaln and MoO2Saln).
 | (4) |
|
ΔG≠b = RTlnKb
| (5) |
The type and magnitude of the chromism could be established based on eqn (6):
 | (6) |
 | (7) |
 | (8) |
:1) and then charged to the electrophoresis chamber wells parallel to a sample of the standard DNA marker in TBE buffer (50 mM Tris-base in pH 7.2 with 1 mM EDTA/1.0 l). The gel was run using 60 V for approximately 45 min.The agarose gel was prepared by dissolving 600.0 mg of agarose in 60.0 mL of hot Tris-acetate-EDTA buffer (TAE) (4.84 g Tris-base, pH 8.0 and 0.5 M EDTA L−1). The obtained solution was boiled for a few minutes. After cooling, the solution was poured into a fitted gas cassette with the comb. The gel was allowed to cool gradually to room temperature until to be solid. The solid gel was placed in the electrophoresis chamber containing TAE buffer. The agarose gel was imagined and photographed in genius 3 Panasonic DMC-LZ5 Lumix DNA gel documentation system.
4.8. Anticancer potential
The anticancer potential of HSaln ligand and its MSaln complexes was examined at Cancer Biology Department, Pharmacology Department, Cairo University and the National Cancer Institute. Anti-cancer potential was tested against a HepG2 cell line (hepatocellular carcinoma), a MCF7 cell line (breast carcinoma) and an HCT-116 cell line (colon carcinoma), spectroscopically, the absorbance of each current compound was determined with an ELISA microplate reader (Meter tech. Σ 960, “USA”) at 564 nm. The anticancer potential was visualized in vitro using the Sulfo-Rhodamine-B-stain (SRB).25 To this end, a solution of HSaln ligand or MSaln complexes in DMSO (various concentrations 0, 1.0, 2.5, 5.0 and 10.0 μg μL−1) was poured dropwisely into a 96-multiwell plate, that contained a mono-layer of the cancer cells (104 cells per well). The plate was then incubated at 37 °C for 48 h under inert atmosphere carbon dioxide (5%). After the addition of Sulfo-Rhodamine-B-stain (SRB), the plate was fixed. Excess stain was removed by acetic acid and then mixed with Tris–EDTA buffer. An ELISA plate reader was used to determine the color intensity. The inhibitory concentration (IC50) was deduced by applying eqn (9):25
 | (9) |
4.9. Molecular docking
Dell Precision™ T3600 Workstation Intel Xeon E5-1660 3.3 GHz, 16 GB 1600 MHz DDR3, ECC RDIMM 1 TB (7200 RPM), 1 GB NVIDIA Quadro 2000, Windows 10 Professional (64 Bit) was applied in order to investigate the current compounds molecular docking (HSaln ligand and all MSaln complexes) with using Molecular Operating Environment (MOE) package version 2018.01. X-ray analysis of a B-DNA dodecameric d(CGCG AATTCGCG)2 crystal structure within 3′–5′direction (DNA code: 1BNA) was applied in order to examine the docking at a resolution of 1.9 Å. By importing the molecular structure of DNA with its H atoms into MOE, the optimization energy could be calculated. The obtained structural model was submitted to the systematic conformation search within a gradient of RMS of 0.01 kcal mol−1 with negligible parameters in the Site Finder tool embedded in MOE. By means of ChemBio Draw Ultra 12.0, all HSaln ligand and its MSaln complexes were drawn. For calculating the parameters of the investigated compounds using molecular docking following changes were done: (1) adding the hydrogen atoms; (2) applying the conformational search for all HSaln ligand and its MSaln complexes; (3) MMFF94 force field, the best conformers obtained showed an energy decrease.79 Energy reduction with the steepest algorithm was exercised, after which the conjugate gradient method was applied until an RMS gradient reached 0.00001 kcal mol−1 Å−1. In MOE 2016.08, the standard molecular docking was exercised. The Alpha Triangle placement that derives poses by random superposition of HSaln ligand atoms triplets alpha sphere dummies in the target site was used to detect the poses. The London dG scoring function elucidated the free binding energy of the ligand from a given pose. The best poses of the docked molecules were estimated by at least 50 cycles of calculation. The obtained molecular dock file was created with different poses for HSaln ligand and its MSaln complexes with rearrangement with the final score function (S). The score of the last stage (S) is that was not set to none. To investigate the different poses, the browser of resulted database was selected for the best.4.10. Catalytic processes
Suzuki–Miyaura cross-coupling processes were carried out in two necked round bottom flask (100 mL) with water circulatory glass condenser, loaded with phenylboronic acid (1.0 mmol) in 10 mL H2O, 2.1 mmol of potassium carbonate and charged with 0.10 mmol of MSaln complexes catalyst (VOSaln, VOSaln-Ph, MnSaln, MoO2Saln or UO2Saln). The reaction was initiated by the addition of 1.2 mmol of 2-bromopyridine and the reaction mixture was heated under reflux conditions at 110 °C for 6 hours in a thermostated oil bath.The cross-coupling product was extracted by diethyl ether (30 mL) and dried by anhydrous magnesium sulfate and further diluted with 10 mL of diethyl ether to make a dilute sample for GC-MS analysis. The yield (in percentages) of C–C products were resolved with Shimadzu Gas Chromatography Mass Spectrometer (GC-MS) model QP2010 SE, with Rxi-5 Sil MS capillary column (30 m length × 0.25 mm ID × 025 μm film thickness). The sample was injected into the GC-MS system at 25 °C. The GC oven temperature was initiated at 40 °C and fixed for 60 seconds. The rate of the temperature with 10 °C min−1 was increased up to 200 °C. The operation of the inlet was carried out in the mode of splitless at 200 °C, which was the mass spectra temperature of the transfer line. The carrier gas was pure helium (99.999%), which flowed with rate of 1 mL min−1. Lab solution software was applied to analyze the yield percentages of the obtained products.
Conflicts of interest
There is no conflict of interest in this manuscript.Acknowledgements
This work was supported by the Deanship of Scientific Research at King Faisal University, Al Ahsa, through a Nasher Track (No. 186121).References
- P. A. Vigato and S. Tamburini, Coord. Chem. Rev., 2004, 248, 1717 CrossRef CAS.
- R. M. Clarke and T. Storr, Dalton Trans., 2014, 43, 9380 RSC.
- A. F. Shoair, A. R. El-Shobaky and H. R. Abo-Yassin, J. Mol. Liq., 2013, 66, 687 Search PubMed.
- L. H. Abdel-Rahman, A. M. Abu-Dief, H. Mostafa and S. K. Hamdan, Appl. Organomet. Chem., 2017, 31, e3555 CrossRef.
- L. H. Abdel-Rahman, A. M. Abu-Dief, M. R. Shehata, F. M. Atlam and A. A. H. Abdel-Mawgoud, Appl. Organomet. Chem., 2019, e4699 CrossRef.
- A. Lehwess-Litzmann, P. Neumann, C. Parthier, S. Lüdtke, R. Golbik, R. Ficner and K. Tittmann, Nat. Chem. Biol., 2011, 7, 678 CrossRef CAS.
- X. Liu, C. Manzur, N. Novoa, S. Celedón, D. Carrillo and J.-R. Hamon, Coord. Chem. Rev., 2018, 357, 144 CrossRef CAS.
- P. Adaeo, M. L. Kuznetsov, S. Barroso, A. M. Martins, F. Avecilla and J. C. Pessoa, Inorg. Chem., 2012, 51, 11430 CrossRef.
- D. Gong, B. Wang, X. Jia and X. Zhang, Dalton Trans., 2014, 43, 4169 RSC.
- P. Das and W. Linert, Coord. Chem. Rev., 2016, 311, 1 CrossRef CAS.
- Z. Beigi, A. H. Kianfar, H. Farrokhpour, M. Roushani, M. H. Azarian and W. A. K. Mahmood, J. Mol. Liq., 2018, 249, 117 CrossRef CAS.
- W. Al Zoubi and N. Al Mohanna, Spectrochim. Acta, Part A, 2014, 132, 854 CrossRef CAS.
- A. W. Jeevadason, K. K. Murugavel and M. A. Neelakantan, Renewable Sustainable Energy Rev., 2014, 36, 220 CrossRef.
- M. S. S. Adam and H. Elsawy, J. Photochem. Photobiol., B, 2018, 184, 34 CrossRef CAS PubMed.
- I. Correia, S. Roy, C. P. Matos, S. Borovic, N. Butenko, I. Cavaco, F. Marques, J. Lorenzo, A. Rodríguez, V. Morenoe and J. C. Pessoa, J. Inorg. Biochem., 2015, 147, 134 CrossRef CAS.
- L. Krivosudský, P. Schwendt, R. Gyepes and Z. Zák, Polyhedron, 2014, 81, 421 CrossRef.
- L. Krivosudský, P. Schwendt, J. Šimunek and R. Gyepes, J. Inorg. Biochem., 2015, 147, 65 CrossRef PubMed.
- J. C. Pessoa, J. Inorg. Biochem., 2015, 147, 4 CrossRef.
- L. Lu, J. Yue, C. Yuan, M. Zhu, H. Han, Z. Liu and M. Guo, J. Inorg. Biochem., 2011, 105, 1323 CrossRef CAS PubMed.
- M. S. S. Adam, M. M. Youssef, M. F. Abo Elghar, A. M. Hafez and U. El-Ayaan, Appl. Organomet. Chem., 2017, 31, e3650 CrossRef.
- Z. Kazemi, H. A. Rudbari, M. Sahihi, V. Mirkhani, M. Moghadam, S. Tangestaninejad, I. Mohammadpoor-Baltork and S. Gharaghani, J. Photochem. Photobiol., B, 2016, 162, 448 CrossRef CAS PubMed.
- A. Rauf, A. Shah, A. A. Khan, A. H. Shah, R. Abbasi, I. Z. Qureshi and S. Ali, Spectrochim. Acta, Part A, 2017, 176, 155 CrossRef CAS.
- A. K. Saini, P. Kumari, V. Sharma, P. Mathur and S. M. Mobin, Dalton Trans., 2016, 45, 19096 RSC.
- (a) L. H. Abdel-Rahman, R. M. El-Khatib, L. A. E. Nassr, A. M. Abu-Dief and M. Ismael, Spectrochim. Acta, Part A, 2014, 117, 366 CrossRef CAS; (b) L. H. Abdel-Rahman, A. M. Abu-Dief, M. Ismael, M. A. A. Mohamed and N. A. Hashem, J. Mol. Struct., 2016, 1103, 232 CrossRef CAS; (c) L. H. Abdel-Rahman, N. M. Ismail, M. Ismael, A. M. Abu-Dief and E. A. Ahmed, J. Mol. Struct., 2017, 1134, 851 CrossRef CAS.
- (a) L. H. Abdel-Rahman, A. M. Abu-Dief, R. M. El-Khatib and S. M. Abdel-Fatah, Bioorg. Chem., 2016, 69, 140 CrossRef CAS; (b) A. M. Abu-Dief, I. F. Nassar and W. H. Elsayed, Appl. Organomet. Chem., 2016, 30, 917 CrossRef CAS; (c) L. H. Abdel-Rahman, A. M. Abu-Dief, M. O. Aboelez and A. A. H. Abdel-Mawgoud, J. Photochem. Photobiol., B, 2017, 170, 271 CrossRef CAS; (d) L. H. Abdel-Rahman, M. S. S. Adam, A. M. Abu Dief, H. Moustafa, M. T. Basha, A. S. Aboraia and H. E. Ahmed, Appl. Organomet. Chem., 2018, 32, e4527 CrossRef.
- S. Shahzadi, S. Ali, S. K. Sharma and K. Qanungo, J. Iran. Chem. Soc., 2010, 7, 419 CrossRef CAS.
- H. F. Abd El-Halim, G. G. Mohamed and E. A. M. Khalil, J. Mol. Struct., 2017, 1146, 153 CrossRef CAS.
- Y.-T. Liu, J. Sheng, D.-W. Yin, H. Xin, X.-M. Yang, Q.-Y. Qiao and Z.-J. Yang, J. Organomet. Chem., 2018, 856, 27 CrossRef CAS.
- C. M. Sharaby, M. F. Amine and A. A. Hamed, J. Mol. Struct., 2017, 1134, 208 CrossRef CAS.
- W. H. Mahmoud, N. F. Mahmoud and G. G. Mohamed, Appl. Organomet. Chem., 2017, 31, e3858 CrossRef.
- W. H. Mahmoud, R. G. Deghadi, M. M. I. El Desssouky and G. G. Mohamed, Appl. Organomet. Chem., 2018, 32, e4556 Search PubMed.
- W. H. Mahmoud, M. M. Omar, F. N. Sayed and G. G. Mohamed, Appl. Organomet. Chem., 2018, 32, e4386 CrossRef.
- W. H. Mahmoud, R. G. Deghadi and G. G. Mohamed, Res. Chem. Intermed., 2016, 42, 7869 CrossRef CAS.
- R. Rasool and S. Hasnain, Spectrochim. Acta, Part A, 2015, 148, 435 CrossRef CAS.
- A. A. M. Belal, I. M. El-Deen, N. Y. Farid, R. Zakaria and M. S. Refat, Spectrochim. Acta, Part A, 2015, 149, 771 CrossRef CAS PubMed.
- E. M. Zayed, A. M. M. Hindy and G. G. Mohamed, Appl. Organomet. Chem., 2018, 32, e3952 CrossRef.
- E. M. Zayed, A. M. M. Hindy and G. G. Mohamed, Appl. Organomet. Chem., 2018, 32, e4525 Search PubMed.
- E. M. Zayed, G. G. Mohamed, W. M. I. Hassan, A. K. Elkholy and H. Moustafa, Appl. Organomet. Chem., 2018, 32, e4375 CrossRef.
- E. M. Zayed, M. A. Zayed, A. M. M. Hindy and G. G. Mohamed, Appl. Organomet. Chem., 2018, 32, e4603 CrossRef.
- F.-S. Han, Chem. Soc. Rev., 2013, 42, 5270 RSC.
- H. M. Abd El-Lateef, M. S. S. Adam and M. M. Khalaf, J. Taiwan Inst. Chem. Eng., 2018, 88, 286 CrossRef CAS.
- (a) M. S. S. Adam and A. D. M. Mohamad, Polyhedron, 2018, 151, 118 CrossRef CAS; (b) M. S. S. Adam, M. A. Al-Omair and F. Ullah, Res. Chem. Intermed., 2019, 45, 4653 CrossRef CAS.
- G. Scalese, J. Benítez, S. Rostán, I. Correia, L. Bradforda, M. Vieites, L. Minini, A. Merlino, E. L. Coitiño, E. Birriel, J. Varela, H. Cerecetto, M. González, J. C. Pessoa and D. Gambino, J. Inorg. Biochem., 2015, 147, 116 CrossRef CAS.
- S. G. Rull, I. Funes-Ardoiz, C. Maya, F. Maseras, M. R. Fructos, T. R. Belderrain and M. C. Nicasio, ACS Catal., 2018, 8, 3733 CrossRef CAS.
- P. K. Suganthy, R. N. Prabhu and V. S. Sridevi, Inorg. Chim. Acta, 2016, 449, 127 CrossRef CAS.
- (a) A. A. Abdel Aziz, A. N. M. Salem, M. A. Sayed and M. M. Aboaly, J. Mol. Struct., 2012, 1010, 130 CrossRef CAS; (b) L. M. Kumar and B. R. Bhat, J. Organomet. Chem., 2017, 827, 41 CrossRef CAS.
- M. Wang, X. Yuan, H. Li, L. Ren, Z. Sun, Y. Hou and W. Chu, Catal. Commun., 2015, 58, 154 CrossRef CAS.
- H. Choudhary, P. Berton, G. Gurau, A. S. Myerson and R. D. Rogers, Chem. Commun., 2018, 54, 2056 RSC.
- S. Doherty, J. G. Knight, T. Backhouse, E. Abood, H. Alshaikh, A. R. Clemmet, J. R. Ellison, R. A. Bourne, T. W. Chamberlain, R. Stones, N. J. Warren, I. J. S. Fairlamb and K. R. J. Lovelock, Adv. Synth. Catal., 2018, 360, 3716 CrossRef CAS.
- L. Li, J. Wang, T. Wu and R. Wang, Chem.–Eur. J., 2012, 18, 7842 CrossRef CAS.
- S. More, S. Jadhav, R. Salunkhe and A. Kumbhar, Mol. Catal., 2017, 442, 126 CrossRef CAS.
- Y. Gu, I. Favier, C. Pradel, D. L. Gin, J.-F. Lahitte, R. D. Noble, M. Gómez and J.-C. Remigy, J. Membr. Sci., 2015, 492, 331 CrossRef CAS.
- J. D. Patil, S. N. Korade, S. A. Patil, D. S. Gaikwad and D. M. Pore, RSC Adv., 2015, 5, 79061 RSC.
- R. Wang, B. Twamle and J. B. Shreeve, J. Org. Chem., 2006, 71, 426 CrossRef CAS.
- (a) M. S. S. Adam, A. D. Mohamad and O. M. El-Hady, Monatsh. Chem., 2014, 145, 435 CrossRef CAS; (b) I. Mohammed-Ziegler, Spectrochim. Acta, Part A, 2003, 59, 19 CrossRef.
- Y.-Z. Cao, H.-Y. Zhao, F.-Y. Bai, Y.-H. Xing, D.-M. Wei, S.-Y. Niu and Z. Shi, Inorg. Chim. Acta, 2011, 368, 223 CrossRef CAS.
- R. J. P. Williams, J. Phys. Chem., 1954, 58, 121 CrossRef CAS.
- A. Einstein, B. Podolsky and N. Rosen, Phys. Rev., 1953, 47, 777 CrossRef.
- R. Ramesh and S. J. Maheswaran, J. Inorg. Biochem., 2003, 96, 457 CrossRef CAS.
- N. Pravin and N. Raman, Inorg. Chem. Commun., 2013, 36, 45 CrossRef CAS.
- M. S. S. Adam, Monatsh. Chem., 2015, 146, 1823 CrossRef CAS.
- U. K. Das, Y. Ben-David, G. Leitus, Y. Diskin-Posner and D. Milstein, ACS Catal., 2019, 9, 479 CrossRef CAS.
- L. H. Abdel-Rahman, A. M. Abu-Dief, E. F. Newair and S. K. Hamdan, J. Photochem. Photobiol., B, 2016, 160, 18 CrossRef CAS.
- P. Jayaseelan, E. Akila, M. U. Rani and R. Rajavel, J. Saudi Chem. Soc., 2016, 26, 625 CrossRef.
- L. H. Abdel-Rahman, A. M. Abu-Dief, M. Basha and A. A. H. Abdel-Mawgoud, Appl. Organomet. Chem., 2017, 31, e3750 CrossRef.
- U. Jash, G. Chakraborty, S. Sinha, R. Sikari, R. Mondal and N. D. Paul, Asian J. Org. Chem., 2018, 7, 1681 CrossRef CAS.
- K. Y. El-Baradie, N. A. El-Wakiel and H. A. El-Ghamry, Appl. Organomet. Chem., 2015, 29, 117 CrossRef CAS.
- L. H. Abdel-Rahman, A. M. Abu-Dief, R. M. El-Khatib and S. M. Abdel-Fatah, J. Photochem. Photobiol., B, 2016, 162, 298 CrossRef CAS PubMed.
- V. Ramakrishna and N. D. Reddy, Dalton Trans., 2017, 46, 8598 RSC.
- F. Kong, C. Zhou, J. Wang, Z. Yu and R. Wang, ChemPlusChem, 2013, 78, 1 CrossRef.
- E. L. Kolychev, A. F. Asachenko, P. B. Dzhevakov, A. A. Bush, V. V. Shuntikov, V. N. Khrustalevc and M. S. Nechaev, Dalton Trans., 2013, 42, 6859 RSC.
- S. Fortun, P. Beauclair and A. R. Schmitzer, RSC Adv., 2017, 7, 21036 RSC.
- R. Dakarapu and J. R. Falck, J. Org. Chem., 2018, 83, 1241 CrossRef CAS.
- J. M. Neely, M. J. Bezdek and P. J. Chirik, ACS Cent. Sci., 2016, 2, 935 CrossRef CAS PubMed.
- S. Vijjamarri, S. Streed, E. M. Serum, M. P. Sibi and G. Du, ACS Sustainable Chem. Eng., 2018, 6, 2491 CrossRef CAS.
- (a) L.-X. You, H.-J. Liu, L.-X. Cui, F. Ding, G. Xiong, S.-J. Wang, B.-Y. Ren, I. Dragutan, V. Dragutan and Y.-G. Sun, Dalton Trans., 2016, 45, 18455 RSC; (b) R. Dakarapu and J. R. Falck, J. Org. Chem., 2018, 83, 1241 CrossRef CAS.
- (a) H. Valdés, M. A. García-Eleno, D. Canseco-Gonzalez and D. Morales-Morales, ChemCatChem, 2018, 10, 3136–3172 CrossRef; (b) H. Valdés, L. González-Sebastián and D. Morales-Morales, J. Organomet. Chem., 2017, 845, 229–257 CrossRef; (c) M. Asay and D. Morales-Morales, Dalton Trans., 2015, 44, 17432–17447 RSC.
- M. Mastalir, E. Pittenauer, B. Stöger, G. Allmaier and K. Kirchner, Org. Lett., 2017, 19, 2178 CrossRef CAS.
- T. A. Halgren, J. Comput. Chem., 1996, 17, 490 CrossRef CAS.
Footnote |
| † Electronic supplementary information (ESI) available. See DOI: 10.1039/c9ra06816c |
| This journal is © The Royal Society of Chemistry 2019 |