DOI:
10.1039/C9RA06758B
(Paper)
RSC Adv., 2019,
9, 38298-38308
Highly sensitive and specific screening of EGFR mutation using a PNA microarray-based fluorometric assay based on rolling circle amplification and graphene oxide†
Received
27th August 2019
, Accepted 16th November 2019
First published on 22nd November 2019
Abstract
Screening epidermal growth factor receptor (EGFR) mutations, especially deletions, is essential for diagnosis of non-small cell lung cancer (NSCLC) and also critical to inform treatment decisions for NSCLC patients. Here, we demonstrated a facile peptide nucleic acid (PNA) microarray-based fluorometric method for sensitive and specific detection of EGFR mutation, using rolling circle amplification (RCA), graphene oxide (GO), and a fluorescently-labeled detection probe (F-DP). First, the EGFR gene sequence was efficiently captured by the label-free PNA probe which was attached on the surface of a 96-well plate. And then, the EGFR mutation sequence was specifically amplified by RCA using the circular DNA, which was formed by the ligation of the padlock probe when hybridizing with the EGFR mutation, as a template. The single-stranded RCA product (RCAP) was then sensitively detected with the F-DP and GO system. This method has a detection limit of 0.3 pM for EGFR mutation and a high discrimination capability to target EGFR mutation against EGFR wildtype. The use of a PNA microarray and a fluorescence quenching platform make this system quite suitable for high-throughput analysis of EGFR mutations in resource-limited settings without the need of costly and cumbersome equipment. Furthermore, this detection system provides a novel way for the diagnosis of other diseases that are caused by gene deletion mutations.
1. Introduction
Epidermal growth factor receptor (EGFR), a membrane protein, plays a central role in transmitting signals that promote cell growth and proliferation.1 The tyrosine kinase (TK) domain of EGFR activates several downstream effectors that lead to activation of the Ras-Raf-MAPK pathway.2 Overexpression and oncogenic mutations that constitutively activate the TK domain of EGFR have been found in various solid tumors, especially in non-small cell lung cancer (NSCLC).3,4 EGFR mutations, including deletions in exon 19 which have 12 to 23 base pairs missing, are defined to aid in identifying patients with NSCLC.5 And, identifying EGFR mutations is also critical to inform treatment decisions for NSCLC patients.6–11 So, a rapid, economic screening method for sensitive and accurate detection of EGFR mutations is very essential for clinical diagnosis. However, current detection methods for EGFR mutations are either based on polymerase chain reaction (PCR) or gene sequencing technology, such as the Cobas® EGFR Mutation Test v2 (P120019/S007),12 which was approved by the Food and Drug Administration (FDA) for the qualitative detection of defined EGFR mutations in DNAs derived from formalin-fixed paraffin-embedded tumor tissue (FFPET) from NSCLC patients.13 In this system, more than 29 reporter probes are required to detect deletions in exon 19,14 though it is seems quite comprehensive, it is complicated in operation and expensive in purchasing reagent and the system. The standard RT-PCR and droplet digital PCR technology are commonly used for detecting EGFR mutations especially the deletions mixed with EGFR wildtype gene in circulating free DNA (cfDNA) from the NSCLC patients' plasma or tissue. However, these approaches suffer from low sensitivity or poor specificity, and labor-intensive steps.15,16 The unique characteristics of EGFR mutations, including the different base deletions, low abundance, and sequence homology among the EGFR wildtype gene, also make them difficult to analyze. Additionally, the time, expense and complexity of these methods are of impractical for resource-limited settings. To overcome these shortcomings, selective sandwich-type electrochemical biosensors have been developed to detect in-frame deletions in exon 19 of EGFR.17,18 These biosensors overcome some disadvantages of traditional sequencing assay attributing to their time-saving, low-cost, high selectivity as well as simple and convenient operation, but the requirement of a carefully prepared electrode and the relatively poor sensitivity were still critical for the method. Therefore, a simple, rapid, efficient, and cost-effective method for high-throughput screening the deletions of EGFR mutations from NSCLC patients would be still valuable for clinical diagnosis.
Microarray, a high-throughput technology for gene expression analysis, is widely used in biological and biomedical research nowadays. Due to its rapidity, cost effectiveness and massively parallel nature, microarray assays are the best choice to translate the vast base information into a set of miniaturized assays for clinical applications. However, the utility of current microarray formats for detection of rare targets has been seriously restricted by its sensitivity. It has been reported that an on-chip signal amplification method, rolling circle amplification (RCA), could improve the assay sensitivity and specificity, while retaining spatial multiplexing.19 RCA is an isothermal, enzymatic process mediated by certain DNA polymerases in which long single-stranded DNA (ssDNA) molecules are synthesized on a short circular ssDNA template by using a single DNA primer.20–24 Owing to its simplicity and high sensitivity and specificity, RCA was explored as an important technique for ultrasensitive DNA, RNA, and protein detection in diagnostic genomics and proteomics.25–33 Furthermore, the elimination of the costly and cumbersome equipment for temperature recycling, RCA is adaptable to numerous detection platforms (such as microarrays) and is suitable for parallel or high-throughput analysis.34–40
However, to date, DNA oligonucleotide microarrays still cannot deal with samples of such complexity, due to its low binding stability, low sequence selectivity and easy degradation by nucleases. The application of peptide nucleic acids (PNAs) as arrayed probe molecules may offer an alternative with superior performance.41,42 PNA oligomers are synthetic DNA mimics with a non natural polyamide backbone that offer several advantages over DNA.43 They are extremely stable in acidic environments and resistant to degradation by nucleases and proteases.44 PNA can hybridize to negatively charged DNA or RNA specifically through Watson–Crick base pairing under low salt concentration. PNA hybrids have higher thermal stability and are less tolerant to mismatched base pairs, which allows the use of short PNA oligomers.45–48 As a consequence, the target DNA has less secondary structure and is more accessible to the probe molecules.
Owing to these properties, in this study, we report on the development of a microarray-based profiling method to detect deletions in EGFR exon 19 that uses a label-free PNA probe to capture target EGFR gene sequence and RCA to amplify the EGFR mutation sequence in combined with a padlock probe. The single-stranded RCA product (RCAP) was then sensitively detected with fluorescently labeled detection probe (F-DP) and graphene oxide (GO) system, which is an efficient nucleic acids sensing platform based on the different fluorescence quenching effect of GO to fluorescently labeled single- and double-stranded nucleic acids.49–54 This method can achieve detection at femtomolar concentrations and ultrahigh mutation discrimination against EGFR wildtype. Capturing EGFR sequences using short (11 nt) PNA probe allows the use of unpurified samples and it offers an extremely simple and reliable way to profile EGFR mutations without the need of chemical modification for profiling. When properly executed, this strategy could also be used for multiplex nucleic acids detection because various labels can be introduced to the F-DP.
2. Experimental section
2.1. Materials
The DNA oligonucleotides used in this study (EGFR wildtype, EGFR mutation, padlock probe, primer, F-DP and random DNA are shown in Table 1) were chemically synthesized by Jie Li Biology Inc. (Shanghai, China) and purified by HPLC and polyacrylamide gel electrophoresis (PAGE). The NSCLC cells (HCC827) were ordered from the cell bank of Chinese Academy of Sciences. Thioanisole, m-cresol, 4-trifuoromethyl salicylic acid (TFMSA), N,N-diisopropylethylamine, acetic anhydride, dichloromethane, N,N-dimethylformamide, Kaiser test reagents, magnesium chloride, N-methyl-2-pyrrolidinone, trifluoroacetic acid, tris(hydroxymethyl)aminomethane, diethyl ether anhydrous, piperidine, pyridine, acetonitrile, O-benzotriazole-N,N,N′,N′-tetramethyl-uronium-hexafluorophosphate, ammonium persulphate, sodium chloride, and N,N,N′,N′-tetramethyl-ethylene-diamine were purchased from Aladdin (Shanghai, Mainland, China). High-purity water (18 MΩ) was generated from a Millipore (Merck) Milli-Q water system. Rink amide MBHA resin was purchased from CSBio (Shanghai) Ltd (China). All t-butyloxycarbonyl- and 9-fluorenylmethoxycarbonyl PNA monomers and mPEG were purchased from PANAGENE Inc. (Daejeon, Korea). The sequence of PNA capture probe was also included in Table 1.
Table 1 Sequences of DNA oligonucleotides and PNA probe used in this study
| Oligonucleotide (nts) |
Sequences (from 5′ to 3′ or N′ to C′) |
| Deletion mutation in EGFR exon 19, which has 23 base pairs missing. |
| EGFR wildtype (73) |
TTCCCGTCGCTATCAAGGAATTAAGAGAAGCAACATCTCCGAAAGCCAACAAGGAAATCCTCGATGTGAGTTT |
| EGFR mutation (50)a |
TTCCCGTCGCTATCAACGAAAGCCAACAAGGAAATCCTCGATGTGAGTTT |
| Padlock probe (98) |
Phosphate-TTGATAGCGACGGGAAAACTATCATAAGACTCGTCATGTCTCAGCAGCTTCTAACGGTCACTAATACGACTCACTATAGGTTTCCTTGTTGGCTTTCG |
| RCA primer (18) |
GCTGAGACATGACGAGTC |
| F-DP (18) |
Cy5-CTAACGGTCACTAATACG |
| PNA capture probe (11) |
NH2-(mPEG)3-AAACTCACATC-CONH2 |
| Random DNA (60) |
CACTTGACACGAACACTCCTAAGTCTGAACTTCATCACCCGCCATAGTAGACCTCTCTCC |
2.2. Graphene oxide (GO)
Flake graphene oxide was purchased from Aladdin (G139812, China) and purified as described previously by sonicating GO in a 3![[thin space (1/6-em)]](https://www.rsc.org/images/entities/char_2009.gif) :1 (v/v) solution of concentrated sulfuric acid (98%) and concentrated nitric acid (70%) for 24 h at 35–40 °C, and washed with water.55 The purified GO was dissolved in ddH2O to make a stock solution of 100 μg mL−1 and kept at 4 °C.
:1 (v/v) solution of concentrated sulfuric acid (98%) and concentrated nitric acid (70%) for 24 h at 35–40 °C, and washed with water.55 The purified GO was dissolved in ddH2O to make a stock solution of 100 μg mL−1 and kept at 4 °C.
2.3. PNA capture probe
PNA oligomers were synthesized on 10 μmol scale using Fmoc-solid phase peptide synthesis protocols on MBHA resin with HBTU as the amide-forming reagent.56–58 The Fmoc as protecting group was cleaved by 20 mL 20% piperidine DMF solution. And the uncoupling amino groups were capped using 2 mL acetic anhydride/pyridine/NMP (1:2:2, v/v). The product was washed by DMF and CH2Cl2 for 3 times respectively after each step. A Kaiser test was performed at each step to measure complete deprotection, coupling and capping, and double deprotection or double coupling was performed if it was required. To increase PNA solubility and make it suitable for surface anchoring, 3 mPEG monomers were also coupled to the PNA at the free amino terminus on the resin. After syntheses, the PNAs were cleaved from the solid support, and the bases were deprotected, using m-cresol/thioanisole/TFMSA/TFA (1:1:2:6) for 3 h and then precipitated with diethyl ether. The crude products were purified by high-performance liquid chromatography (Agilent Technologies 1260 Infinity II) on an Agilent Eclipse XDB-C18 column. The fraction containing the pure PNA was evaporated to dryness in a freeze dryer and characterized by Mass Spectrometry (Triple TOF4600). Stock solutions of PNA were prepared in ddH2O.
2.4. PNA microarray plate preparation
PNA was dissolved in immobilization buffer (IB, 100 mM Na2CO3, pH 9.6) [1.0 μM] with 100 μL added to each well of the plate. Some wells of the plate, designated as blanks, were left untouched throughout the process to serve as a blank against the rest of the plate. The plate was sealed with sealing tape for multi-well plates and agitated on a plate shaker (600–700 rpm) for 2 h at room temperature (RT). Then 50 μL of capping solution (CAP, 25 mM Lys, 10 mM NaH2PO4, 100 mM NaCl, 0.1 mM EDTA, pH 8.0) was added to the modified wells to give a final volume of 150 μL. This was again agitated at RT for 30 min. Modified wells were aspirated and washed four times with 300 μL of 1× phosphate buffer with 0.05% Tween 20 (1× PBST) and four times with 1× phosphate buffer (1× PBS). A final addition of 250 μL of 1× PBS was used to store the wells until used in the experiments. When the assay was ready to be performed, the 1× PBS was aspirated and 200 μL of blocking buffer with salmon sperm DNA (BLBs, 2% bovine serum albumin, 25 mM tris(hydroxymethyl) aminomethane (Tris), 150 mM NaCl, 0.05% TWEEN 20, 0.1 mM EDTA, 0.1 mg mL−1 single-stranded salmon sperm DNA, pH 7.4) was added to the wells. The plate was sealed and incubated with shaking for 30 min at 37 °C. The wells were immediately aspirated and used for sample detection.
2.5. Capturing of EGFR mutation
100 μL of different concentration (0, 1 fM, 10 fM, 100 fM, 1 pM, 10 pM, 100 pM, 1 nM, 10 nM, prepared in 1× PBS) of EGFR mutation was added into wells of the 96-well plate and agitated at 600–700 rpm for 30 min at 37 °C. Following incubation, the wells were aspirated and washed four times with 1× PBS buffer. Control experiments with the EGFR wildtype DNA were also carried out under identical conditions.
2.6. Ligation reaction
Following washes, the wells were first incubated with 100 μL of 0.1 μM padlock probe (in 1× PBS) for 30 min at 37 °C, followed a washing step of four times of 1× PBS. The wells were then aspirated for ligation. The ligation reaction of the padlock probe was performed in 50 μL of reaction mixture containing 4 μL T4 DNA ligase (7 U μL−1), 5 μL 10× T4 ligase buffer (TaKaRa) and 41 μL ddH2O. After addition of the ligation mixture, the samples were incubated for 1 h at RT, then incubated for 10 min at 65 °C to deactivate the T4 DNA ligase. Following incubation, the wells were aspirated and washed four times with 1× PBS buffer.
2.7. Rolling circle amplification (RCA)
The RCA reaction was performed in 50 μL reaction mixture containing 1 μL 50 μM primer, 5 μL 10× phi29 DNA polymerase reaction buffer, 1 μL 5 mg mL−1 BSA (Takara), 1 μL phage phi29 DNA polymerase (1 U μL−1, Takara), 1 μL 5 mM dNTP mixture and 41 μL ddH2O. The RCA reactions were performed at 37 °C for 1 h and terminated by heating at 65 °C for 10 min. The RCAPs were analyzed with 10% polyacrylamide gel electrophoresis (PAGE) in 1× TBE buffer consisting of Tris (40 mM), acetic acid (20 mM), and EDTA (1 mM) (pH 8.3), and the DNA bands were visualized with gel-red.
2.8. Spectrofluorometric analysis of fluorescence quenching by GO
Each RCAPs reaction mixture (25 μL) and 1 μL of F-DP (100 μM) were hybridized by first heating at 90 °C for 5 min and then slowly cooled to RT for 15 min. Each RCAP/F-DP hybrid (26 μL) was then supplemented with a solution containing 10 μL of GO (100 μg mL−1), 10 μL of 10× GO binding buffer (50 mM MgCl2 and 200 mM Tris–HCl, pH 7.5) and 54 μL of ddH2O (a total volume of 100 μL). After further incubation at RT for 20 min, the emission spectrum of the mixture was measured in the wavelength range of 650–750 nm upon excitation at 648 nm, using a spectrofluorophotometer (LS55, PE). To validate the specificity of the PNA microarray based fluorometric EGFR mutation detection method, the same ligation and RCA reaction were also performed with EGFR wildtype (10 nM) and random DNA (10 nM).
2.9. Optimization of GO concentration for F-DP fluorescence quenching
In order to get an optimal concentration of GO for fluorescence quenching, 1 μL of 100 μM F-DP was mixed with 99 μL of GO solution in 1× GO binding buffer at various concentrations (0, 0.5, 1, 2, 4, 8, 10, 12, 14, 16, 18 and 20 μg mL−1, final concentration). After incubation at RT for 20 min, the fluorescence was measured with a spectrofluorophotometer (LS55, PE) at an excitation wavelength of 648 nm and an emission wavelength of 664 nm.
2.10. Absorbance measurements
To characterize the interaction between GO and F-DP, 5 μL of 100 μM F-DP was mixed with 495 μL of GO solution in 1× GO binding buffer at various concentrations (0, 10, 20 and 30 μg mL−1, final concentration). After incubation at RT for 20 min, the UV-vis spectra were measured using a Cary 300 UV-vis spectrophotometer (Agilent) with a 1 cm path length quartz cuvette. The absorption spectra of the solution were measured in the wavelength range from 800 to 200 nm with the same concentration of GO aqueous solution accordingly as the reference solution.
2.11. Specificity and sensitivity tests
To assess the specificity and the sensitivity of the PNA microarray-based EGFR mutation detection system, 10 nM EGFR wildtype DNA was mixed with different concentrations of EGFR mutation (0, 1 fM, 10 fM, 100 fM, 1 pM, 10 pM, 100 pM, 1 nM, 10 nM, prepared in 1× PBS), then the mixture were added to the PNA-labeled wells of a 96-well plate and captured as described above. Ligation and RCA reactions were conducted under the same condition as described above. The RCAPs were analyzed with 10% PAGE in 1× TBE buffer consisting of Tris (40 mM), acetic acid (20 mM), and EDTA (1 mM) (pH 8.3), and the DNA bands were visualized with gel-red. For fluorometric detection, the RCAPs were subjected to F-DP (1 μM) hybridization, and the hybrid was then mixed with GO solution (10 μg mL−1) as described above. After incubation at RT for 20 min, the emission spectrum of the mixture (100 μL) was scanned by spectrofluorophotometer (LS55, PE) upon excitation at 648 nm.
2.12. Preparation of NSCLC cancer cells lysate
Incubated NSCLC cancer cells (HCC827) were collected by trypsinization and centrifugation, washed with 0.1 M PBS, and pelleted at 3000 rpm for 5 min at 4 °C. The cells were resuspended in RIPA cell lysis solution at a concentration of 5.0 × 10⁶ cells per mL, incubated for 30 min at −20 °C, then centrifuged at 12000 rpm for 30 min at 4 °C. The supernatant was collected and filtered by a 0.45 μm filter membrane prior to storing at −20 °C.58
3. Results and discussion
3.1. Assay principle
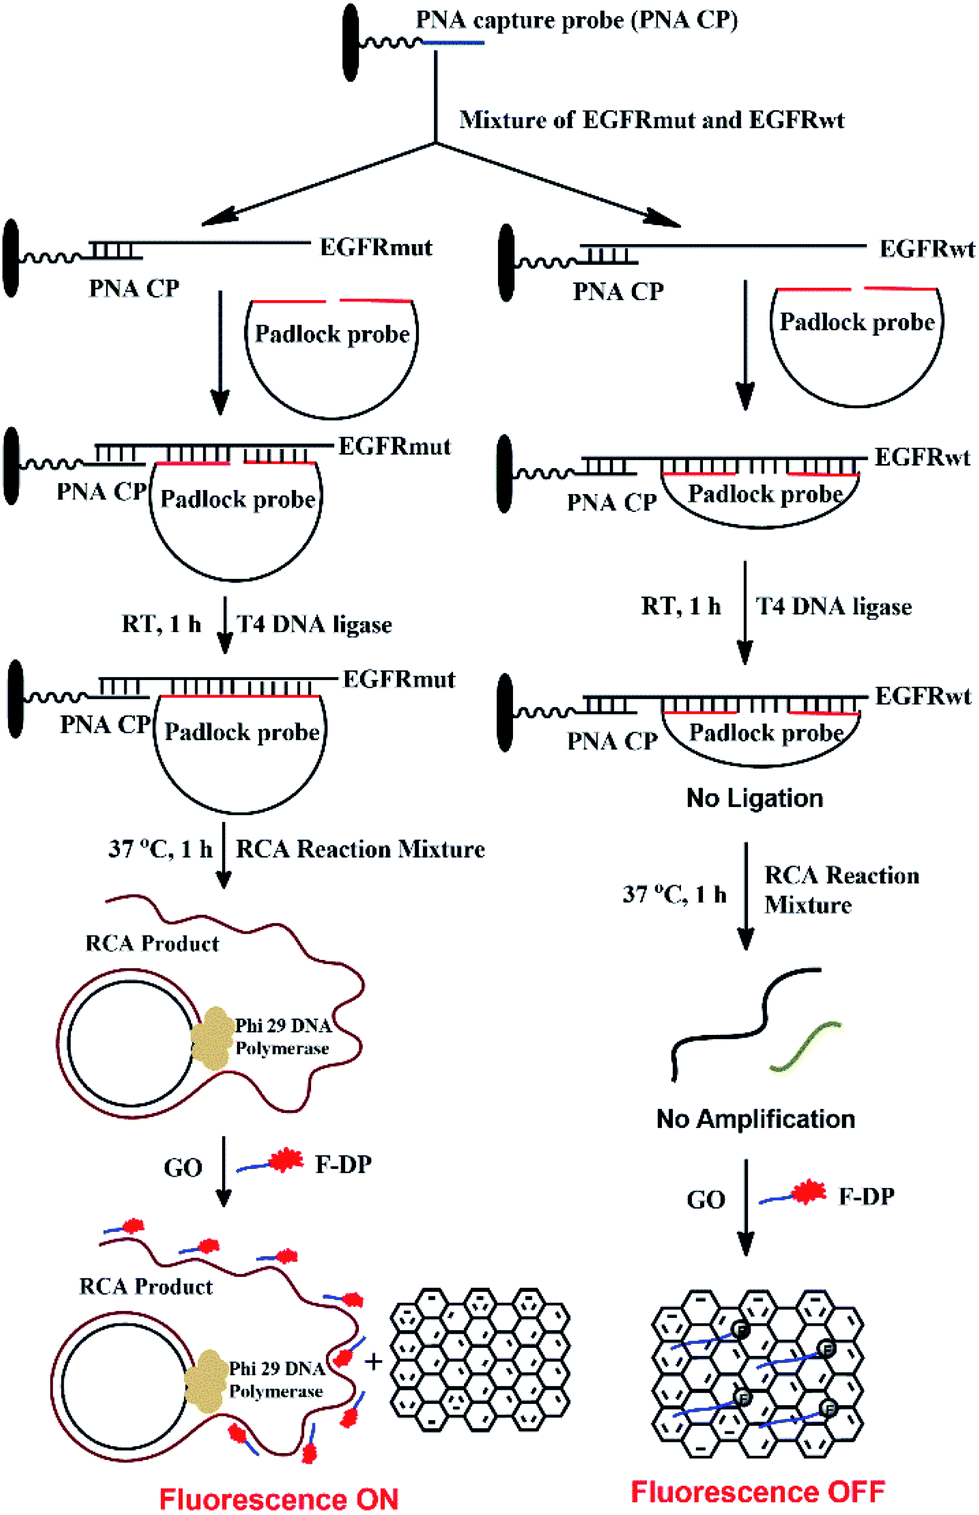
The detection mechanism of the PNA microarray-based fluorometric assay for EGFR mutation is illustrated in Scheme 1.
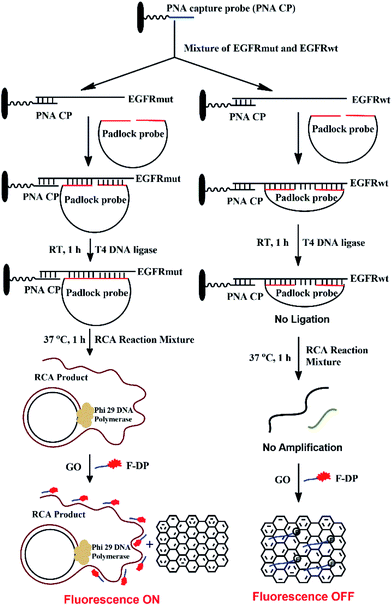 |
| | Scheme 1 Schematic illustration of the EGFR mutation detection process using PNA microarray-based fluorometric assay combined with RCA-based EGFR mutation amplification. | |
A 11-nt PNA capture probe, which is used to recognize and capture target EGFR sequence, was designed and synthesized by the method of solid-phase peptide synthesis as described previously.56–58 To increase PNA solubility and make it suitable for surface anchoring, terminal amino modified mPEG linker (NH2-(mPEG)3-) was also attached to the probe. In this study, the first step is to prepare PNA microarrays by attaching PNA capture probe covalently via amide bond to the plastic surface of a NUNC 96-well plate. Then, in a typical sensing process, the samples, which might be a mixture of EGFR mutation and EGFR wildtype sequences, were added onto PNA microarrays and the PNA probe will recognize and capture the target EGFR sequence by binding to their complementary sequences. After removing the unhybridized impurities, the EGFR sequence was hybridized with a padlock probe at its both ends, which have 16 bases complementary to EGFR sequence (see Scheme 1). In the presence of target EGFR mutation sequence, the padlock probe would hybridize with it to be used as a template, and the ligation reaction could occur in the presence of T4 DNA ligase, which resulted in the circularization of the padlock probe. The assembled circular DNA serves as a template, and the RCA reaction is initiated by phi29 DNA polymerase with the presence of a primer, which yields a long, single-stranded repeating sequence product that is then subjected to detection via the fluorescence-quenching platform, using GO and F-DP (see Scheme 1). The F-DP, designed to be a part of the padlock probe, can then be annealed to multiple sites of the RCAP to form a F-DP/RCAP duplex molecule, which cannot adsorb onto the GO monolayer, and thus, the F-DP fluorescence is not quenched. These samples exhibit a relatively high fluorescence signal. However, in the presence of the EGFR wildtype sequence, the padlock probe could still hybridize with it at both ends, but there is a 23-nt long gap between the 3′ and 5′ end of the padlock probe (see Scheme 1). Thus the ligation and RCA reaction could not occur, and the corresponding single-stranded RCAP could not generated, the free single-stranded F-DPs would adsorb onto the GO monolayer surface, and significant fluorescence quenching by GO would occur. Therefore, the fluorescence signals of the EGFR wildtype samples are significantly lower. Thus, the EGFR mutation can be quantitatively detected simply by measuring the fluorescence signal after adding GO to the reaction mixture.
3.2. Validation of the PNA microarray-based fluorometric assay for EGFR mutation detection
Here, the EGFR mutation was used as the target, while EGFR wildtype was used as a reference for data normalization. To examine that the target sequence was specifically amplified through ligation and subsequent RCA, ligation and RCA were carried out in the presence of target EGFR mutation, nontarget EGFR wildtype or random DNA. As shown in Fig. 1A, a large, high-molecular-weight DNA molecule was observed only in the presence of EGFR mutation, suggesting the successful generation of the long single-strand RCAP by RCA (lane a). In contrast, this large DNA product was not observed in the absence of EGFR mutation (lane d) or in the presence of nontarget EGFR wildtype or random DNA (lanes b and c, respectively). To eliminate the possibility that the RCA reaction did not take place, the final product was just formed by the hybridization of the padlock probe to the EGFR mutation sequence, the RCA reaction for EGFR mutation in the absence of phi29 DNA polymerase was also carried out as a negative control (lane e). To further confirm that the RCA reaction did occur, the ligation products of EGFR mutation and EGFR wildtype with padlock probe were also analyzed. As shown in Fig. 1B, the padlock probe, when hybridizing with the EGFR mutation, was circularized through ligation using the sequence of EGFR mutation as a template, and a main band at the molecular weight of about 140 bp was observed (lane c), which correspond to the hybrid of the padlock probe and EGFR mutation. Thus, the RCA reaction could occur using the circular DNA as a template, and a high-molecular-weight DNA product was generated (lane d). While hybridizing with EGFR wildtype, the padlock probe mainly exists by themselves in a free state (lane g) for the high steric hindrance and no circular DNA formed through ligation, leading the RCA reaction failed to take place (lane h). These results suggested that the RCA reaction only occurred in the presence of the corresponding target EGFR mutation sequence.
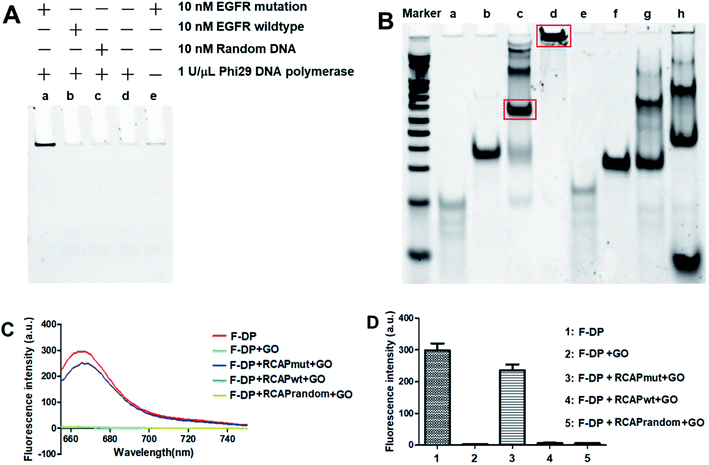 |
| | Fig. 1 Validation of the PNA microarray-based fluorometric assay for EGFR mutation screening. (A) PAGE analysis of the RCAP of EGFR mutation (lane a), EGFR wildtype (lane b) and random DNA (lane c). The RCAP without target EGFR sequence (lane d) and the RCAP of EGFR mutation without phi29 DNA polymerase were also included as negative controls. (B) PAGE analysis of the ligation product and the RCAP of EGFR mutation (lane c and d) and EGFR wildtype (lane g and h). EGFR mutation (lane a), EGFR wildtype (lane e) and padlock probe (lane b and f) were also included as controls. Marker: 20 bp molecular weight marker DNAs. The RCAPs were analyzed by 10% PAGE in 1× TBE buffer and visualized with gel red staining. (C) Fluorescence emission spectra and (D) fluorescence intensity (648 nm) responses of Cy5-labeled F-DP (1 μM) in the absence and presence of RCAP of EGFR mutation, EGFR wildtype or random DNA after incubation with 10 μg mL−1 GO. The fluorescence of F-DP itself was also included as a control. | |
To validate our PNA microarray-based fluorometric detection system, we monitored the fluorescence change in Cy5-labeled detection probe by adding various RCAPs and GO to the F-DP mixture (Fig. 1C and D). When GO was added to a solution containing F-DP only, the fluorescence was almost completely quenched. In contrast, addition of GO to the mixture of F-DP and RCAP of EGFR mutation (RCAPmut) resulted in a slight fluorescence quenching compared with F-DP only, suggesting the formation of a double-stranded structure between F-DP and RCAPmut. However, incubation of F-DP with RCAP of EGFR wildtype (RCAPwt) or RCAP of random DNA (RCAPrandom) did not prevent the fluorescence quenching of F-DP by GO, indicating that the RCA reaction did not take place in the presence of EGFR wildtype or random DNA. These observations clearly indicate the specificity of the PNA microarray-based fluorometric assay, which could discriminate the EGFR mutation from the EGFR wildtype when combined with RCA and GO.
3.3. Optimization of GO concentration
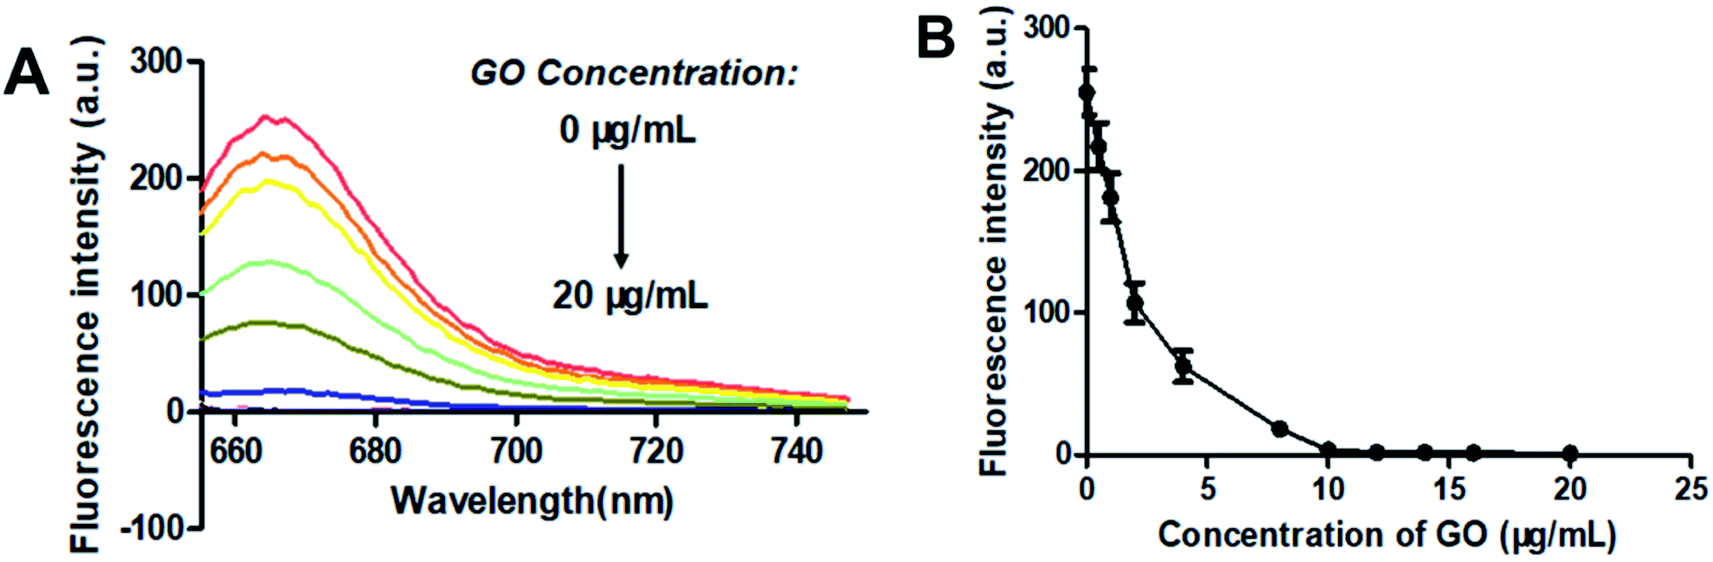
GO is known to bind with single-stranded oligonucleotides non-covalently via π–π-stacking.49 So, when GO was added to the solution of F-DP, the molecules of F-DP would adsorb onto the GO monolayer and resulted in the decrease in absorbance of the DNA strand and the Cy5 fluorophore in solution (see Fig. S1†). GO can also quench the fluorescence of the fluorophore-labeled single-stranded oligonucleotides via long-range energy transfer from the fluorophore to the π-system of the GO molecule,50 and the quenching efficiency is direct proportional to the ratio of GO to fluorophore.51,52 To achieve the optimal signal to background ratio, titration experiments of 1 μM F-DP with various concentrations of GO were performed, and the fluorescence intensities of the resulting F-DP/GO solutions at 664 nm were recorded, respectively. As shown in Fig. 2, the fluorescence intensity was gradually decreased from about 260 to close to zero as the concentration of GO increased from 0 μg mL−1 to 10 μg mL−1, meaning that GO at a concentration of 10 μg mL−1 could almost completely quench the fluorescence of 1 μM F-DP, and with further increase in the GO concentration, the fluorescence intensity almost kept unchanged (see Fig. 2B). Therefore, to get the highest discrimination capability of the sensor for EGFR mutation, the GO concentration of 10 μg mL−1 was used in the following experiments.
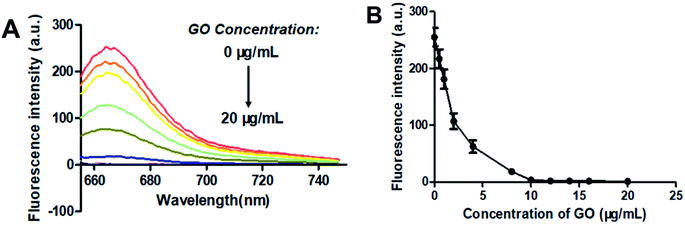 |
| | Fig. 2 Optimization of the graphene oxide (GO) concentration. (A) Fluorescence spectra and (B) fluorescence intensity at 664 nm changes of 1 μM F-DP as the concentration of GO increased from 0 to 20 μg mL−1. From top to bottom, the concentration of GO was 0, 0.5, 1, 2, 4, 8, 10, 12, 14, 16 and 20 μg mL−1, respectively. Fluorescence was measured with the excitation wavelength at 648 nm and the emission wavelength at 664 nm. Error bars reflect four separate measurements. | |
3.4. Sensing performances of the PNA microarray-based fluorometric assay
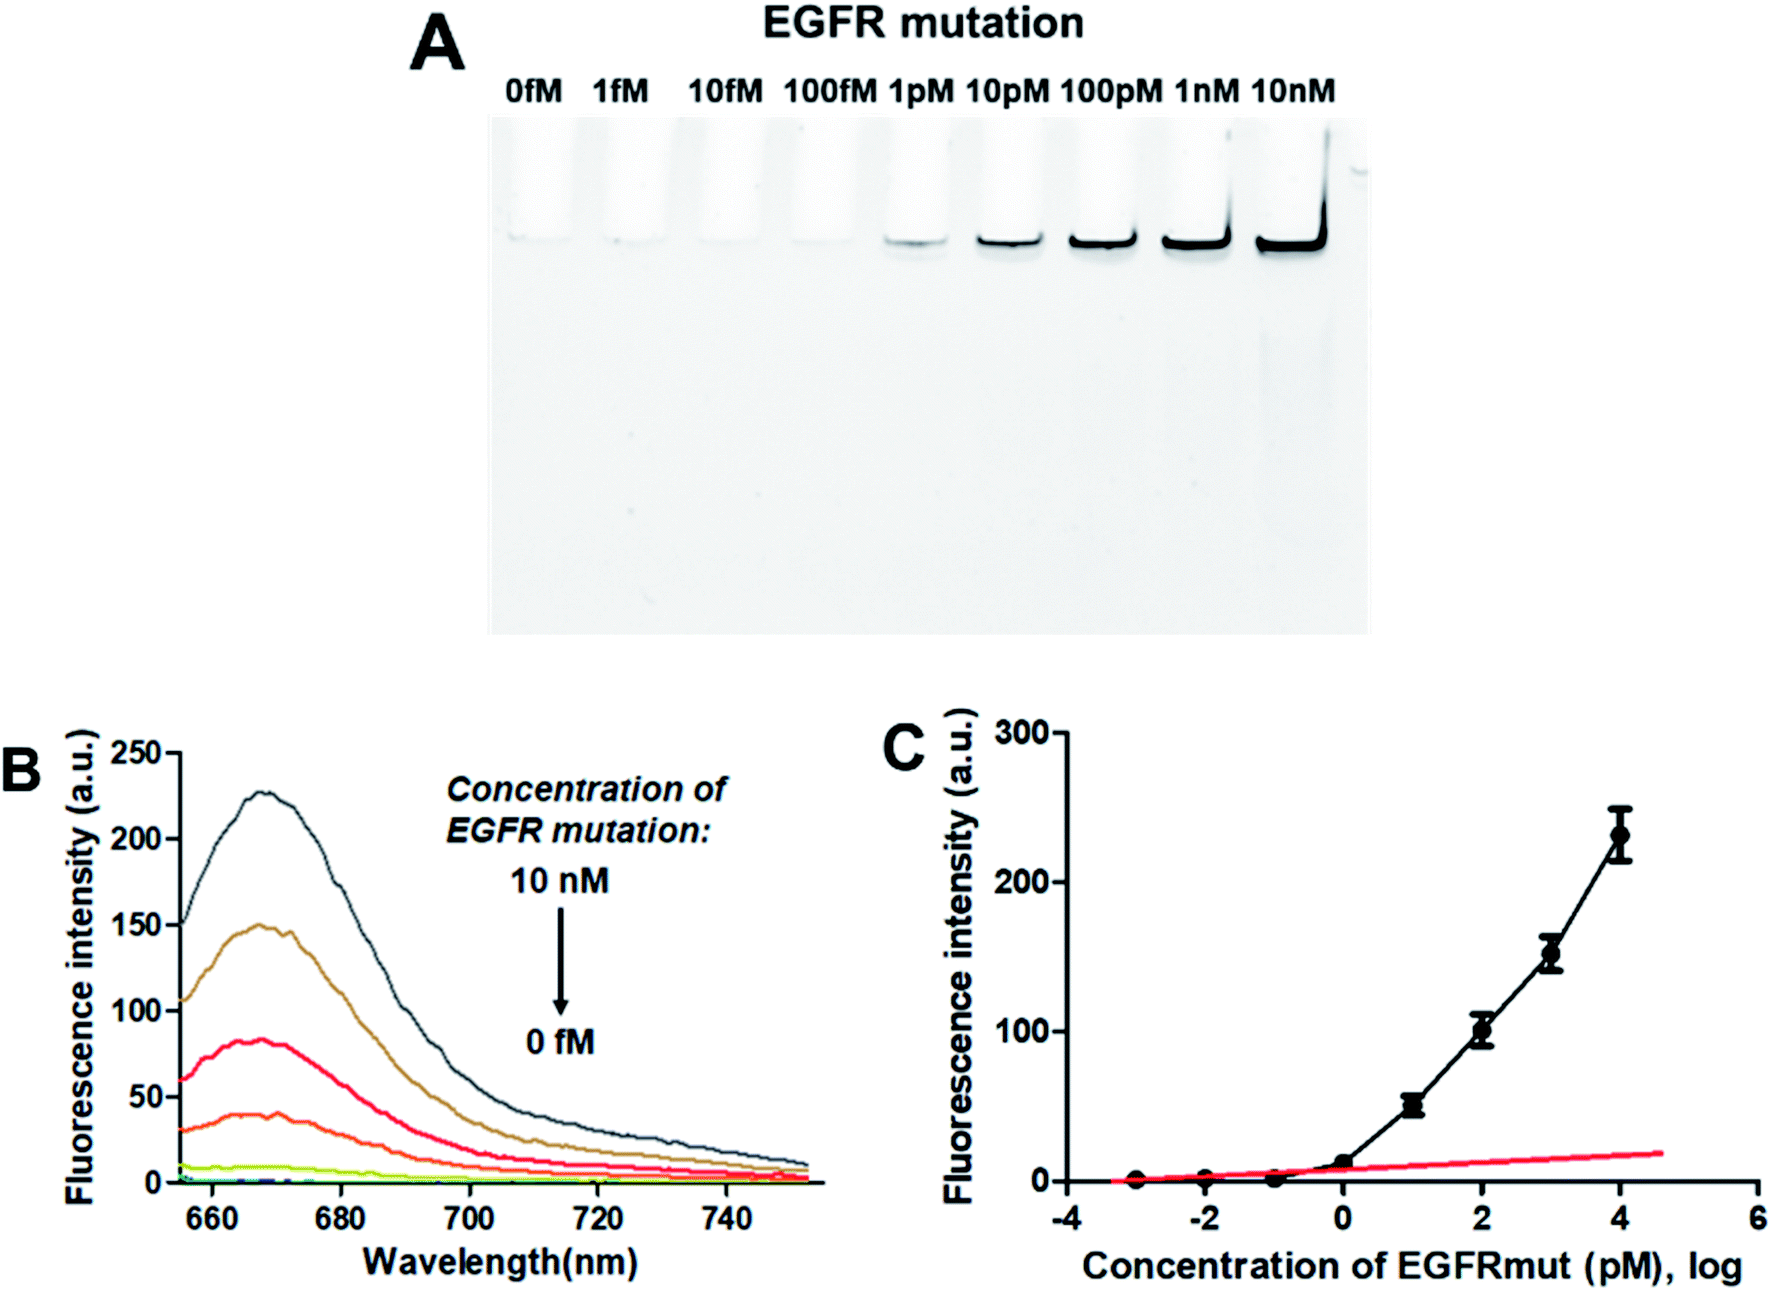
3.4.1. Sensitivity. To evaluate the sensitivity of the PNA microarray-based fluorometric sensor for EGFR mutation, various concentrations of EGFR mutation were added onto the PNA microarray. After ligation and RCA, the RCAPs were first analyzed by PAGE. As indicated in Fig. 3A, the amount of the RCAP is sensitive to and increases as the concentration of EGFR mutation increases. The RCAP could be clearly observed at the concentration of EGFR mutation of 1 pM. To quantitatively measure the sensitivity of the sensor, fluorescence intensity was also recorded after incubation of the RCAP with 1 μM F-DP and 10 μg mL−1 GO. Fig. 3B shows the relationship between fluorescence intensity and the concentrations of EGFR mutation. The fluorescence intensity of RCAP increased gradually with increasing concentration of EGFR mutation. A linear correlation exists between the fluorescence intensity at 664 nm and the logarithm of EGFR mutation concentration over the range of 1 fM to 1 pM (Fig. 3C). This sensor has a detection limit of 0.3 pM based on the equation LOD = 3.3 × (SD/S) with a 1% confidence level, where SD is the standard deviation of the response and S is the slope of the standard curve in the linear region,43 which is about 3 orders of magnitude higher than that of DNA microarray-based fluorometric assay for EGFR mutation detection.59 These data show high sensitivity for the quantitative analysis of EGFR mutation by using the PNA microarray-based fluorometric platform.
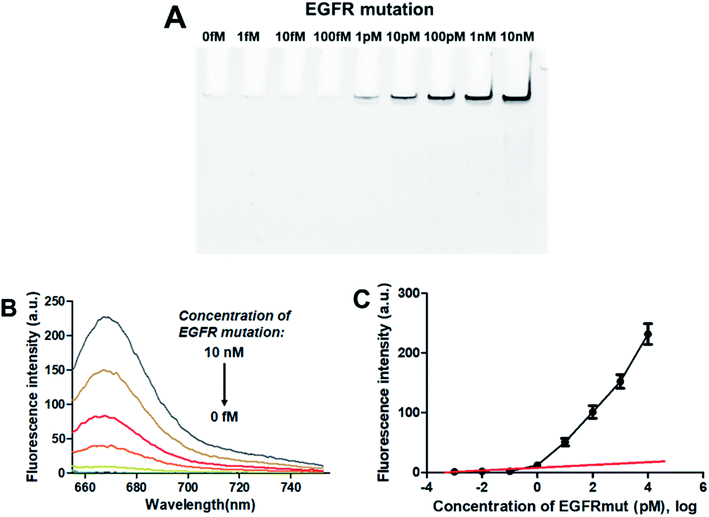 |
| | Fig. 3 Sensing performance of the PNA microarray-based fluorometric assay for EGFR mutation detection. (A) PAGE analysis of the RCAPs with different concentrations of EGFR mutation (0–10 nM). (B) Fluorescence emission spectra (λex = 648 nm) of RCAP/F-DP hybrids in the presence of 10 μg mL−1 GO, upon addition of different concentrations of EGFR mutation at (0–10 nM). (C) Plot of the fluorescence intensity at 664 nm against the logarithm of target EGFR mutation concentrations. Error bars reflect four separate measurements. | |
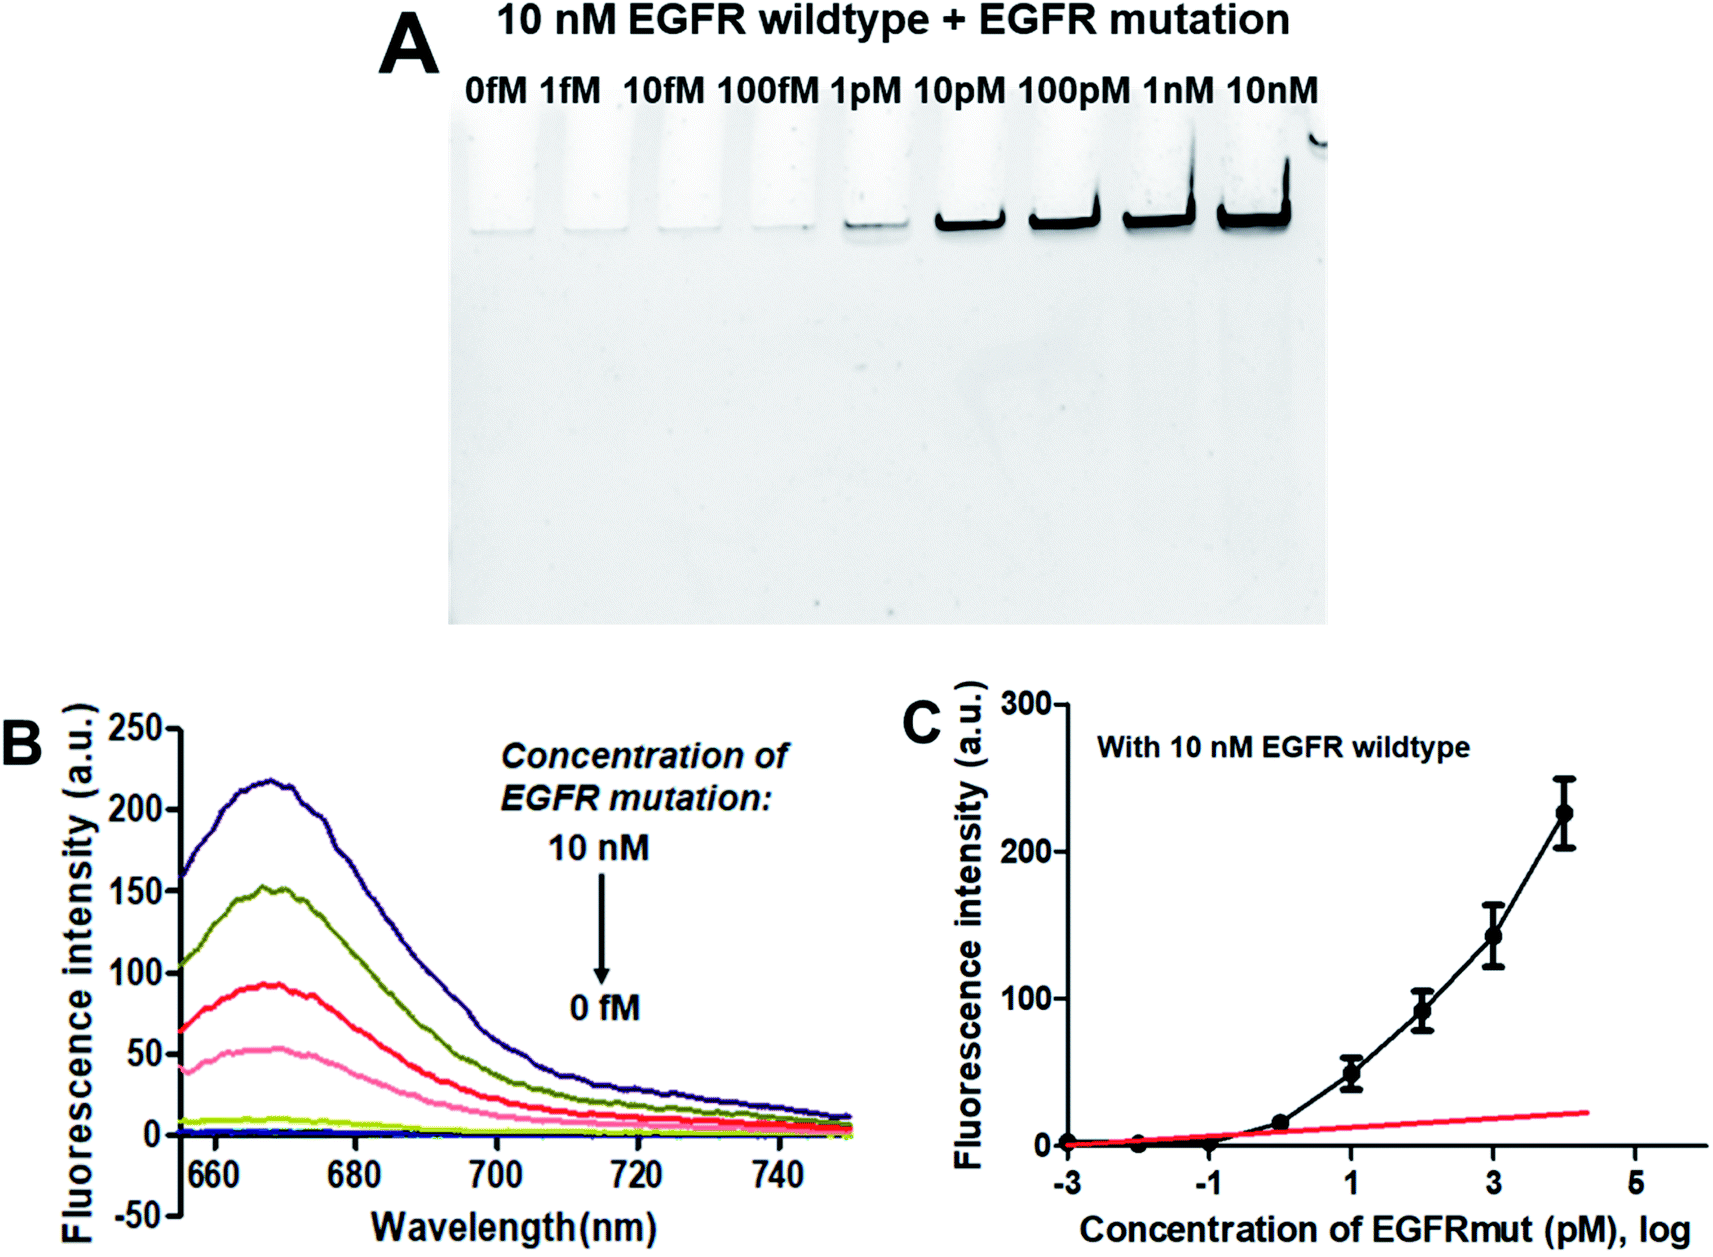
3.4.2. Specificity. As demonstrated above that the PNA microarray-based fluorometric assay could specifically discriminate the EGFR mutation sequences from the EGFR wildtype sequences when combined with RCA and GO. Does the presence of EGFR wildtype has any influence on the detection of EGFR mutation? Thus, the specificity study was also carried out by using mixtures of 10 nM EGFR wildtype with different concentrations of EGFR mutation (0–10 nM). As showed in the PAGE results in Fig. 4A, the RCAP band was clearly visualized at the EGFR mutation concentration of 1 pM, while no clear band was observed for EGFR wildtype alone or at low EGFR mutation concentration (<1 pM). This is consistent with the result that obtained using EGFR mutation alone, indicating the high specificity of our sensor for EGFR mutation. The similar fluorescence measurement results to that of EGFR mutation itself also confirmed that the presence of EGFR wildtype produces little interference on the detection of EGFR mutation, and it could be quantitatively detected at a LOD of 0.3 pM (Fig. 4B and C). These results demonstrated that the proposed PNA microarray-based fluorometric sensor could specifically detect EGFR mutation sequences even in the presence of EGFR wildtype, and thus have potential for EGFR mutation screening in biological samples.
 |
| | Fig. 4 Sensing performance of the PNA microarray-based fluorometric assay for EGFR mutation detection in the presence of 10 nM EGFR wildtype. (A) PAGE analysis of the RCAPs with different concentrations of EGFR mutation (0–10 nM). (B) Fluorescence emission spectra (λex = 648 nm) of RCAP/F-DP hybrids in the presence of 10 μg mL−1 GO, upon addition of different concentrations of EGFR mutation at (0–10 nM). (C) Plot of the fluorescence intensity at 664 nm against the logarithm of target EGFR mutation concentrations. Error bars reflect four separate measurements. | |
3.5. Detection of EGFR mutation in biological samples
To verify the feasibility of applying this PNA microarray-based sensing strategy for biological samples, the analysis of EGFR mutation was conducted in NSCLC cancer cell lysate. Tests were performed by adding various concentrations of EGFR mutation sequence (0–10 nM) to 10% HCC827 cell lysate. After ligation and RCA, the RCAPs were analyzed by 10% PAGE and also fluorescence spectra (combined with F-DP and GO). The results are shown in Fig. 5. The amount of RCAP increased gradually as the concentration of EGFR mutation increased, and the RCAP band at the concentration of EGFR mutation of 1 pM was still visible (Fig. 5A). The fluorescence intensity also increased with increasing concentration of EGFR mutation in cell lysate (Fig. 5B). Meanwhile, the LOD, which was calculated to be 0.6 pM according to Fig. 5C, also demonstrated the high sensitivity of our sensor for EGFR mutation when mixed with cellular DNAs. All these results indicate the potentiality of the proposed method for EGFR mutation detection in real biological samples.
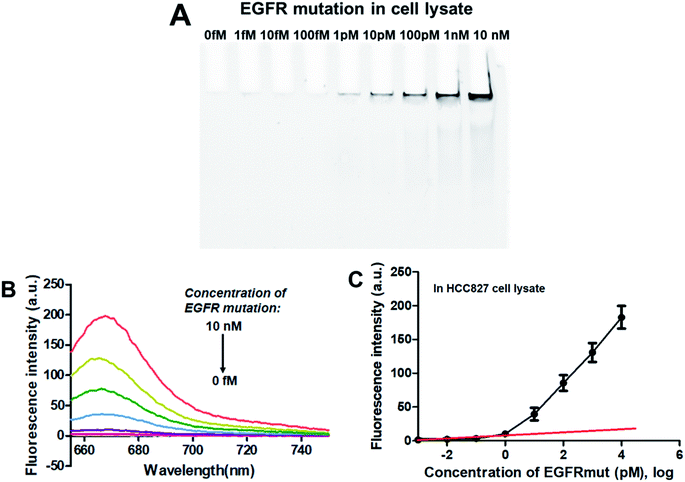 |
| | Fig. 5 Sensing performance of the PNA microarray-based fluorometric assay for EGFR mutation detection in HCC827 cancer cell lysate. (A) PAGE analysis of the RCAPs with different concentrations of EGFR mutation (0–10 nM). (B) Fluorescence emission spectra (λex = 648 nm) of RCAP/F-DP hybrids in the presence of 10 μg mL−1 GO, upon addition of different concentrations of EGFR mutation at (0–10 nM). (C) Plot of the fluorescence intensity at 664 nm against the logarithm of target EGFR mutation concentrations. Error bars reflect four separate measurements. | |
Furthermore, the recovery assays were also performed by spiking the EGFR mutation (0.1 nM, 1 nM, 2 nM and 5 nM) into 10% HCC827 cell lysate samples. Acceptable recoveries (between 95% and 104%) and standard deviations (between 0.007 and 0.109) were obtained (Table 2), indicating that the developed deletion mutation sensing strategy could be applied to quantify the concentration of the EGFR mutation in real biological samples.
Table 2 Recovery of the EGFR mutation in 10% cell lysate samples obtained with the proposed sensor (n = 4)
| Name |
Added target (nM) |
Found (nM) |
Recovery (%) |
SD (n = 4) |
| 1 |
0.1 |
0.095 |
95 |
0.007 |
| 2 |
1.0 |
1.03 |
103 |
0.018 |
| 3 |
2.0 |
2.04 |
102 |
0.072 |
| 4 |
5.0 |
5.20 |
104 |
0.109 |
4. Conclusions
In summary, we have demonstrated a sensitive and specific method to detect EGFR deletion mutation by using a PNA microarray-based fluorometric assay. This strategy uses a short and label-free PNA probe to specifically capture target sequences, which offers an extremely simple and reliable way to profile EGFR mutations without the need of chemical modification for profiling. The ligation reaction coupled with RCA enhances the sensitivity, and imparts exceptional specificity for EGFR mutation against EGFR wildtype. Furthermore, the use of GO-based fluorescence quenching platform makes it easy for target detection just by simply evaluating the fluorescence intensity changes. Currently, the assay could be completed within 6 hours. It represents a promising tool for detection of EGFR mutations from NSCLC patients. In principle, this detection method is also suitable for the diagnosis of other diseases that caused by gene deletion mutations. Future studies will focus on the improvement of the performances of detecting different EGFR deletion mutations in real samples.
Conflicts of interest
The authors declare no competing financial interest.
Acknowledgements
This work was supported by Ningbo Natural Science Foundation (2017C110020, 2018A610318, 2019C50039), China Postdoctoral Science Foundation (2017M621982), Zhejiang Postdoctoral Research Projects Preferred Funding, and funds from Ningbo Institute of Materials Technology and Engineering, Chinese Academy of Sciences.
References
- R. S. Herbst, Int. J. Radiat. Oncol., Biol., Phys., 2004, 59, 21–26 CrossRef CAS PubMed.
- K. Oda, Y. Matsuoka, A. Funahashi and H. Kitano, Mol. Syst. Biol., 2005, 1, 2005.0010 CrossRef.
- J. G. Paez, P. A. Janne, J. C. Lee, S. Tracy, H. Greulich, S. Gabriel, P. Herman, F. J. Kaye, N. Lindeman, T. J. Boggon, K. Naoki, H. Sasaki, Y. Fujii, M. J. Eck, W. R. Sellers, B. E. Johnson and M. Meyerson, Science, 2004, 304, 1497–1500 CrossRef CAS.
- T. J. Lynch, D. W. Bell, R. Sordella, S. Gurubhagavatula, R. A. Okimoto, B. W. Brannigan, P. L. Harris, S. M. Haserlat, J. G. Supko, F. G. Haluska, D. N. Louis, D. C. Christiani, J. Settleman and D. A. Haber, N. Engl. J. Med., 2004, 350, 2129–2139 CrossRef CAS PubMed.
- T. Powrózek, P. Krawczyk, J. Pankowski, K. Reszka, M. Jakubiak, A. Obrochta, K. Wojas-Krawczyk, J. Buczkowski and J. Milanowski, Tumori J., 2015, 101, e151–e153 CrossRef PubMed.
- Y. L. Wu, C. Zhou, C. P. Hu, J. Feng, S. Lu, Y. Huang, W. Li, M. Hou, J. H. Shi, K. Y. Lee, C. R. Xu, D. Massey, M. Kim, Y. Shi and S. L. Geater, Lancet Oncol., 2014, 15, 213–222 CrossRef CAS PubMed.
- R. Rosell, E. Carcereny, R. Gervais, A. Vergnenegre, B. Massuti, E. Felip, R. Palmero, R. Garcia-Gomez, C. Pallares, J. M. Sanchez, R. Porta, M. Cobo, P. Garrido, F. Longo, T. Moran, A. Insa, F. De Marinis, R. Corre, I. Bover and A. Illiano, et al., Lancet Oncol., 2012, 13, 239–246 CrossRef CAS.
- T. Mitsudomi, S. Morita, Y. Yatabe, S. Negoro, I. Okamoto, J. Tsurutani, T. Seto, M. Satouchi, H. Tada, T. Hirashima, K. Asami, N. Katakami, M. Takada, H. Yoshioka, K. Shibata, S. Kudoh, E. Shimizu, H. Saito, S. Toyooka, K. Nakagawa and M. Fukuoka, Lancet Oncol., 2010, 11, 121–128 CrossRef CAS.
- L. V. Sequist, J. C. Yang, N. Yamamoto, K. O'Byrne, V. Hirsh, T. Mok, S. L. Geater, S. Orlov, C. M. Tsai, M. Boyer, W. C. Su, J. Bennouna, T. Kato, V. Gorbunova, K. H. Lee, R. Shah, D. Massey, V. Zazulina, M. Shahidi and M. Schuler, J. Clin. Oncol., 2013, 31, 3327–3334 CrossRef CAS PubMed.
- C. Zhou, Y. L. Wu, G. Chen, J. Feng, X. Q. Liu, C. Wang, S. Zhang, J. Wang, S. Zhou, S. Ren, S. Lu, L. Zhang, C. Hu, C. Hu, Y. Luo, L. Chen, M. Ye, J. Huang, X. Zhi, Y. Zhang, Q. Xiu, J. Ma, L. Zhang and C. You, Lancet Oncol., 2011, 12, 735–742 CrossRef CAS.
- J. C. Soria, Y. Ohe, J. Vansteenkiste, T. Reungwetwattana, B. Chewaskulyong, K. H. Lee, A. Dechaphunkul, F. Imamura, N. Nogami, T. Kurata, I. Okamoto, C. Zhou, B. C. Cho, Y. Cheng, E. K. Cho, P. J. Voon, D. Planchard, W. C. Su, J. E. Gray, S. M. Lee, R. Hodge, M. Marotti, Y. Rukazenkov and S. S. Ramalingam, N. Engl. J. Med., 2018, 378, 113–125 CrossRef CAS.
- K. S. Thressa, R. Brantb, T. H. Carrc, S. Deardend, S. Jenkinse, H. Brownd, T. Hammettf, M. Cantarinig and J. C. Barrettaa, Lung Cancer, 2015, 90, 509–515 CrossRef PubMed.
- Cobas EGFR Mutation Test v2, PMA 150047: FDA Summary of Safety and Effectiveness Data, https://www.accessdata.fda.gov/cdrh_docs/pdf15/P150047B.pdf, 2 January 2018, date last accessed.
- W. Britta, M. Peter, H. Henrik, W. Lin, W. Wen, T. Julie, K. Azza, N. Ebba and S. S. Boe, BMC Cancer, 2014, 14, 294 CrossRef PubMed.
- Y. L. Wu, L. V. Sequist, C. P. Hu, J. F. Feng, S. Lu, Y. C. Huang, W. Li, M. Hou, M. Schuler, T. Mok, N. Yamamoto, K. Byrne, V. Hirsh, N. Gibson, D. Massey, M. Kim and J. C. H. Yang, Br. J. Cancer, 2017, 116, 175–185 CrossRef CAS PubMed.
- L. Wang, Q. M. Guo, W. J. Yu, L. H. Qiao, M. N. Zhao, C. Z. Zhang, X. M. Hua, G. H. Yang, L. W. Xiong and J. T. Lou, Lung Cancer, 2017, 114, 31–37 CrossRef PubMed.
- X. Xu, X. Weng, C. Wang, W. Lin, A. Liu, W. Chen and X. Lin, Biosens. Bioelectron., 2016, 80, 411–417 CrossRef CAS PubMed.
- X. Weng, X. Xu, C. Wang, W. Lin, A. Liu, W. Chen and X. Lin, J. Pharm. Biomed. Anal., 2018, 150, 176–182 CrossRef CAS PubMed.
- G. Nallur, C. Luo, L. Fang, S. Cooley, V. Dave, J. Lambert, K. Kukanskis, S. Kingsmore, R. Lasken and B. Schweitzer, Nucleic Acids Res., 2001, 29, e118 CrossRef CAS PubMed.
- J. Inoue, Y. Shigemori and T. Mikawa, Nucleic Acids Res., 2006, 34, e69 CrossRef PubMed.
- R. Kusumoto-Matsuo, T. Kanda and I. Kukimoto, Genes Cells, 2011, 16, 23–33 CrossRef CAS PubMed.
- I. Rizvi, N. R. Choudhury and N. Tuteja, Arch. Virol., 2015, 160, 375–387 CrossRef CAS.
- V. S. Irina, I. C. Dmitry, M. N. Raymond, B. Thomas, H. S. James, J. L. David, E. B. Natalia and V. D. Vadim, Anal. Biochem., 2005, 347, 152–155 CrossRef PubMed.
- C. Russell, K. Welch, J. Jarvius, Y. X. Cai, R. Brucas, F. Nikolajeff, P. Svedlindh and M. Nilsson, ACS Nano, 2014, 8, 1147–1153 CrossRef CAS PubMed.
- M. Nilsson, F. Dahl, C. Larsson, M. Gullberg and J. Stenberg, Trends Biotechnol., 2006, 24, 83–88 CrossRef CAS PubMed.
- M. Nilsson, Histochem. Cell Biol., 2006, 126, 159–164 CrossRef CAS PubMed.
- D. Zhang, J. Wu, F. Ye, T. Feng, I. Lee and B. Yin, Clin. Chim. Acta, 2006, 363, 61–70 CrossRef CAS PubMed.
- X. Qian and R. V. Lloyd, Diagn. Mol. Pathol., 2003, 12, 1–13 CrossRef CAS PubMed.
- V. V. Demidov, Expert Rev. Mol. Diagn., 2002, 2, 89–95 Search PubMed.
- S. C. Andras, J. B. Power, E. C. Cocking and M. R. Davey, Mol. Biotechnol., 2001, 19, 29–44 CrossRef CAS PubMed.
- B. Schweitzer and S. Kingsmore, Curr. Opin. Biotechnol., 2001, 12, 21–27 CrossRef CAS PubMed.
- M. M. Shi, Clin. Chem., 2001, 47, 164–172 CAS.
- N. O. Fischer, T. M. Tarasow and J. B.-H. Tok, Anal. Biochem., 2008, 373, 121–128 CrossRef CAS PubMed.
- M. M. Ali, F. Li, Z. Q. Zhang, K. X. Zhang, D. K. Kang, J. A. Ankrum, X. C. Le and W. A. Zhao, Chem. Soc. Rev., 2014, 43, 3324–3341 RSC.
- S. F. Kingsmore and D. D. Patel, Curr. Opin. Biotechnol., 2003, 14, 74–81 CrossRef CAS.
- P. M. Lizardi, X. Huang, Z. Zhu, P. Bray-Ward, D. C. Thomas and D. C. Ward, Nat. Genet., 1998, 19, 225–232 CrossRef CAS PubMed.
- B. Schweitzer, S. Roberts, B. Grimwade, W. Shao, M. Wang, Q. Fu, Q. Shu, I. Laroche, Z. Zhou, V. T. Tchernev, J. Christiansen, M. Velleca and S. F. Kingsmore, Nat. Biotechnol., 2002, 20, 359–365 CrossRef CAS PubMed.
- W. Shao, Z. Zhou, I. Laroche, H. Lu, Q. Zong, D. D. Patel, S. Kingsmore and S. P. Piccoli, J. Biomed. Biotechnol., 2003, 5, 299–307 CrossRef PubMed.
- B. Schweitzer, S. Wiltshire, J. Lambert, S. OQMalley, K. Kukanskis, Z. Zhu, S. F. Kingsmore, P. M. Lizardi and D. C. Ward, Proc. Natl. Acad. Sci. U. S. A., 2000, 97, 10113–10119 CrossRef CAS PubMed.
- H. Zhou, K. Bouwman, M. Schotanus, C. Verweij, J. A. Marrero, D. Dillon, J. Costa, P. Lizardi and B. B. Haab, Genome Biol., 2004, 5, R28 CrossRef PubMed.
- J. Weiler, H. Gausepohl, N. Hauser, O. N. Jensen and J. D. Hoheisel, Nucleic Acids Res., 1997, 25, 2792–2799 CrossRef CAS PubMed.
- H. Shi, F. Yang, W. Li, W. Zhao, K. Nie, B. Dong and Z. Liu, Biosens. Bioelectron., 2015, 66, 481–489 CrossRef CAS PubMed.
- P. E. Nielsen, M. Egholm, R. H. Berg and O. Buchardt, Science, 1991, 254, 1497–1500 CrossRef CAS PubMed.
- V. V. Demidov, V. N. Potaman, M. D. Frank-Kamenetskii, M. Egholm, O. Buchard, S. H. Sonnichsen and P. E. Nielsen, Biochem. Pharmacol., 1994, 48, 1310–1313 CrossRef CAS.
- M. Egholm, O. Buchardt, L. Christensen, C. Behrens, S. M. Freier, D. A. Driver, R. H. Berg, S. K. Kim, B. Norden and P. E. Nielsen, Nature, 1993, 365, 566–568 CrossRef CAS PubMed.
- P. Wittung, P. E. Nielsen, O. Buchardt, M. Egholm and B. Norden, Nature, 1994, 368, 561–563 CrossRef CAS PubMed.
- A. Ray and B. Norden, FASEB J., 2000, 14, 1041–1060 CrossRef CAS PubMed.
- H. Jang, J. Kim, J.-j. Choi, Y. Son and H. Park, J. Clin. Microbiol., 2010, 48, 3127–3131 CrossRef CAS PubMed.
- J. S. Park, H. K. Na, D. H. Min and D. E. Kim, Analyst, 2013, 138, 1745–1749 RSC.
- R. S. Swathi and K. L. Sebastian, J. Chem. Phys., 2008, 129, 054703 CrossRef CAS PubMed.
- C. Hong, D.-M. Kim, A. Baek, H. Chung, W. Jung and D. E. Kim, Chem. Commun., 2015, 51, 5641–5643 RSC.
- K. Roh, D.-M. Kim, E. H. Lee, H. Kim, H. S. Park, J.-H. Jang, S.-H. Hwang and D.-E. Kim, Chem. Commun., 2015, 51, 6960–6963 RSC.
- C. Hong, A. Baek, S. S. Hah, W. Jung and D. E. Kim, Anal. Chem., 2016, 88, 2999–3003 CrossRef CAS PubMed.
- Y. Wang, H. Deng, Y. Liu, X. Shi, A. Liu, H. Peng, G. Hong and W. Chen, Biosens. Bioelectron., 2016, 80, 140–145 CrossRef CAS PubMed.
- D. Tasis, N. Tagmatarchis, A. Bianco and M. Prato, Chem. Rev., 2006, 106, 1105–1136 CrossRef CAS PubMed.
- C. Zhao, T. Hoppe, M. K. H. G. Setty, D. Murray, T. W. Chun, I. Hewlett and D. H. Appella, Nat. Commun., 2014, 5, 5079 CrossRef CAS PubMed.
- M. Xu, S. Xing, X. Xu, P. Fu, W. Xu and C. Zhao, Anal. Methods, 2018, 10, 3824–3829 RSC.
- W. Xu, S. Xing, X. Xu, M. Xu, P. Fu, T. Gao and C. Zhao, ACS Omega, 2018, 3, 17835–17841 CrossRef CAS.
- L. Xue, J.-J. Fei, Y. Song, R.-H. Xu and Y.-J. Bai, Scand. J. Clin. Lab. Invest., 2014, 74, 1–7 CrossRef PubMed.
Footnotes |
| † Electronic supplementary information (ESI) available. See DOI: 10.1039/c9ra06758b |
| ‡ Xiaojun Xu and Shu Xing contributed equally to this work. |
|
| This journal is © The Royal Society of Chemistry 2019 |
Click here to see how this site uses Cookies. View our privacy policy here. 
 Open Access Article
 This Open Access Article is licensed under a Creative Commons Attribution-Non Commercial 3.0 Unported Licence
 *a
*a