 Open Access Article
Cyanate ester composites containing surface functionalized BN particles with grafted hyperpolyarylamide exhibiting desirable thermal conductivities and a low dielectric constant†
Xiuyun Zhang ,
Fan Wang,
Yaping Zhu and
Huimin Qi*
Key Laboratory of Specially Functional Polymeric Materials and Related Technology of Ministry of Education, School of Materials Science and Engineering, East China University of Science & Technology, Shanghai 200237, China. E-mail: qihm@ecust.edu.cn
First published on 8th November 2019
Abstract
Surface functionalized BN particles with grafted hyperbranched polyarylamide (BN-HBP) were prepared and used to improve the thermal conductivity and low dielectric constant of BN-filled cyanate ester resin (BN-HBP/CE) composites. The thermal stability, dielectric properties, thermal conductivity and dynamic mechanical properties of the BN-HBP/CE composites were investigated. The results illustrate that BN-HBP/CE composites with a load of 32 wt% exhibit a high glass transition temperature of 283 °C, low dielectric constant of 3.29 at 1 MHz, and a desirable thermal conductivity of 0.97 W/(m·K). Additionally, these novel materials exhibit a high decomposition temperature of 5% weight loss at 407 °C and low curing shrinkage of −0.64%. When the loading is 38 wt%, the thermal conductivity of BN-HBP/CE composites is 1.27 W/(m·K). These findings have significant implications for the preparation of high-performance substrates that meet the requirements for application as printed circuit board substrates.
1. Introduction
Printed circuit board (PCB) and microelectronic packaging technology play pivotal roles in the development of electronics technology.1,2 Faster running speeds and higher power usage of electronic devices cause higher heat generation during operation, and thus the heat dissipation problem is increasingly prominent with newer technologies and the devices that employ them.1 Previous research has established that a low dielectric constant helps to increase signal transmission speed.3 There is a growing body of literature that recognizes the importance of creating materials capable of high thermal conductivity in conjunction with a low dielectric constant while also exhibiting the valuable properties of excellent electrical insulation and thermal stability known in PCB substrates.Developing an ideal substrate for PCBs has been the subject of many classic studies. PCB substrates have mainly used polyimide resin, epoxy resin (EP) or polytetrafluoroethylene. Most of the current research is aimed at studying high-content filler epoxy composites. These composites are some of the most widely used resins in microelectronic packaging and PCBs. However, the main disadvantage of EP is that the thermal stability and dielectric constant cannot fully satisfy the application requirements of PCBs. In recent years, there has been an increasing interest in cyanate esters (CE) due to their excellent properties. CE resins have a small polarity and avoid depolarization due to their highly symmetric triazine rings, which makes CE has a low dielectric constant. The stable network of triazine rings render CEs highly heat resistant with a thermal decomposition temperature near 410 °C. Therefore, CE resins possess broad application prospects. However, almost all polymers have low thermal conductivity (around 0.2);4,5 it is thus necessary to improve the thermal conductivity of CE resins. At present, the most common method for improving the thermal conductivity of polymers is by adding highly thermally conductive inorganic particles to the polymers. Most studies in the field of CE have only focused on altering the dielectric properties by using fillers; to date, there have been few studies on its thermal conductivity.6–9 Electrically insulating thermally conductive fillers is necessary to ensure the dielectric properties of PCBs. For example, the silica-filled cyanate composites prepared by Wooster et al.10 exhibited a thermal conductivity of about 0.4 W/(m·K) and a dielectric constant of more than 4 with a load of 60 wt%. Commonly used inorganic non-metallic fillers include alumina, silica, boron nitride (BN) and carbon nanotubes.11 BN has high thermal conductivity and low dielectric constant (ε is about 4) along with excellent thermal stability and electrical insulation. Compared with other commonly used fillers, these excellent properties make BN a strong candidate for use in a host of broad applications in the PCB field.12,13
The filled thermal conductive polymer is composed of a two-phase system. The properties of the matrix, the filler and the interfacial interaction determine the properties of the composites.14 The interface properties have received considerable attention. Extensive research has shown that BN sheets are easy to agglomerate in the polar polymer due to the weak forces between the BN sheets.15 A lack of active groups on the surface of BN causes poor compatibility between BN and polymers. The weak interfacial adhesion is accompanied by interface defects, which can cause interface phonon scattering which manifests as an interfacial thermal resistance.16,17 Thus far, many scholars have studied the properties of BN-filled composites.12,18 Huang and Ishida13 studied the effects of BN surface modification on the polymerization and dynamic mechanical properties of benzooxazinyl composites. Huang et al.4 prepared epoxy composites via surface treatment of BN. With the loading of 30 wt%, the thermal conductivity of the composite is about 0.8 W/(m·K), the dielectric constant is greater than 4, and the dielectric loss is greater than 0.02. Wu and Kessler19 used polydopamine modified BN to prepare the composites of bisphenol E cyanate resin with a thermal conductivity of 0.55 W/(m·K) and a dielectric constant of more than 3.7 when the BN content was 28 wt%. In addition, the surface modification reduces the thermal conductivity of the composites to about 0.5 W/(m·K). There has been no detailed investigation of the impact of BN on the dielectric properties of cyanate ester.
Although the surface treatment of BN has been widely implemented to improve the thermal conductivity for CEs, most studies in the research literature directly use a method of grafting a silane coupling agent on the surface of BN. One of the main problems with this method is that due to the inert surface of BN, a significant increase in thermal conductivity is not seen in the resulting composites. Most studies concerning PCB have only focused on the thermal conductivity of composites. The second problem in the existing research is that the addition of BN increases the dielectric constant of the composites, which affects the transmission speed of signal. In addition, studies have shown that BN will precipitate during curing of the resin; this also reduces the dielectric properties of the composites due to a large increase in the viscosity of the resin.
The main challenge faced by today's researchers is to find an effective surface modification that maximizes the advantage of BN (high thermal conductivity) while improving dielectric properties of the composites. In this study, surface functionalized BN particles (BN-HBP) were prepared by grafting hyperbranched polyarylamide onto the surface of BN particles (herein referred to as BN-HBP). The surface rigidity of the BN-HBP polyarylamide backbone could play a better role in heat transfer, minimizing phonon scattering at the interface.20–22 Therefore the thermal conductivity could be improved and dielectric constant could be reduced. In addition, the surface modification of BN in the present work reduces the surface energy of the particles and reduces the processing viscosity of the composite. In the process, the in situ polymerization method promotes uniform dispersion of BN-HBP and slows down the sedimentation of BN during the curing process. This paper analyses the impact of filler content and surface functionalization on the dielectric and thermal properties of the composites, as well as its effect on the curing behavior and thermal stability of the composites.
2. Experimental
2.1 Materials
Dicyanate of bisphenol A (CE): melting point 80–81 °C, purity 99.5%, was made in our laboratory. 3,5-Diaminobenzoic acid and triphenyl phosphite were purchased from Meryer (Shanghai) Chemical Technology Co., Ltd., Shanghai, China. Pyridine, N-methyl pyrrolidone, pyridine, ethanol and N,N-dimethylformamide were purchased from Titan Technology Co., Ltd., Shanghai, China. Methanol and 3-aminopropyl triethoxy-silane (KH550) were purchased from Shanghai Aladdin Bio-Chem Technology Co., Ltd., Shanghai, China. BN particles were purchased from Yingkou Tianyuan Chemical Research Institute Co., Ltd., Shanghai, China. The average particle size was 10 μm.2.2 Preparation of surface functionalized BN particles
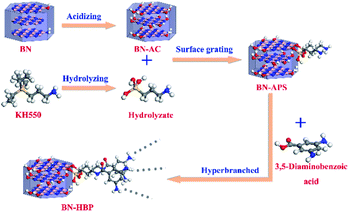
Surface functionalized BN particles were prepared with three steps: (1) weakening of B–N bonds; (2) treatment with a silane coupling agent; and (3) hyperbranched grafting. The prepared process of BN surface functionalization is shown in Fig. 1.BN particles were introduced into a solution of concentrated sulfuric acid and concentrated nitric acid (volume ratio 1![[thin space (1/6-em)]](https://www.rsc.org/images/entities/char_2009.gif) :
:![[thin space (1/6-em)]](https://www.rsc.org/images/entities/char_2009.gif) 3). The mixture was stirred at 80 °C for 80 h. Next, the BN particles were rinsed with water until the pH was neutral. The BN particles were then dried for 24 h at 65 °C under vacuum. Finally, the acidified BN particles were obtained. The acid-treated BN particles are henceforth referred to as BN-AC.
3). The mixture was stirred at 80 °C for 80 h. Next, the BN particles were rinsed with water until the pH was neutral. The BN particles were then dried for 24 h at 65 °C under vacuum. Finally, the acidified BN particles were obtained. The acid-treated BN particles are henceforth referred to as BN-AC.
KH-550 (BN weight of 2.4%) was added to 95% ethanol solution and stirred for 10 min. The BN-AC were then introduced into the solution and stirred at 60 °C for 7 h. After filtering the mixture, the particles were dried for 10 h at 60 °C under vacuum to obtain treated BN particles. KH550 (3-aminopropyl triethoxysilane) treated BN particles are referred to as BN-APS.
3,5-Diaminobenzoic acid was dissolved in 50 mL N-methyl pyrrolidone (NMP), then 7.5 mL pyridine and 9 g triphenyl phosphite were separately added to the solution. Three grams of BN-APS particles were then discharged into the system and the reaction was carried out for 4 h at 100 °C under nitrogen conditions. After cooling the BN particles to room temperature, they were washed three times with methanol, N,N-dimethylformamide and again with methanol, respectively. Finally, the BN particles were dried in a vacuum for 12 h at 90 °C. The obtained surface functionalized BN particles are referred to as BN-HBP.
2.3 Preparation of BN-HBP/CE composites
The BN filled CE resins were obtained via molten blending and prepolymerization of surface functionalized BN particles and CE resins. CE resins (45 g) was heated at 90 °C to a molten state in a flask. Next, a given weight of BN-HBP particles were gradually added to the resin and stirred for 1.5 h until the BN particles were completely dispersed in the resin. The resin was prepolymerized while sequentially stirring for 2 h at 100 °C, for 1 h at 120 °C, and for 2 h at 130 °C. A light yellow opaque viscous BN filled CE resin was thus obtained.The fluidized BN-filled CE resins were cast in a mold preheated to 110 °C in an oven. They were cured and post cured in the following sequence: 2 h at 140 °C, 2 h at 160 °C, 2 h at 180 °C, 2 h at 210 °C, and 2 h at 230 °C. Yellow opaque BN-HBP/CE composites were thus obtained.
2.4 Characterizations
Fourier-transform infrared (FTIR) spectra were recorded on a Nicolet 6700 spectrometer (Thermo Fisher) in the range of 4000–400 cm−1 at resolution of 0.09 cm−1.The tested samples were made by grounding BN with KBr and then compressing the mixture into pellets. An X-ray photoelectron spectrometer (XPS; Thermo Fisher, USA) was employed to perform surface characterization of BN particles. Differential scanning calorimetric (DSC) analysis was obtained using a PerkinElmer Diamond DSC with a 7–10 mg of sample at a scanning rate of 10 °C min−1 from 30 °C to 35 °C under nitrogen flow. A scanning electron microscope (SEM, Hitachi S-4800) was employed to observe the morphologies of the fractured surfaces of the composites. Thermal gravimetric analysis was performed on a TA instrument SDT Q600 by using 8–15 mg samples at the heating rate of 5 °C min−1 from 25 °C to 1000 °C under nitrogen flow (70 mL min−1). Dynamic mechanical analysis (DMA) using samples with dimensions of 45 × 8.5 × 2.5 mm was performed on a Mettler-Toledo (Switzerland) in a three-point-blending mode with the following conditions: a temperature range of 50–300 °C, a heating rate of 5 °C min−1 from 50 °C to 300 °C, an amplitude of 15 μm, and a frequency of 1 Hz. Dielectric properties of the samples (Φ30 × 1.1 mm) were measured on a broadband dielectric spectrometer (Novocontrol Concept 40, Germany) at room temperature over a frequency range from 1 to 107 Hz.
The curing shrinkage of the samples' resin was obtained from testing the density before curing and after curing by a densitometer (METTLER TOLEDO ME204E). The calculation formula for shrinkage is as follows:
Thermal conductivity measurements of the samples (Φ30 × 1.5 ± 0.5 mm) were measured using a Netzsch LFA447 according to the ASTM E1461 at room temperature. The thermal conductivity is calculated by the product of thermal diffusivity and the specific heat and density, where the density was measured by volume exclusion.
3. Results and discussion
3.1 Preparation and characterization of surface functionalized BN particles
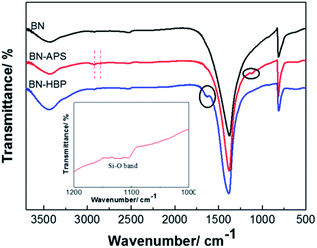
Surface modification of fillers has been demonstrated to be an efficient method for improving the interface properties of inorganic fillers and resins. However, for BN particles, surface treatment is difficult due to its chemical inertness. Herein, the BN particles were treated with strong acid, silane coupling agent KH550 and grafting polymerization of 3,5-diaminobenzoic acid. The chemical reaction process of BN surface functionalization is shown in Fig. 1. Acid treatment effectively weakens B–N bonds; the B atom at the edge of BN is activated. An –OH group can be bonded to the electron-deficient B atom, and then, the functional group can be introduced on the BN surface. The coupling agent can be hydrolyzed into NH2(CH2)3SiOH, forming an oligomeric structure via the dehydration condensation reaction. Hydrogen bonds can be formed between the oligomer structure and the OH groups on the surface of the BN-AC, which can further form a partial covalent bond by a dehydration reaction. Finally, the surface of the BN-AC is covered by the silane coupling agent. BN-APS is a white to yellowish powder. Polyarylamide can be successful grafted by the amino group on the surface of BN-APS, further improving the interfacial compatibility between BN and CE. More importantly, the rigidity polyarylamide backbone plays a strong role in heat transfer.The chemical structure and morphology of the as-prepared surface functionalized BN particles were characterized by FTIR, TGA, XPS and SEM. Fig. 2 shows the FTIR spectrum of BN raw materials, BN-APS and BN-HBP. All of the FT-IR spectra show two distinct absorption bands at 1370 cm−1 and 817 cm−1 which represent B–N stretching vibrations and B–N–B bending vibrations, respectively.23 In the FTIR spectrum of BN-APS, the C–H band is found at 2926 cm−1 and 2852 cm−1.24 The Si–O band is found at 1100 cm−1, which is due to the dehydration condensation between OH groups on the surface of BN-AC and the OH groups produced by the hydrolysis of the coupling agent.25 New peaks are observed at 1626 cm−1 in the FT-IR spectrum of BN-HBP as a result of the reaction between amino groups on the surface of BN-APS and benzoic acid monomers.26 Compared with the raw BN, the appearance of the new peaks in the FTIR spectrum of BN-APS and BN-HBP clearly demonstrates that the BN surface has been successfully functionalized by the silane coupling agent and hyperbranched polymer.
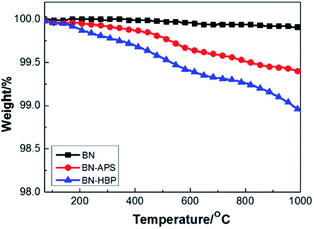
The TGA curves of BN raw materials, BN-APS and BN-HBP were shown in Fig. 3. BN-HBP exhibits obvious weight loss under about 400 °C. At 1000 °C, the mass residue of the BN-HBP samples is 98.9% compared with the BN raw materials (99.9%). Successful grafting of hyperbranched polyarylamide on the BN surface can be further illustrated.
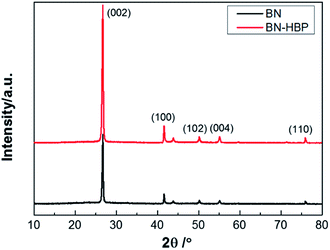
Fig. 4 shows the XRD patterns of BN and BN-HBP particles. The diffraction peak shape and position of BN and BN-HBP are completely the same. The obvious peak observed are assigned to the diffraction peaks of BN corresponding to the crystal faces of (002), (100), (102), (004) and (110). XRD results indicates that the surface functionalization of BN does not change its basic characteristics.
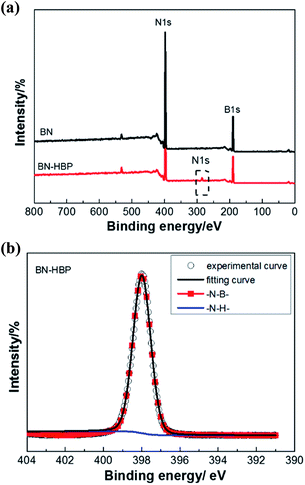
To confirm the above discussion, XPS of BN-HBP was performed and is shown in Fig. 5. The ratio between the concentrations of each element is summarized in the Table 1. In addition to B 1s and N 1s, C 1s can be clearly observed in the spectrum of BN-HBP. It can be seen from Fig. 5(b), which shows the core level spectrum of N 1s. The N 1s spectrum of BN-HBP is divided into two independent peaks: B–N bonds are represented at 398 eV and N–H bonds are represented at 401.9 eV.27,28 The presence of C and O elements also demonstrates the success of surface functionalization.
| Elemental | B 1s | N 1s | C 1s | O 1s | Si 2p |
| Chemical composition/% | 52.5 | 42.1 | 3.2 | 2.1 | 0.2 |
Table 2 shows the results of elemental analysis. The data show that the N content of BN-HBP particles is relatively decreased and the content of C is increased.
| Sample | N/% | C/% |
|---|---|---|
| BN | 56.6 | 0.9 |
| BN-HBP | 41.5 | 4.2 |
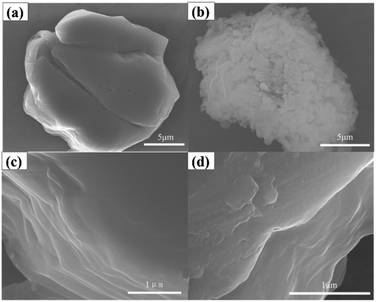
In addition to the above characterization, morphological studies can clearly indicate the difference between BN and BN-HBP, as shown in Fig. 6. It can be seen that BN is a multi-layered BN sheet laminated in the shape of a hexagonal sheet. BN-HBP shows an uneven surface and increased edge roughness compared with the smoother raw BN. The rougher BN-HBP helps to disperse BN in the matrix and improve the interfacial properties of the composites.
3.2 Preparation and characterization of surface functionalized BN particles
The BN-HBP/CE resins were obtained via molten blending and prepolymerizing surface functionalized BN particles and CE resin. To understand the effect of the BN-HBP filler on the BN-HBP/CE resins and BN-HBP/CE composites, BN-HBP/CE resins with different loading contents of BN-HBP particles were prepared, as shown in Table 3. All BN-HBP/CE resin samples were homogeneous and stratified. As the content of BN-HBP increased, the viscosity of the BN-HBP/CE resin increased, and the fluidity gradually decreased. When the content of BN-HBP was less than 35%, the BN-HBP/CE resin had good fluidity and exhibited good processing performance.| Sample | CE (%) | BN-HBP (%) | Samples state/110 °C | Density (g mL−1) (before cured) | Density (g mL−1) (after cured) | Shrinkage (%) |
|---|---|---|---|---|---|---|
| CE | 100 | 0 | Excellent fluidity | 1.208 | 1.234 | 2.11 |
| BN-HBP10/CE | 90 | 10 | Great fluidity | — | — | — |
| BN-HBP20/CE | 80 | 20 | Good fluidity | — | — | — |
| BN-HBP25/CE | 75 | 25 | General fluidity | 1.363 | 1.338 | −1.87 |
| BN-HBP32/CE | 68 | 32 | General fluidity | 1.423 | 1.414 | −0.64 |
| BN-HBP35/CE | 65 | 35 | Less fluidity | 1.444 | 1.448 | −0.42 |
| BN-HBP38/CE | 62 | 38 | Poor fluidity | 1.455 | 1.448 | −0.48 |
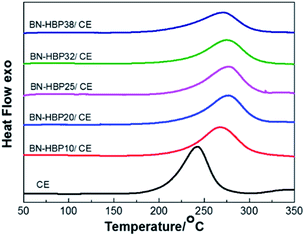
The cure behavior and curing shrinkage of the BN-HBP/CE resins were exanimated. The DSC of the BN-HBP/CE resins are shown in Fig. 7. All BN-HBP/CE resins exhibit a single exothermic peak, which is characteristic of the CE resin curing process. The peak temperature of neat CE resin is 243 °C; the BN-HBP/CE resin showed a higher value for the exothermic peak temperature, from 267 °C to 277 °C. This indicates that the CE molecular chain on the BN-HBP surface requires more energy to participate in the curing reaction. Thus, the polymerization of the CE molecular chain on the surface of BN-HBP is hindered.29 One possible explanation involves molecular mobility restrictions occurring at the BN-HBP surface. The grafted polymers are intertwined with the CE molecular chain, resulting in the need for more supplied energy to increase the mobility of functional groups such that they are in close enough proximity to one another to react.30
The curing shrinkage of BN-HBP/CE resins were investigated, as shown in Table 3. The curing shrinkage of the neat CE resin is 2.11%. The value is −0.64% with BN-HBP particle loading of 32 wt%. In comparison, the shrinkage of BN-HBP35/CE composite is −0.42%, thus there is a great improvement of the dimensional stability in the composites.
3.3 Structure and properties of BN-HBP/CE composites
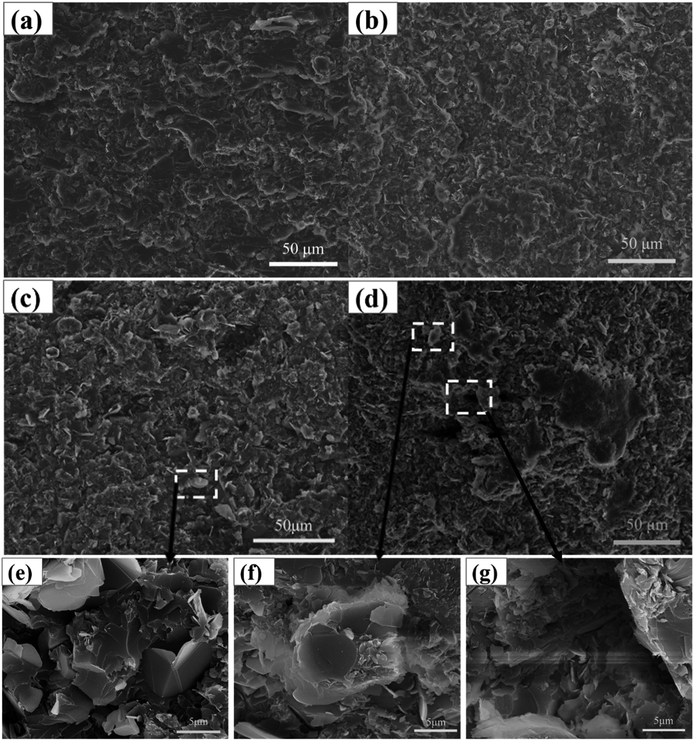 | ||
| Fig. 8 SEM images of the fracture surfaces of (a) BN-HBP15/CE, (b) BN-HBP25/CE, (c) BN-HBP32/CE, (d) BN32/CE, (e) BN-HBP32/CE, (f and g) BN32/CE. | ||
When the content of BN is 32 wt%, the number of holes and bare BN on the fracture surface of the BN32/CE composites increases significantly. When the BN32/CE composite was observed at higher magnification, no resin encapsulation was seen in the agglomerated BN, it was less compatible with the matrix (Fig. 8f), and the surface of the pores were smooth. These features indicate poor interfacial adhesion of the composite (Fig. 8g). In contrast, surface functionalization of BN improves its dispersion in CE (Fig. 8a–c). When the BN-HBP content was increased from 15 wt% to 32 wt%, the cross-section of composites has almost no holes or cracks. When the BN-HBP32/CE composite was observed at a higher magnification, it can be seen that the BN-HBP is embedded in the CE matrix; the surface of the filler is well wrapped with the resin (Fig. 8e). This further proves that the surface functionalization effectively improves the dispersion of BN and reduces the defects of the composites, resulting in enhanced interfacial compatibility and interfacial adhesion. These findings confirm our conclusion.
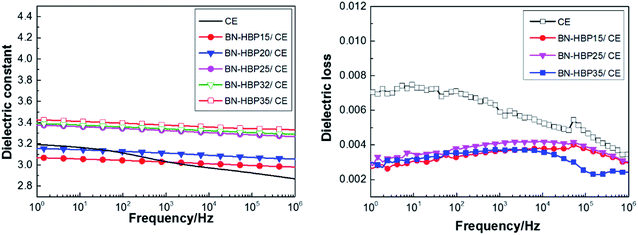
It can be observed from Fig. 9(a and b) that BN-HBP/CE composites show a low dielectric constant and stable dielectric loss. At a frequency of 1 MHz, BN-HBP/CE composites with a load of 32 wt% exhibit a lower ε value (3.29). This is mainly because the BN-HBP surface is coated with hyperbranched polyarylamide, which strengthens the organic–inorganic interfacial adhesion and reduces the interfacial polarization.14,37 Moreover, surface functionalization allows BN-HBP to be uniformly dispersed amongst the CE matrix, thus reducing the sedimentation of BN during the curing process. This offsets the adverse effect on the dielectric properties resulting from the introduction of BN-HBP.38 We concluded that the surface functionalization of BN particles could improve the dielectric properties of BN-HBP/CE composites.
| Sample | Thermal conductivity/W/(m·K) | Thermal diffusivity/(mm2 s−1) | Specific heat/(J g−1 K−1) |
|---|---|---|---|
| CE | 0.197 | 0.134 | 1.218 |
| BN-HBP15/CE | 0.385 | 0.292 | 1.024 |
| BN-HBP20/CE | 0.587 | 0.399 | 1.111 |
| BN-HBP25/CE | 0.689 | 0.533 | 0.967 |
| BN-HBP32/CE | 0.968 | 0.675 | 1.025 |
| BN-HBP38/CE | 1.270 | 0.826 | 1.050 |
Compared with the pure CE resin, the λ is 0.197 W/(m·K), the value of BN-HBP38/CE composite is 1.27 W/(m·K), and the thermal conductivity increases by 545%. It was found that the presence of BN-HBP contributed to the thermal conductivity of the composites. According to covalent bonding theory, the hyperbranched polyaramid polymer on the surface of BN-HBP plays a bridging role between BN and CE.42
This increases the chemical cross-linking point in the three-dimensional network and reduces the thermal resistance of the interface. Meanwhile, the grafted polymer on the surface of BN-HBP also reduces the mismatch of modulus between BN-HBP and the CE matrix.43 In addition, dispersion of the filler in the CE matrix may affect the thermal conductivity of the composites.44–46 As shown in Fig. 8, BN-HBP clearly exhibits more uniform dispersion, increased wettability and good interfacial compatibility.3,40
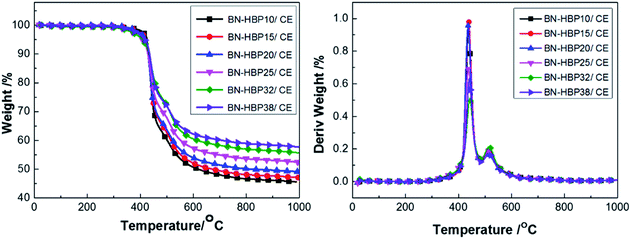
When the BN-HBP loading is low (10%), the thermal stability of the composites is improved. A small amount of BN-HBP blocks the CE molecular chain, which reduces the steric hindrance of CE in the late polymerization and promotes CE crosslinking. An increase in crosslink density hinders internal thermal motion, which increases Td5. When the content continues to increase, introduction of BN-HBP destroys the crosslinked structure of the CE, thus increasing the distance between cross-linking points and reducing crosslink density; this leads to a decreased Td5.
Fig. 11(a) shows the effect of BN-HBP content on the storage modulus (E′) of the BN-HBP/CE composites across a temperature range. The E′ of all BN-HBP/CE composites in the glass state is higher than that of the neat CE resin, and the E′ is observed to increase with increasing BN-HBP content. This can be attributed to the BN-HBP fillers which have a high storage modulus and limit the movement of CE molecules in the composites.47 In addition, the physical entanglement and chemical reaction between the surface of the BN-HBP particles and the CE molecular chain improves the interfacial adhesion, further restricts the movement of polymer chains, and thus further increases the storage modulus of BN-HBP/CE composites.
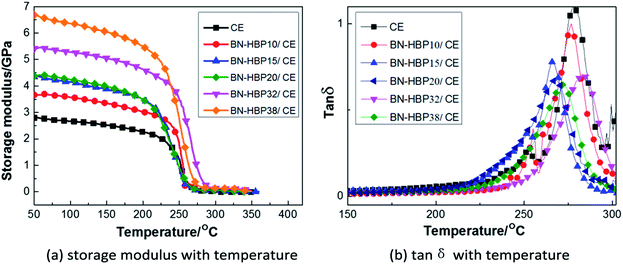 | ||
Fig. 11 DMA curves for BN-HBP/CE composites with various fillers (a) storage modulus with temperature (b) tan![[thin space (1/6-em)]](https://www.rsc.org/images/entities/char_2009.gif) δ with temperature. δ with temperature. | ||
Herein, the glass transition temperature (Tg) of BN-HBP/CE composites is defined as the peak temperature of the tan![[thin space (1/6-em)]](https://www.rsc.org/images/entities/char_2009.gif) δ–temperature plot shown in Fig. 11(b). The Tg of neat CE resin is 278 °C, and that of the BN-HBP/CE composites decreases with increasing content of BN-HBP fillers. However, when the content of BN-HBP fillers exceeds 20%, the Tg of BN-HBP/CE composites do not decrease but increase slightly. As known, the Tg of composites is closely related to the crosslink density of the resin,48 and is reduced with decreasing cross-linking density.37,49,50 For BN-HBP/CE composites, as described above, introduction of BN-HBP particles hinders the curing reaction of the CE resin and reduces the cross-linking density. Thus the Tg of BN-HBP/CE composites decreased with increasing BN-HBP content. However, we found that Tg decreases when the content of BN-HBP exceeds 32%. This is attributed to an increase in particle–particle interaction caused by reduction of the distance between adjacent particles.47
δ–temperature plot shown in Fig. 11(b). The Tg of neat CE resin is 278 °C, and that of the BN-HBP/CE composites decreases with increasing content of BN-HBP fillers. However, when the content of BN-HBP fillers exceeds 20%, the Tg of BN-HBP/CE composites do not decrease but increase slightly. As known, the Tg of composites is closely related to the crosslink density of the resin,48 and is reduced with decreasing cross-linking density.37,49,50 For BN-HBP/CE composites, as described above, introduction of BN-HBP particles hinders the curing reaction of the CE resin and reduces the cross-linking density. Thus the Tg of BN-HBP/CE composites decreased with increasing BN-HBP content. However, we found that Tg decreases when the content of BN-HBP exceeds 32%. This is attributed to an increase in particle–particle interaction caused by reduction of the distance between adjacent particles.47
4. Conclusions
This study provides new insights into BN surface modification. The project was undertaken to design surface functionalized BN, evaluate its influence on the dielectric properties and thermal conductivity of the resultant composites. The results of this investigation show that successful grafting of BN surface rigid polymers optimizes the heat transfer process, and reduces the interfacial polarization and thermal resistance. In addition, BN-HBP/CE composites are shown to possess a lower dielectric constant and lower dielectric loss. The synthesized BN-HBP32/CE composites exhibits a dielectric constant of 3.29 at 1 MHz, a desirable λ of 0.97 W/(m·K) with Td5 of 407 °C as well as the highest Tg of 283 °C. When the loading is 38 wt%, the λ of BN-HBP/CE composites is 1.27 W/(m·K) Furthermore, BN surface modification greatly improves the dimensional stability of composites. BN-HBP32/CE composites possess a low shrinkage of −0.64%. An issue that was not addressed in this study is the evaluation of the grafting rate of the polymer on the BN surface. In addition, further studies need to be carried out in order to determine the type of chemical bond formed on the surface of BN-HBP with CE.Conflicts of interest
There are no conflicts to declare.Acknowledgements
This work is supported by Key Laboratory of Specially Functional Polymeric Materials and Related Technology of Ministry of Education, East China University of Science & Technology, and supported by the Fundamental Research Funds for the Central Universities (50321041918013, 50321041917001).Notes and references
- J. M. Hutchinson, F. Roman, P. Cortes and Y. Calventus, Polimery, 2017, 62, 560–566 CrossRef CAS
.
- K. C. Yung and H. Liem, J. Appl. Polym. Sci., 2007, 106, 3587–3591 CrossRef CAS
.
- W. Ling, A. Gu, G. Liang and L. Yuan, Polym. Compos., 2010, 31, 307–313 CAS
.
- X. Huang, P. Peng, W. Peng, j. Yu, f. Liu and P. Jiang, International Conference on Condition Monitoring & Diagnosis, 2010, vol. 31, pp. 307–313 Search PubMed
.
- Y. Ohki, IEEE Electr. Insul. Mag., 2010, 26, 48–49 Search PubMed
.
- H. Wu, A. Gu, G. Liang and L. Yuan, J. Mater. Chem., 2011, 21, 14838–14848 RSC
.
- W. Yuan, W. Li, Y. Mu and M. B. Chan-Park, ACS Appl. Mater. Interfaces, 2011, 3, 1702–1712 CrossRef CAS
.
- K. Liang, G. Li and T. Hossien, Chem. Mater., 2006, 18, 301–312 CrossRef CAS
.
- F. Chao, G. Liang, W. Kong and X. Zhang, Mater. Chem. Phys., 2008, 108, 306–311 CrossRef CAS
.
- T. J. Wooster, S. Abrol, J. M. Hey and D. R. MacFarlane, Composites, Part A, 2004, 35, 75–82 CrossRef
.
- A. Rybak and K. Gaska, J. Mater. Sci., 2015, 50, 7779–7789 CrossRef CAS
.
- J. Hou, G. Li, N. Yang, L. Qin, M. E. Grami, Q. Zhang, N. Wang and X. Qu, RSC Adv., 2014, 4, 44282–44290 RSC
.
- M. T. Huang and H. Ishida, J. Polym. Sci., Part B: Polym. Phys., 1999, 37, 2360–2372 CrossRef CAS
.
- S. Kemaloglu, G. Ozkoc and A. Aytac, Thermochim. Acta, 2010, 499, 40–47 CrossRef CAS
.
- K. Kim, M. Kim, Y. Hwang and J. Kim, Ceram. Int., 2014, 40, 2047–2056 CrossRef CAS
.
- R. J. Warzoha and A. S. Fleischer, Nano Energy, 2014, 6, 137–158 CrossRef CAS
.
- N. Tsutsumi, N. Takeuchi and T. Kiyotsukuri, J. Polym. Sci., Part A: Polym. Chem., 1991, 29, 1085–1093 CrossRef CAS
.
- H. L. Lee, O. H. Kwon, S. M. Ha, B. G. Kim, Y. S. Kim, J. C. Won, J. Kim, J. H. Choi and Y. Yoo, Phys. Chem. Chem. Phys., 2014, 16, 20041–20046 RSC
.
- H. Wu and M. R. Kessler, ACS Appl. Mater. Interfaces, 2015, 7, 5915–5926 CrossRef CAS
.
- B. I. Voit and A. Lederer, Chem. Rev., 2010, 41, 5924–5973 Search PubMed
.
- C. Wu, X. Huang, G. Wang, X. Wu, K. Yang, S. Li and P. Jiang, J. Mater. Chem., 2012, 22, 7010–7019 RSC
.
- H. Zhang, Y. Dong, L. Wang, G. Wang, J. Wu, Y. Zheng, H. Yang and S. Zhu, J. Mater. Chem., 2011, 21, 13530–13537 RSC
.
- L. Gao and J. Li, J. Am. Ceram. Soc., 2003, 86, 1982–1984 CrossRef CAS
.
- M. Labet, W. Thielemans and A. Dufresne, Biomacromolecules, 2007, 8, 2916–2927 CrossRef CAS
.
- F. Milanesi, G. Cappelletti and R. Annunziata, J. Phys. Chem. C, 2010, 114, 8287–8293 CrossRef CAS
.
- L. An, Y. Pan, X. Shen, H. Lu and Y. Yang, J. Mater. Chem., 2008, 18, 4928–4941 RSC
.
- S. Y. Kim, J. Park, H. C. Choi, J. P. Ahn, J. Q. Hou and H. S. Kang, J. Am. Chem. Soc., 2007, 129, 1705–1716 CrossRef CAS
.
- T. Sainsbury, T. Ikuno, D. Okawa and D. Pacilé, J. Phys. Chem. C, 2007, 111, 341–357 CrossRef
.
- Y. S. Lipatov, E. G. Moisya and G. M. Semenovich, Polymer, 1975, 16, 582–584 CrossRef CAS
.
- Z. Petrović and N. Stojaković, Polym. Compos., 1988, 9, 42–50 CrossRef
.
- Y. Zhang and C. Jia, Ceram. Int., 2019, 45, 6491–6498 CrossRef CAS
.
- W. Zhou, P. Xiao, Y. Li and L. Zhou, Ceram. Int., 2013, 39, 6569–6576 CrossRef CAS
.
- J. Gu, S. Xu, Q. Zhuang, Y. Tang and J. Kong, IEEE Trans. Dielectr. Electr. Insul., 2017, 24, 784–790 CAS
.
- J. P. Adohi, C. Guillermin and P. Rain, Conference on Electrical Insulation & Dielectric Phenomena, IEEE, 2004, pp. 158–161 Search PubMed
.
- Y. Lei, Z. Han, D. Ren, H. Pan, M. Xu and X. Liu, Macromol. Res., 2018, 26, 602–608 CrossRef CAS
.
- J. P. Eloundou, Eur. Polym. J., 2002, 38, 431–438 CrossRef CAS
.
- Y. Gao, A. Gu, Y. Jiao, Y. Yang, G. Liang, J.-t. Hu, W. Yao and L. Yuan, Polym. Adv. Technol., 2012, 23, 919–928 CrossRef CAS
.
- W. Yu, H. Xie and D. Bao, Nanotechnology, 2010, 21, 055705 CrossRef
.
- Y. Guo and S. N. Leung, Mater. Chem. Phys., 2018, 214, 221–228 CrossRef CAS
.
- G.-W. Lee, M. Park, J. Kim, J. I. Lee and H. G. Yoon, Composites, Part A, 2006, 37, 727–734 CrossRef
.
- D. P. H. Hasselman and L. F. Johnson, J. Compos. Mater., 1987, 21, 508–515 CrossRef
.
- L. Zhai, Z. Liu, C. Li, X. Qu, Q. Zhang, G. Li, X. Zhang and B. Abdel-Magid, RSC Adv., 2019, 9, 5722–5730 RSC
.
- W. Cui, F. Du, J. Zhao, W. Zhang, Y. Yang, X. Xie and Y.-W. Mai, Carbon, 2011, 49, 495–500 CrossRef CAS
.
- W. Zhou, S. Qi, Q. An, H. Zhao and N. Liu, Mater. Res. Bull., 2007, 42, 1863–1873 CrossRef CAS
.
- T. H. Chiang and T. E. Hsieh, J. Inorg. Organomet. Polym. Mater., 2006, 16, 175–183 CrossRef CAS
.
- A. Patti, P. Russo, D. Acierno and S. Acierno, Composites, Part B, 2016, 94, 350–359 CrossRef CAS
.
- S. Kwon, T. Adachi, W. Araki and A. Yamaji, Acta Mater., 2006, 54, 3369–3374 CrossRef CAS
.
- N. Tagami, M. Hyuga, Y. Ohki, T. Tanaka, T. Imai, M. Harada and M. Ochi, IEEE Trans. Dielectr. Electr. Insul., 2010, 17(7), 214–220 CAS
.
- W. K. Goertzen and M. R. Kessler, Composites, Part A, 2008, 39, 761–768 CrossRef
.
- A. Permal, M. Devarajan, L. H. Huong, T. Zahner, D. Lacey and K. Ibrahim, Polym. Compos., 2018, 39, E1372–E1380 CrossRef CAS
.
Footnote |
| † Electronic supplementary information (ESI) available. See DOI: 10.1039/c9ra06753a |
| This journal is © The Royal Society of Chemistry 2019 |

