 Open Access Article
Rutin-modified silver nanoparticles as a chromogenic probe for the selective detection of Fe3+ in aqueous medium†
Mayra S. Coutinhoa,
Eloah Latocheskib,
Jannyely M. Neria,
Ana C. O. Nevesa,
Josiel B. Domingos b,
Lívia N. Cavalcantia,
Luiz H. S. Gasparotto
 a,
Edgar P. Moraes
 a and
Fabrício G. Menezes
 *a
*a
aInstitute of Chemistry, Federal University of Rio Grande do Norte, Natal, 59072-970, RN, Brazil. E-mail: fgmenezes10@gmail.com
bDepartment of Chemistry, Federal University of Santa Catarina, Florianópolis, 88040-900, SC, Brazil
First published on 23rd September 2019
Abstract
The development of nanoprobes for selective detection of metal ions in solution has attracted great attention due to their impact on living organisms. As a contribution to this field, this paper reports the synthesis of silver nanoparticles modified with rutin in the presence of ascorbic acid and their successful use as a chromogenic probe for the selective detection of Fe3+ in aqueous solution. Limits of detection and quantification were found to be 17 nmol L−1 and 56 nmol L−1, respectively. The sensing ability is proposed to proceed via an iron-induced nanoparticle growth/aggregation mechanism. A practical approach using image analysis for quantification of Fe3+ is also described.
Metal ions are key species in nature due to their essential functions in living organisms.1,2 On the other hand, heavy metals as well as essential metals at abnormally high levels are toxic.2 Iron, for instance, in addition to its popular use in industry and construction, is essential to the human body and active in biological processes. Although the trivalent form of iron is particularly important for oxygen transport in blood and the mitochondrial respiratory chain, high levels of this cation are associated with important pathologies.3,4 The detection of metal ions in aqueous solution is traditionally performed by methods including atomic absorption spectrometry,5 electrochemical measurements,6,7 and inductively coupled plasma techniques,8 among others. However, these techniques have important drawbacks, notably the need for sophisticated instrumentation, in addition to being time-consuming and requiring laborious procedures. To overcome these issues, the development of chromogenic and fluorogenic chemosensors for the selective detection of metal-targets has attracted great attention, especially due to the possibility of fast, sensitive and non-expensive analysis.9,10 In the last decade, nanoscaled materials have been reported as selective probes for metal ions, including Fe3+.11–24
Silver nanoparticles (AgNPs) are of particular interest because of the affordable price of starting materials, ease of controlling size and morphology, possibility to functionalize their surface with organic molecules, and optical properties that enable detection of a variety of analytes via simple UV-vis spectroscopy and digital image analysis. Furthermore, applications of AgNPs are also biotechnologically relevant due to the possibility of green synthetic protocols, including the use of plant extracts,25 natural sources,26 glycerol,27 among others.
Flavonoids are secondary metabolites naturally found in fruits and other vegetables with relevant roles due to their nutritional, pharmaceutical and medicinal properties.28 Because of their adequate structural features, flavonoids are candidates to be employed in the synthesis of AgNPs.26 Rutin (RU), a sugar-based flavonoid, may be employed as reducing agent in the synthesis of AgNPs along with a stabilizer such as polyvinylpyrrolidone (PVP)26 or used as crude plant extract component.29,30
This paper reports the use of RU-modified AgNPs (RU-AgNPs) as a chromogenic probe for Fe3+ in aqueous medium in the presence of ascorbic acid (AA). Sensing ability of RU-AgNPs for the selective detection of Fe3+ toward other metal cations was investigated with UV-vis spectroscopy analysis. These data and transmission electronic microscopy (TEM) results allowed a mechanistic proposal involved in the selective detection of Fe3+ by RU-AgNPs. Furthermore, a practical approach based on correlation of images of solutions obtained with a conventional smartphone and chemometrics was employed for a simpler quantification of Fe3+ in aqueous medium.
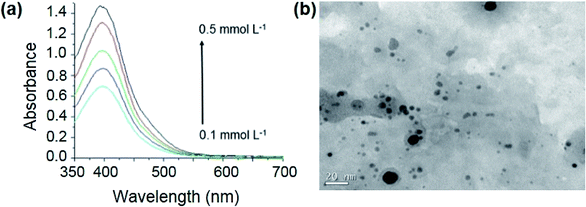
Initially, the order of reagent combination was investigated in the synthesis of RU-AgNPs. Concentration of RU ranged from 0.10 to 0.50 mmol L−1, while concentrations of other components were fixed at 0.20 mmol L−1 AgNO3, 0.10 mmol L−1 AA and 0.10 M NaOH. Water was used as solvent in all cases. Narrower surface plasmon resonance (SPR) bands were obtained from adding a solution of AA and NaOH to a solution containing RU and AgNO3 (Fig. 1a) against the addition of RU, AA, and NaOH to AgNO3 solution (Fig. S1a – ESI†), or the addition of RU and NaOH to a solution of AA and AgNO3 (Fig. S1b†). RU-AgNPs obtained from the condition presented in Fig. 1a are small (4.1 nm average diameter) and considerably polydisperse (standard deviation of 4.7 nm), however, presenting only one population (Fig. 1b and S2†). A study of the influence of RU concentration (0.10 to 0.50 mmol L−1) on the stability of RU-AgNPs over time indicated that 0.10 mmol L−1 RU generates more stable RU-AgNPs (Fig. S3†). Next, a study on the influence of pH indicated that RU-AgNPs are only stable under strong alkaline conditions (pH 12.5 or higher) (Fig. S4†).
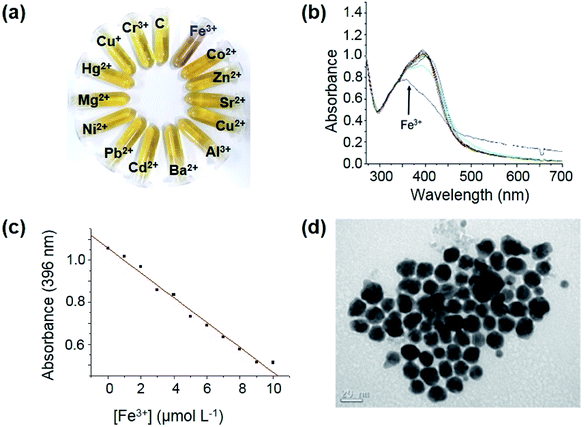
The ability of RU-AgNPs to sense metal cations was investigated by both naked-eye and UV-vis spectroscopy analysis (Fig. 2). The separate addition of 10 μmol L−1 of several metal cations (Fe3+, Co2+, Zn2+, Sr2+, Cu2+. Al3+, Ba2+, Cd2+, Pb2+, Ni2+, Mg2+, Hg2+, Cu+ and Cr3+) to solutions of RU-AgNPs (prepared according to Fig. 1a) indicated that only Fe3+ induces a significant colorimetric change in the final aspect of solution after 50 minutes (Fig. 2a).
The results presented in Fig. 2a are consistent with the UV-vis spectroscopy analysis (Fig. 2b). Co2+ ions also induce some change in the system, however at a considerably smaller extension than Fe3+. In this study, AA played a crucial role in the selective detection of Fe3+ by the referred nanoprobe. In the absence of AA, Co2+ (mainly) as well as other cations induce stronger colorimetric and spectral changes (Fig. S5a and b,† respectively) in the analysis of solutions of RU-AgNPs when compared to the system containing AA. This selectivity may arise from two possible reasons: (i) preservation of RU by avoiding its oxidation in the reduction of Ag+ ions; (ii) coordination of ascorbate anion to cations other than Fe3+.
Interaction of RU-AgNPs and Fe3+ (10 μmol L−1) stabilizes after approximately 40 minutes (Fig. S6†). Next, a calibration curve was built from the direct relationship between the absorbance at 396 nm and the concentration of Fe3+ (Fig. 2c), presenting a good correlation (R2 = 0.9929). The limits of detection and quantification were found to be 17 nmol L−1 and 56 nmol L−1, respectively, which is very satisfactory.13,14 The influence of other cations in the detection of Fe3+ was investigated by UV-vis spectroscopy. Fig. S7† clearly demonstrates that there are only small changes when a second cation (30 μmol L−1) is added together with Fe3+ to the RU-AgNPs solution.
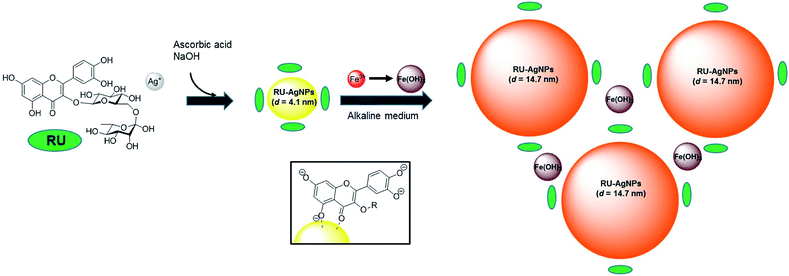
Mechanistically, the detection of Fe3+ by RU-AgNPs in aqueous medium proceeds via a growth/aggregation-combined process. This proposal is first evidenced by UV-vis analysis due the suppression of SPR band (Fig. 2b), a behavior consistent with the literature.31,32 Interestingly, TEM analysis clearly shows a growth in AgNPs size after addition of Fe3+ to the solution (Fig. 2d), resulting in a final single AgNPs population with average diameter of 14.7 nm ± 8.9 nm. Due to the strong alkaline medium, the main specie responsible for the behavior of NPs is likely to be Fe(OH)3. A schematic illustration of the mechanism involving aggregation of RU-AgNPs induced by the addition of Fe3+ is presented in Fig. 3. AgNPs are initially formed by adsorption of anionic RU to the silver surface via deprotonated 5-hydroxychromen-4-one moiety. This is supported by the literature33 and confirmed by alteration in the 1800–1500 cm−1 region of the RU infrared spectra before and after coordination with silver (Fig. S9†). Afterwards, the addition of Fe3+ induces the formation of a coordination complex through an anionic catechol group, in which at least 2![[thin space (1/6-em)]](https://www.rsc.org/images/entities/char_2009.gif) :
:![[thin space (1/6-em)]](https://www.rsc.org/images/entities/char_2009.gif) 1 ligand–Fe3+ stoichiometry is required for an aggregated effect.
1 ligand–Fe3+ stoichiometry is required for an aggregated effect.
 | ||
| Fig. 3 Mechanistic proposal for growth/aggregation of RU-AgNPs in the presence of Fe3+. Insert: binding model for RU-AgNPs. | ||
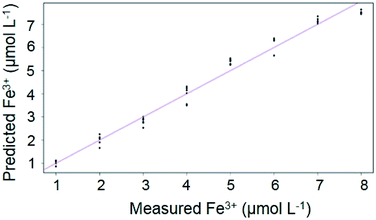
Due to increasing interest in image processing as an analytical tool for many purposes,34,35 Multiple Linear Regression was employed to verify the capacity of the RU-AgNPs to probe Fe3+ standards at distinct concentrations, as presented in Fig. 4. The curve was obtained by plotting the color absorbances RGB-based values versus the concentrations of Fe3+ standards after RU-AgNPs interaction. Predicted iron is a vector based on RGB values that were then extracted from the filtered images and inserted in the equation described by Beer–Lambert law in order to generate the absorbances for the construction of the analytical curve. A linear behavior between the predicted response and the measured concentrations was observed (R2 = 0.9806).
 | ||
| Fig. 4 Calibration curve for Fe3+ analysis showing the predicted iron (RGB) vs. iron(III) concentration (1 to 8 μmol L−1). Adjusted R2 = 0.9806. | ||
Regression coefficients of the calibration model (using the R, G and B channels simultaneously) obtained by MLR method are shown in eqn (1):
| [Fe3+] = 44.5R − 4.9G − 16.4B + 5.1 | (1) |
It is possible to observe an interesting performance of the method using the three RGB color channels allied with MLR to quantify the Fe3+ content, which presented reasonable deviations in its responses considering that it is simple and low-cost. The good linearity is similar to other colorimetric methods such as sodium determination in seawater and coconut water (R2 > 0.91) by Moraes and coauthors,36 or iron(II) in simulated seawater (R2 = 0.9993) by Gasparotto et al.37
Second order regression was applied to the dataset to obtain a better adjustment, resulting in an adjusted R-squared of 0.9955. RGB values were then inserted in eqn (2) in order to generate the construction of the correlation:
| [Fe3+] = 14.4R + 30.7G − 23.4B − 398RG − 348RB − 0.8BG − 978R2 + 695G2 + 26.9B2 + 4.5 | (2) |
This paper reports the use of AgNPs functionalized with RU as nanoprobes for selective detection and sensitive quantification of Fe3+ in aqueous solution. The synthesis of RU-AgNPs is reproducible, easily performed and requires no stabilizer agent other than RU. AA has a crucial role in the selectivity by either the avoidance of oxidation of RU by silver and/or coordination of ascorbate with other cations. The literature brings relevant examples of chromogenic and fluorogenic chemosensors for selective detection of Fe3+ in solution. Many of these artificial organic receptors present high selectivity and relevant limits of detection, requiring, however, very specific reagents and laborious synthetic procedures.38–41 Metal-based nanoparticles have emerged as potential probes for detection of Fe3+.11–16 Although effective in Fe3+ sensing, the synthesis of these nanoprobes require some toxic reagents, such as NaBH4 or PVP, use plant extracts, which may lead to some drawbacks, such as the understanding of the sensing mechanism. In contrast, our method is based on commercially available, nontoxic, low-cost reagents. Fe3+ sensing performed satisfactorily in the 1–10 μmol L−1 range, and the limit of detection obtained with this method (17 nmol L−1) is comparable to the most sensitive methods reported in literature. A mechanism for the detection of Fe3+ by RU-AgNPs involves a combined growth/aggregation of the NPs. There is a still limited number of nanoscaled systems reported as being selective and sensitive in the detection of Fe3+, which reinforces the relevance of the method reported herein. The linearity range obtained by both UV-vis spectroscopy and image analysis comprises the maximum of residual Fe3+ in drinking water according to the European and US legislations.15,42
Conflicts of interest
There are no conflicts to declare.Acknowledgements
The authors thank the Brazilian entities Conselho Nacional de Pesquisa e Desenvolvimento (CNPq), Conselho de Aperfeiçoamento de Pessoal de Nível Superior (CAPES – Finance code 001) and Financiadora de estudos e Projetos (FINEP) for financial support. This work was also supported by the Central Laboratory of Electron Microscopy (LCME) at UFSC.Notes and references
- M. Ahmed, M. Faisal, A. Ihsan and M. M. Naseer, Analyst, 2019, 144, 2480 RSC.
- J. Zhang, F. Cheng, J. Li, J. J. Zhu and Y. Lu, Nano Today, 2016, 11, 309 CrossRef CAS PubMed.
- T. Wei, J. Liu, H. Yao, Q. Lin, Y. Xie, B. Shi, P. Zhang, X. You and Y. Zhang, Chin. J. Chem., 2013, 31, 515 CrossRef CAS.
- N. Abbaspour, R. Hurrell and R. Kelishadi, J. Res. Med. Sci., 2014, 19, 164 Search PubMed.
- B. Welz, M. G. R. Vale, É. R. Pereira, I. N. B. Castilho and M. B. Dessuy, J. Braz. Chem. Soc., 2014, 25, 799 CAS.
- M. Lu, N. V. Rees, A. S. Kabakaev and R. G. Compton, Electroanalysis, 2012, 24, 1693 CAS.
- M. Sander, T. B. Hofstetter and C. A. Gorski, Environ. Sci. Technol., 2015, 49, 5862 CrossRef CAS PubMed.
- L. Poirier, J. Nelson, D. Leong, L. Berhane, P. Hajdu and F. Lopez-linares, Energy Fuels, 2016, 30, 3783 CrossRef CAS.
- D. T. Quang and J. S. Kim, Chem. Rev., 2010, 110, 6280 CrossRef CAS PubMed.
- H. Zhu, J. Fan, B. Wang and X. Peng, Chem. Soc. Rev., 2015, 44, 4337 RSC.
- S. Ghosh, S. Maji and A. Mondal, Colloids Surf., A, 2018, 555, 324 CrossRef CAS.
- A. Jain, S. Wadhawan, V. Kumar and S. K. Mehta, Chem. Phys. Lett., 2018, 706, 53 CrossRef CAS.
- S. S. Memon, A. Nafady, A. R. Solangi, A. M. Al-Enizi, Sirajuddin, M. R. Shah, S. T. H. Sherazi, S. Memon, M. Arain, M. I. Abro and M. I. Khattak, Sens. Actuators, B, 2018, 259, 1006 CrossRef CAS.
- S. P. Wu, Y. P. Chen and Y. M. Sung, Analyst, 2011, 136, 1887 RSC.
- J. Li, Q. Wang, Z. Guo, H. Ma, Y. Zhang, B. Wang and D. Bin, Sci. Rep., 2016, 6(1), 23558 CrossRef CAS PubMed.
- B. A. Makwana, D. J. Vyas, K. D. Bhatt, V. K. Jain and Y. K. Agrawal, Spectrochim. Acta, Part A, 2015, 134, 73 CrossRef CAS PubMed.
- Z. Du, B. Song, W. Zhang, C. Duan, Y. Wang, C. Liu, R. Zhang and J. Yuan, Angew. Chem., Int. Ed., 2018, 57, 3999 CrossRef CAS PubMed.
- H. Jia, X. Gao, Y. Shi, N. Sayyadi, Z. Zhang, Q. Zhao, Q. Meng and R. Zhang, Spectrochim. Acta, Part A, 2015, 149, 674 CrossRef CAS PubMed.
- H. Feng, Z. Zhang, Q. Meng, H. Jia, Y. Wang and R. Zhang, Adv. Sci., 2018, 5, 1800397 CrossRef PubMed.
- H. Feng, Y. Wang, J. Liu, Z. Zhang, X. Yang, R. Chen, Q. Meng and R. Zhang, J. Mater. Chem. B, 2019, 7, 3909 RSC.
- H. Feng, Q. Meng, Y. Wang, C. Duan, C. Wang, H. Jia, Z. Zhang and R. Zhang, Chem.–Asian J., 2018, 13, 2611 CrossRef CAS PubMed.
- Y. Jiao, J. Yin, H. He, X. Peng, Q. Gao and C. Duan, J. Am. Chem. Soc., 2018, 140, 5882 CrossRef CAS PubMed.
- Y. Wang, R. Song, K. Guo, Q. Meng, R. Zhang, X. Kong and Z. Zhang, Dalton Trans., 2016, 45, 16616 RSC.
- Q. Han, J. Liu, Q. Meng, Y. Wang, H. Feng, Z. Zhang, Z. P. Xu and R. Zhang, ACS Sens., 2019, 4, 309 CrossRef CAS PubMed.
- A. Roy, O. Bulut, S. Some, A. K. Mandal and M. D. Yilmaz, RSC Adv., 2019, 9, 2673 RSC.
- E. A. Terenteva, V. V. Apyari, S. G. Dmitrienko and Y. A. Zolotov, Spectrochim. Acta, Part A, 2015, 151, 89 CrossRef CAS PubMed.
- A. G. Garcia, P. P. Lopes, J. F. Gomes, C. Pires, E. B. Ferreira, R. G. M. Lucena, L. H. S. Gasparotto and G. Tremiliosi-Filho, New J. Chem., 2014, 38, 2865 RSC.
- M. L. Ferreyra, S. P. Rius and P. Casati, Front. Plant Sci., 2012, 3, 1 Search PubMed.
- S. Jain and M. S. Mehata, Sci. Rep., 2017, 7, 15867 CrossRef PubMed.
- A. Im, L. Han, E. R. Kim, J. Kim, Y. S. Kim and Y. Park, Phytother. Res., 2012, 26, 1249 CrossRef CAS PubMed.
- Y. Bhattacharjee, D. Chatterjee and A. Chakraborty, Sens. Actuators, B, 2018, 255, 210 CrossRef CAS.
- S. Manivannan, Y. Seo, D. Kang and K. Kim, New J. Chem., 2018, 42, 2007 RSC.
- Y. He, F. Wei, Z. Ma, H. Zhang, Q. Yang, B. Yao, Z. Huang, J. Li, C. Zeng and Q. Zhang, RSC Adv., 2017, 7, 39842 RSC.
- L. C. da Silva, D. F. de Lima, J. A. Silva, C. L. M. de Morais, B. L. Albuquerquem, A. J. Bortoluzzi, J. B. Domingos, R. M. Araújo, F. G. Menezes and K. M. G. Lima, J. Braz. Chem. Soc., 2016, 27, 1077 Search PubMed.
- C. L. M. Morais, A. C. O. Neves, F. G. Menezes and K. M. G. Lima, Anal. Methods, 2016, 8, 6458 RSC.
- E. P. Moraes, N. S. A. da Silva, C. L. M. de Morais, L. S. das Neves and K. M. G. Lima, J. Chem. Educ., 2014, 91, 1958 CrossRef CAS.
- E. P. Moraes, M. R. Confessor and L. H. S. Gasparotto, J. Chem. Educ., 2015, 92, 1696 CrossRef CAS.
- Z. Li, Y. Zhou, K. Yin, Z. Yu, Y. Li and J. Ren, Dyes Pigm., 2015, 105, 7 CrossRef.
- X. Han, D. Wang, S. Chen, L. Zhang, Y. Guo and J. Wang, Anal. Methods, 2015, 7, 4231 RSC.
- H. Jia, X. Gao, Y. Shi, N. Sayyadi, Z. Zhang, Q. Zhao, Q. Meng and R. Zhang, Spectrochim. Acta, Part A, 2015, 149, 674 CrossRef CAS PubMed.
- N. Sharma, S. I. Reja, N. Gupta, V. Bhalla, D. Kaur, S. Arora and M. Kumar, Org. Biomol. Chem., 2017, 15, 1006 RSC.
- A. J. Boguniewocz-Zablocka, I. Klosok-Bazan and V. Naddeo, Environ. Sci. Pollut. Res., 2019, 26, 1208 CrossRef PubMed.
Footnote |
| † Electronic supplementary information (ESI) available. See DOI: 10.1039/c9ra06653e |
| This journal is © The Royal Society of Chemistry 2019 |


