DOI:
10.1039/C9RA06607A
(Paper)
RSC Adv., 2019,
9, 41192-41208
Global metabolomic profiling of trastuzumab resistant gastric cancer cells reveals major metabolic pathways and metabolic signatures based on UHPLC-Q exactive-MS/MS†
Received
22nd August 2019
, Accepted 26th November 2019
First published on 13th December 2019
Abstract
Resistance mechanism exploration has become an urgent need owing to the widespread trastuzumab resistance in gastric cancer. In this study, UHPLC-Q exactive MS/MS was carried out to characterize the metabolic profiles of human gastric cancer cell lines NCI N87, MKN45 (trastuzumab-sensitive) and NCI N87/R, MKN45/R (trastuzumab-resistant), respectively. Metabolic signatures and different metabolites were identified using multivariate in combination with univariate analysis. Integrated pathway enrichment analysis was executed using MetaboAnalyst and KEGG metabolic libraries to analyze the altered metabolic pathways in trastuzumab resistant cells. A total of 79 and 75 different metabolites were positively identified by utilizing authentic standards in NCI N87/R and MKN45/R cells, respectively. Furthermore, enrichment analysis demonstrated that seven metabolic pathways in NCI N87/R cells and five in MKN45/R cells were significantly changed. These pathways are involved in amino acid, nucleotide, carbohydrate, cofactor and vitamin metabolism, of which alanine, aspartate and glutamate metabolism displayed the highest pathway impact and lower P value both in NCI N87/R and MKN45/R cells. Moreover, we constructed a metabolomics–proteomics network between substantially altered metabolites and target genes which revealed citrate being regulated by citrate synthase and ACLY, while proline regulation was due to EPRS, PYCRL and PYCR1/2, respectively. Overall, our findings disclose prominent alterations of metabolic signatures in NCI N87/R and MKN45/R cells when compared with the parent cells which are crucial for understanding of underlying mechanisms of resistance and for developing strategies to overcome trastuzumab resistance.
1. Introduction
Gastric cancer (GC), a common malignant carcinoma, is associated with fairly high mortality among all cancers worldwide due to the majority of GC cases being diagnosed at an advanced stage, which indicates a poor prognosis and limited treatment options. Despite many efforts to improve treatment strategies in the last ten years, GC faces intractability and dismal outcomes with a five-year survival rate of only 20–25%.1 Therefore, GC remains a major public health issue and gives rise to a serious societal healthcare burden.
Human epidermal growth factor receptor-2 (HER-2), a proto-oncogene, is an important therapeutic target of breast and gastric cancer. Previous studies have considered HER-2 over-expression a trigger of multiple cell signal transduction pathways, including PI3K,2 AMPK and other signaling events,3,4 which contribute to tumor aberrant proliferation and drug resistance, and therefore makes the follow-up treatment less effective. Trastuzumab, a humanized monoclonal antibody that directly targets the extracellular domain of HER-2 receptor, has been proven beneficial in patients with HER2-positive advanced gastric cancer. Unfortunately, the acquired resistance could hamper the effectiveness of trastuzumab after several months of treatment.5,6 Accordingly, it is imperative to reveal mechanisms of trastuzumab resistance and develop novel strategies to conquer resistance.
As it is well known, cancer cells acquire resistance against chemotherapy through a variety of mechanisms. These may involve gene mutation,7 activation of signaling pathways,8 alteration of tumor micro-environment and immune-surveillance evasion through immune-suppressive cells.9,10 In recent years, metabolic reprogramming in cancer cells has been considered a key character and a critical process in drug resistance.11 It is widely believed that cancer cells change metabolic signatures and metabolic pathways by monitoring nutrient uptake and energy sources to promote aerobic glycolysis and lactate production, termed “Warburg effect”, which has been recognized as a “hallmark” of cancer cells.8,12 Our previous proteomics demonstrated that acquired resistance to trastuzumab leads to distinct alterations of several signaling pathways in NCI N87/R and MKN45/R cells, out of which mTOR and Wnt/β-catenin were confirmed by further studies.13,14 Recently, we explored transcription factors related to trastuzumab resistance in NCI N87/R cells by liquid chromatography-mass spectrometry coupled with concatenated tandem array of transcription factor response elements (catTFRE) pull down proteomic technique. Our study indicated several transcription factors including TCF7L2, TCF7, FOXC1, JUN, MYC, FOS, ELK4, FOXC and DDIT3 had a crucial regulatory effect on epithelial–mesenchymal transformation (EMT), Wnt/β-catenin and MAPK signaling pathways contributing to trastuzumab-resistance.15 Despite all of this, the mechanism of metabolic pathways and metabolic signatures remains to be elucidated in trastuzumab resistant gastric cancer.
Metabolomics, an unremitting developing field in system biology and a complementary technique to genomics, transcriptomics and proteomics, has been regarded as an effective approach to quantify global or targeted endogenous metabolites for illuminating the ongoing metabolism by detecting biological specimens.16 It has been widely applied in various fields involving diagnosis of disease, identification of biomarkers and elucidation of physiological and pathophysiological processes.17,18 Although a growing number of studies on metabolic alterations in cancers by liquid chromatography-mass spectrometry (LC/MS), gas chromatography-mass spectrometry (GC/MS) and nuclear magnetic resonance (NMR) approach based on metabolomics have been reported, the mechanisms of cancer metabolism in the context of resistance have not been fully investigated.19,20 In this study, we performed a global metabolomics based on UHPLC-Q exactive-MS/MS integrated with multivariate statistical data analysis (MVDA) to explore alterations of metabolic signatures and metabolic pathways in NCI N87/R and MKN45/R cells. When compared to parental cells, 79 and 75 distinctive metabolites were identified in NCI N87/R cells and MKN45/R cells, respectively. Also discovered were seven metabolic pathways with noticeable change in NCI N87/R cells and five pathways in MKN45/R cells. Additionally, we extended our investigation into previous proteomics of trastuzumab resistance and described an integrated metabolomics–proteomics regulatory network to analyze potential mechanisms of trastuzumab resistance of NCI N87 and MKN45 cells in metabolic terms.
2. Experimental
2.1 Chemicals and reagents
LC grade methanol, acetonitrile, ammonium acetate and formic acid were purchased from CNW Technologies Inc. (CAS no: 67-56-1, 75-05-08, 631-61-8, 64-18-6, purity ≥ 99.9%, Shanghai, China). 2-Chloro-L-phenylalanine was obtained from Shanghai Heng-bai Biotech. Co. Ltd. (CAS no: 103616-893, purity ≥ 98%, Shanghai, China). Deionized water was produced by Mili-Q system (Millipore, Bedford, MA, USA). Antibodies against the following proteins were obtained for western blot: CS (Abcam, #96600, UK), EPRS (Abcam, #31513, UK), GAPDH (Cell Signaling, #5176, USA), horseradish peroxidase-labeled goat anti-rabbit secondary antibody was purchased from ZSGB-BIO (Beijing, China).
2.2 Cell cultures
Human gastric cancer cell line MKN45 was obtained from the State Key Laboratory of Proteomics (Beijing, China). Cell line NCI N87 was provided by Academy of Military Medical Sciences (Beijing, China). MKN45/R and NCI N87/R cell lines were constructed and preserved in our laboratory. All cells were cultured in Dulbecco's Modified Eagle's Medium (DMEM) (Gibco, New York, NY, USA) containing 10% fetal bovine serum (FBS) (Gibco, New York, NY, USA) and 1% penicillin–streptomycin at 37 °C in a humidified atmosphere with 5% CO2. NCI N87/R and MKN45/R cells were cultured in DMEM media containing 80 μg mL−1 trastuzumab throughout the study according to our previous protocols.14
2.3 Sample preparation and metabolites extraction
Cells were cultured in 6-well plates and harvested at a density of 1 × 10⁷ cells per well. After that cells were washed twice with pre-cooling PBS, and cell pellets were quickly transferred into a 2 mL EP tube. The metabolites were extracted with 1.0 mL pre-cooling mixed solvent (V acetonitrile![[thin space (1/6-em)]](https://www.rsc.org/images/entities/char_2009.gif) :V methanol:V water = 2:2:1) containing 20 μL of 2-chloro-L-phenylalanine (1 mg mL−1 stock in dd H2O) as internal standard. Then the samples were vortexed for 30 s, homogenized at 45 Hz for 4 min and sonicated for 5 min in ice-water bath, followed by incubation at −80 °C for 1 h and centrifugation at 12000 rpm for 15 min at 4 °C. Equal volume of supernatants (100 μL) were transferred to UHPLC/MS vials for analysis. Quality control (QC) samples were prepared by pooling equal amount of supernatants (20 μL) from each sample for UHPLC-Q exactive-MS/MS analysis. Every four samples were then inserted in one analytical batch to assess the stability of the system.
:V methanol:V water = 2:2:1) containing 20 μL of 2-chloro-L-phenylalanine (1 mg mL−1 stock in dd H2O) as internal standard. Then the samples were vortexed for 30 s, homogenized at 45 Hz for 4 min and sonicated for 5 min in ice-water bath, followed by incubation at −80 °C for 1 h and centrifugation at 12000 rpm for 15 min at 4 °C. Equal volume of supernatants (100 μL) were transferred to UHPLC/MS vials for analysis. Quality control (QC) samples were prepared by pooling equal amount of supernatants (20 μL) from each sample for UHPLC-Q exactive-MS/MS analysis. Every four samples were then inserted in one analytical batch to assess the stability of the system.
2.4 UHPLC-Q exactive-MS/MS analysis
Separation of the metabolites was performed using an UHPLC system (1290, Agilent Technologies) equipped with a Waters ACQUITY HSS T3 column (2.1 mm × 100 mm, 1.8 μm) coupled to Q exactive-MS/MS (Thermo). The mobile phase for chromatographic separation consisted of (A) deionized water containing 0.1% formic acid for positive ion mode, and deionized water containing 5 mmol L−1 ammonium acetate for negative ion mode and (B) acetonitrile. The elution gradient was set as follows: 0–1 min, 1% B; 1–8 min, 1–99% B; 8–10 min, 99% B; 10–10.1 min, 99–1% B; 10.1–12.0 min, 1% B. The flow rate was 0.5 mL min−1. The injection volume was 2 μL. The column temperature was maintained at 35 °C. The UHPLC system was coupled to Q exactive-MS/MS equipped with a dual electrospray ionization probe sourced to both ESI+ and ESI−. The MS full scan (MS1) data was executed in both ionization modes with a resolution of 70000, an AGC target of 1 × 10⁶, a maximum injection time of 100 ms, with spray voltage of 4.0 kV in ESI+, and −3.6 kV in ESI−, capillary temperature 400 °C, sheath gas flow rate 45 Arb and auxiliary gas flow rate 15 Arb., sweep gas flow rate 1 a.u. MS/MS (MS2) data was processed with a resolution of 17500, an AGC target of 1 × 10⁵, a maximum injection time of 60 ms, a loop count of 10, a TopN of 10, an isolation window of 2.0 m/z, and the dynamic exclusion of 10 s. All mass spectra were analyzed at 20, 40, 60 normalized collisional energy (NCE) and at 40 with 50% of a stepped energy which effectively combined fragments at energy of 20, 40 and 60. The acquisition software (Xcalibur 4.0.27, Thermo) continuously analyzed the full scan survey MS data while collecting and triggering the acquisition of MS/MS spectra depending on preselected criteria. Data acquisition was performed in the mode of information-dependent acquisition and dynamic background subtraction. The detection was carried out over a mass range of 50–1400 m/z.
2.5 Data extraction and processing
Raw data (raw files) from metabolite fingerprinting were converted into the mzML files using Proteo Wizard MS converter (version 3.0) (http://proteowizard.sourceforge.net/downloads.shtml) and then processed by XCMS software (v.3.6, https://xcmsonline.scripps.edu). The data pre-treatment of XCMS involved peak extraction, baseline calibration, peak alignment, peak identification, retention time (RT) correction and integration of peak area. The parameters setting was as follows: centWave method setting for feature detection (ppm = 20 ppm, minimum peak width = 5 s, maximum peak width = 20 s, signal/noise threshold = 4, mzdiff = 0.01, integration method = 2, and prefilter peaks = 3); Obiwarp method setting for RT correction (ProfStep = 1), parameters for chromatogram alignment (mzwid = 0.025, minfrac = 0.5, bw = 5, and minsamp = 1). Then data matrix including RTs, m/z values and peak intensity was obtained and performed using pairwise comparison. Internal standard normalization was employed to linearly shift the RT across the entire run for metabolite analysis. OSI-SMMS (v.1.0, Dalian Chem Data Solution Information Technology Co. Ltd.) was used for peak annotation after XCMS data processing with in-house MS/MS database. After processing the missing values for each sample with the 80% rule, mean-centering and Pareto-scaling were applied for all data sets.21 Subsequently, the data matrix was uploaded into the Metaboanalyst (http://www.metaboanalyst.ca) for further analysis.22 Metabolites were identified by matching MS/MS spectral similarity with scores greater than or equal to 0.8 (the score range 0–1) based on an in-house commercial database which includes over 2000 standard endogenous compounds.
2.6 Western blot
Western blot was performed according to standard protocols as described previously.13,14 To put it briefly, cells were collected and lysed with RIPA lysis buffer (50 mM Tris, 150 mM NaCl, 1% Triton X-100, 1% sodium deoxycholate, 0.1% SDS, Beyotime) containing 1% protease inhibitor. Then lysates were centrifuged at 12000g for 15 min at 4 °C, and the supernatants were collected for further use. Thirty micrograms (30 μg) of proteins were denatured in loading buffer and loaded on a gel after which SDS-PAGE was performed. Resolved bands were transferred to nitrocellulose membranes which were incubated with anti-CS, anti-EPRS and GAPDH respectively at 4 °C overnight followed by incubation with HRP-labeled goat anti-rabbit secondary antibodies. Finally, the bands were visualized using enhanced chemiluminescence reagent (CWBIO, China). The grey values of these target bands were measured using Image J software and histograms were plotted using GraphPad Prism software 7.04 (GraphPad Prism software, Inc. San Diego, USA).
2.7 Data analysis
Unsupervised principal component analysis (PCA) was utilized to display the separation of origin data. Supervised orthogonal partial least square discriminant analysis (OPLS-DA) was implemented to obtain maximal covariance between variables and sample category in both positive and negative models. After pareto scaling and validation by 7-fold cross-validation and 200 permutation tests, variable importance in the projection (VIP) value was obtained from each variable in the OPLS-DA model. Variables with VIP > 1 were further analyzed by independent-samples two-tail Student's t-tests to evaluate the significance of each variable. Fold change (FC) was calculated using average relative peak intensities in resistant group/parental group. SPSS 19.0 software (SPSS Inc., Chicago, IL, USA) was implemented for statistical analysis of the normalized values to determine metabolic changes with significant difference between resistant and parental cells. Variables with VIP > 1.0, fold change ≥ 1.2 or ≤0.83 and p value < 0.05 were defined as differential metabolites. All data were presented as mean ± SEM and were shown using GraphPad Prism 7.04 software. The KEGG (http://www.genome.jp/kegg) was explored to enrich metabolic pathways. OmicsNet website (https://www.omicsnet.ca/) was applied to integrate networks from differential metabolites and regulatory target genes. MetaboAnalyst was used to analyze metabolic pathway setting the cutoff of pathway impact value from the topology analysis to 0.2.22
3. Results
3.1 Data quality analysis
A reliable analytical method and a steady detecting platform are indispensable to ensure high-quality data in term of metabolomics. For this reason, PCA, which is a multivariate pattern recognition technique, was performed on all samples as an assessment of the stability in this study. The results displayed all QC samples from PCA tightly clustered in score plot in both positive (POS) and negative (NEG) modes (Fig. 1A, D, G and J) while the extracted total ion chromatograms (TICs) from all QC samples showed well-overlapped, similar chromatographic shape and no drift in retention time during the whole process (Fig. S1†). The high correlation (r > 0.9) of peak areas from QC samples demonstrated a good reproducibility and stability in POS and NEG modes (Fig. S2†). Moreover, a standard compound (2-chloro-L-phenylalanine) was also used simultaneously to evaluate the stability and repeatability of the method (Fig. S3†) with the relative standard deviations (RSD) of peak areas being 4.53% in POS mode and 1.88% in NEG mode, respectively (Table S1†). These results demonstrate that UHPLC-Q exactive-MS/MS are highly stable and reproducible throughout our study.
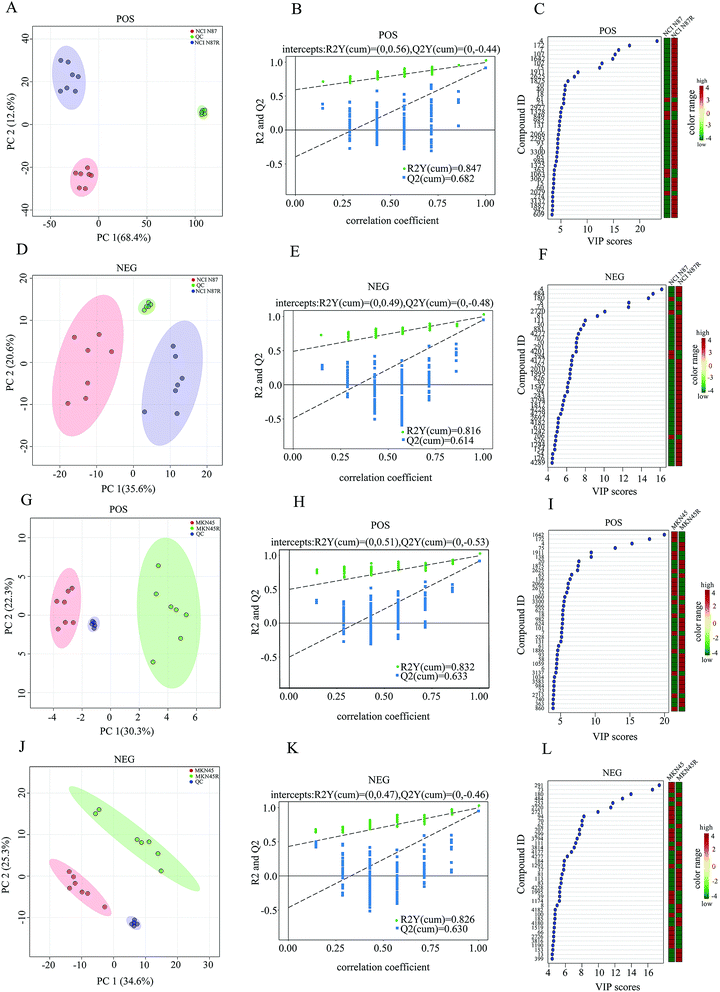 |
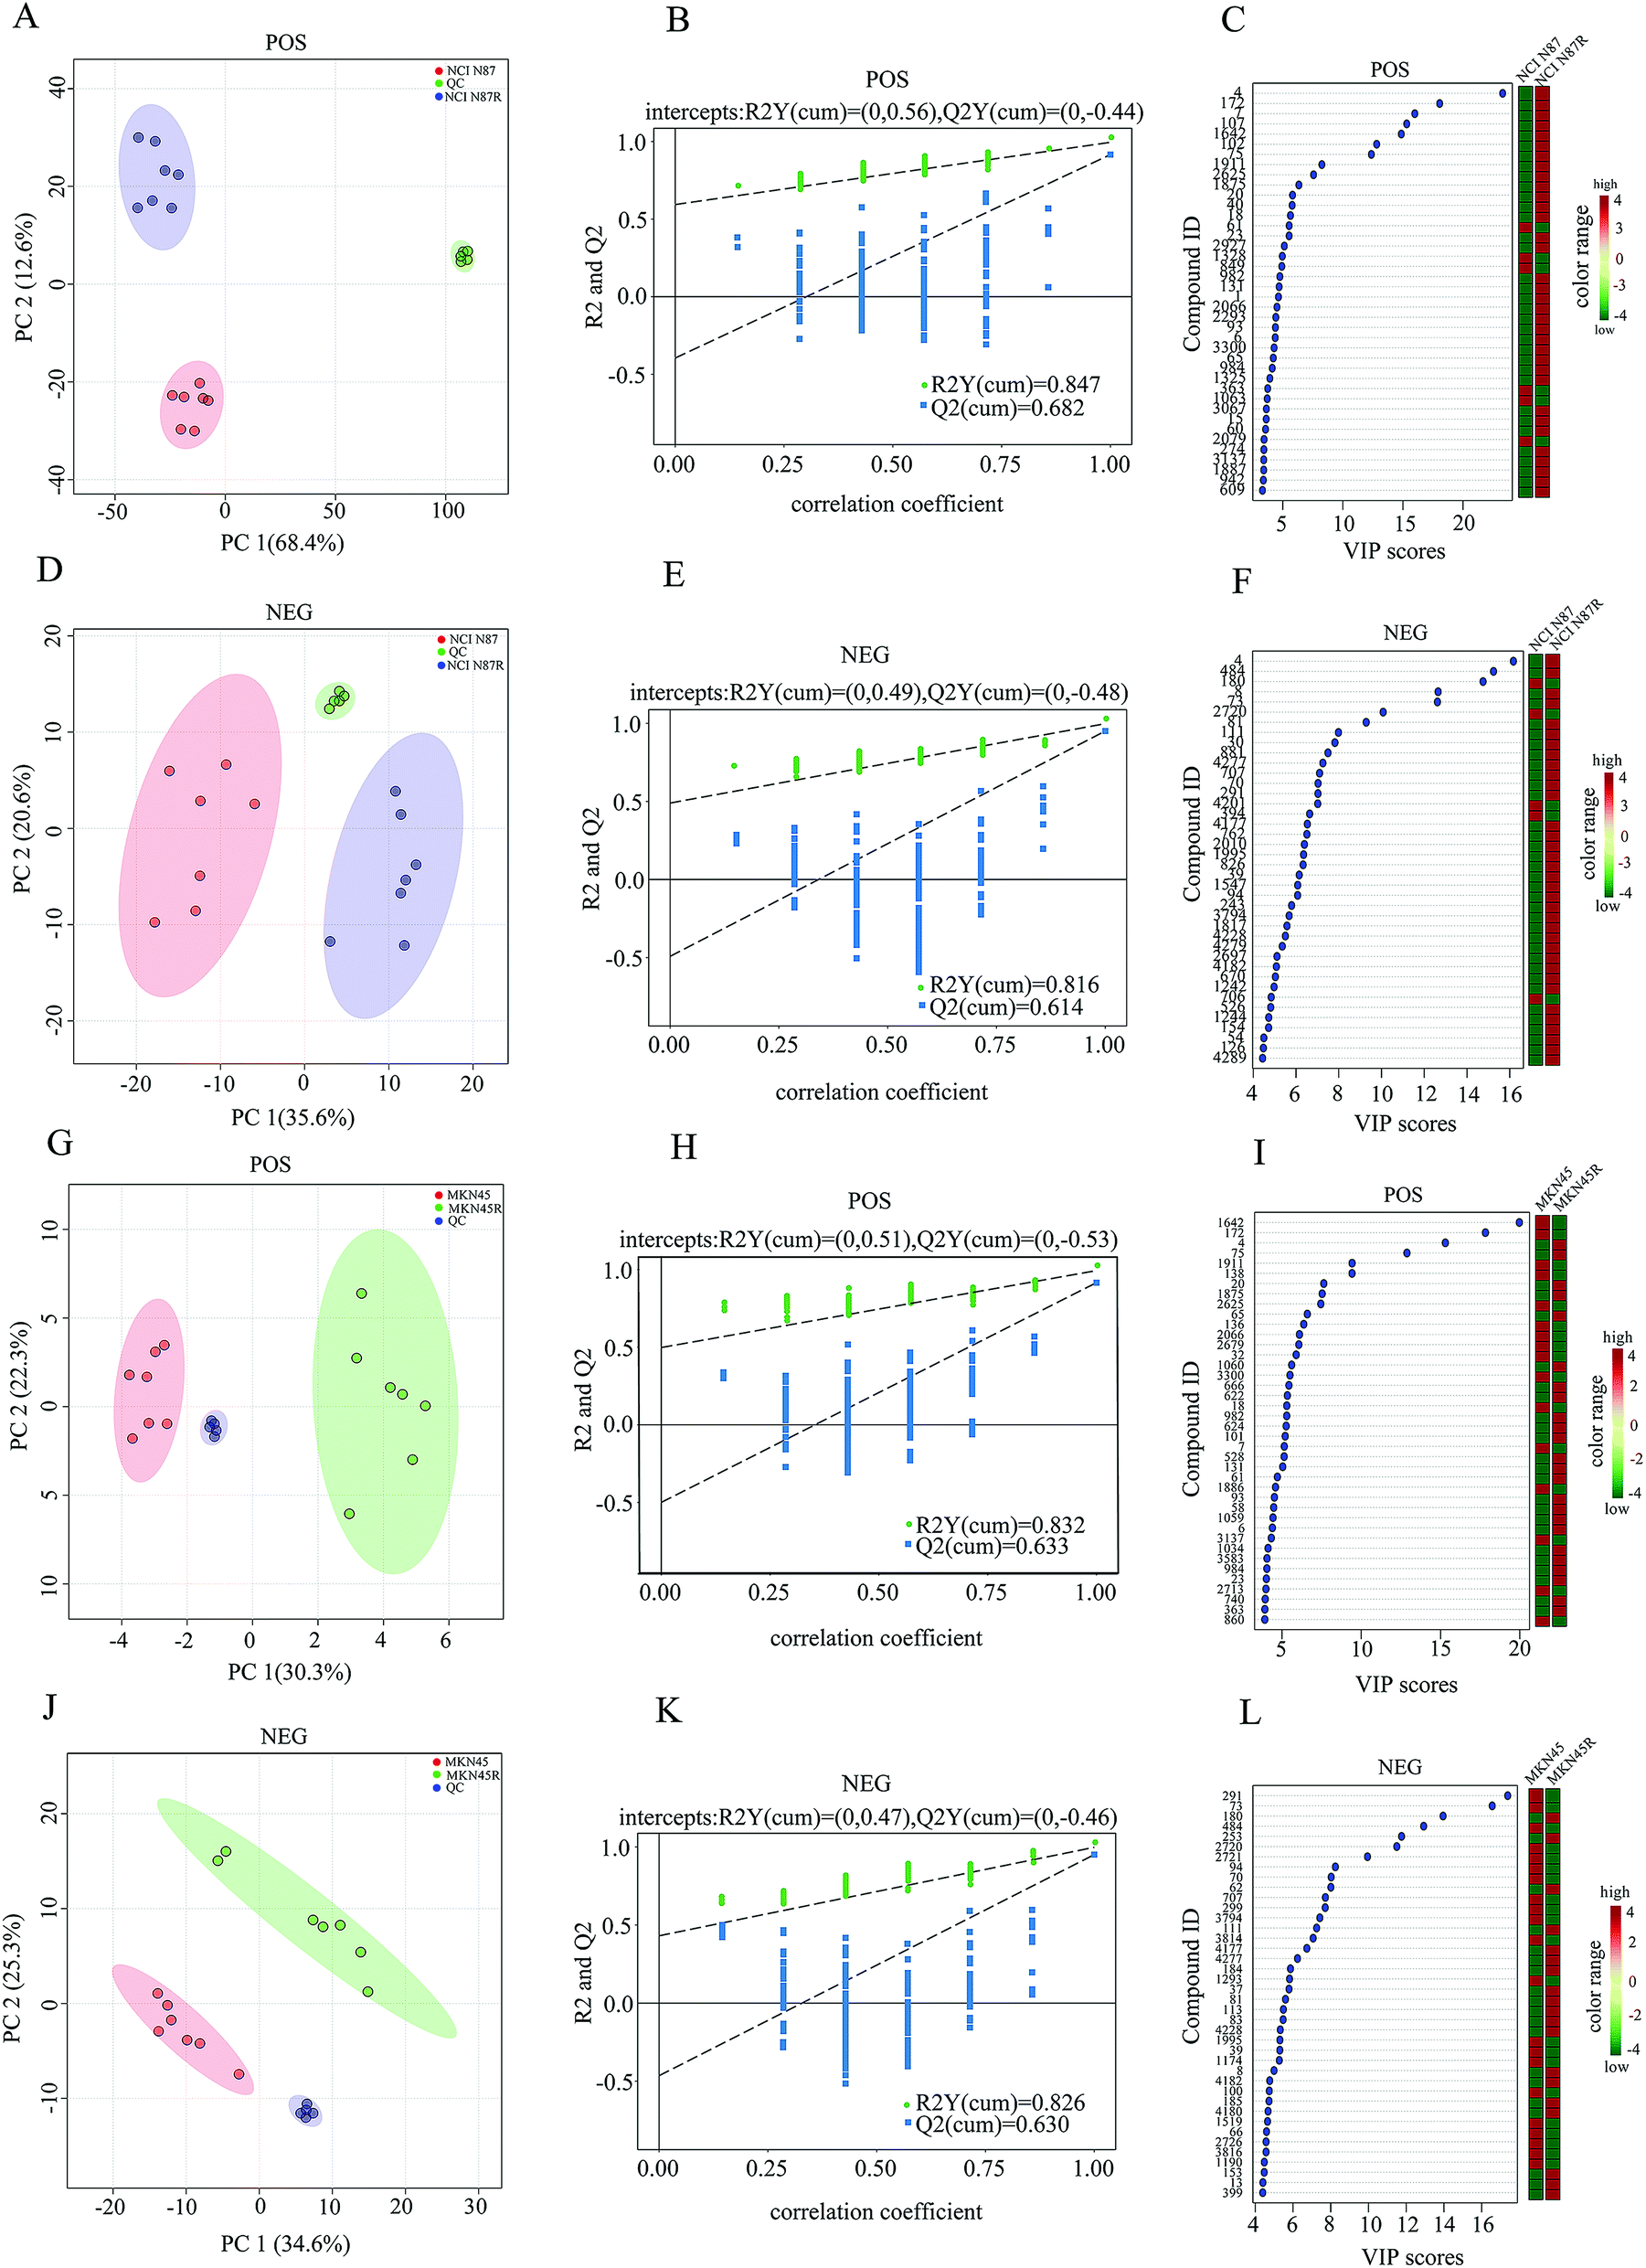
| | Fig. 1 Global metabolic profiling between trastuzumab resistant and parental cells. (A, D, G and J) PCA score plots of NCI N87 and NCI N87/R cells, MKN45 and MKN45/R cells in POS and NEG ion modes respectively. (B, E, H and K) Permutation test plots of NCI N87 and NCI N87/R cells, MKN45 and MKN45/R cells in POS and NEG ion modes respectively. (C, F, I and L) VIP plots of NCI N87 and NCI N87/R cells, MKN45 and MKN45/R cells in POS and NEG ion modes respectively, the colored boxes on the right indicate the relative concentrations of the corresponding metabolite in each group. | |
3.2 Global metabolomics profiling of trastuzumab resistant gastric cancer cells and parental cells
To explore the metabolic changes between trastuzumab resistant gastric cancer cells and parental cells, a global metabolic profiling was performed in NCI N87 and NCI N87/R, MKN45 and MKN45/R cell lines by UHPLC-Q exactive-MS/MS in POS and NEG modes. Seven biological repeat samples of each cell line were processed identically, respectively. For POS mode, peaks detected in NCI N87 and NCI N87/R cells were 4218, whereas in MKN45 and MKN45/R 3636. For NEG mode, peaks detected were 3906 in NCI N87 and NCI N87/R cells, and 3791 in MKN45 and MKN45/R cells, respectively. Based on in-house database and in combination with the Human Metabolome Database (HMDB, version, 4.0), these peaks were matched successfully for 173 (POS mode) and 113 (NEG mode) metabolites in NCI N87/R cells, and 168 (POS mode) and 104 (NEG mode) ones in MKN45/R cells. Peak intensity of all metabolites which represented standardized value of a metabolite across samples was normalized using 2-chloro-L-phenylalanine. The relative peak intensity was multiplied by 100 for the ease of presentation. A three-dimensional data matrix including standardized peak intensity, RT, mass to charge ratio (m/z) and identified metabolites was imported into MetaboAnalyst for further analysis. PCA was initially performed to visualize the intrinsic metabolic differences of fingerprinting between resistant and parental cells in POS and NEG modes respectively. The obvious separation trends indicated the metabolic profiling changes in resistant cells when compared with their parental cells (Fig. 1A, D, G and J). Principal component 1 (PC1) and component 2 (PC2) accounted for 68.4%, 12.6% (in NCI N87/R cells) and 30.3%, 22.3% (in MKN45/R cells) of total variance in POS mode, and 35.6%, 20.6% (in NCI N87/R cells) and 34.6%, 25.3% (in MKN45/R cells) of total variance in NEG mode, respectively. Next, OPLS-DA model was utilized to further distinguish the different variation between parental and resistant groups and identify potential variables (Fig. S4†) in which the score plots for the MS data showed notable difference and complete separation. OPLS-DA model was assessed by R2 (a goodness-of-fit parameter) and Q2 (a goodness prediction parameter) values. The results obtained were R2Y = 0.847, Q2 = 0.682 (POS mode) and R2Y = 0.816, Q2 = 0.614 (NEG mode) in NCI N87/R cells, as well as, R2Y = 0.832, Q2 = 0.633 (POS mode) and R2Y = 0.826, Q2 = 0.630 (NEG mode) in MKN45/R cells, respectively, indicating a good predictability and goodness-of-fit of the model. Next, the validity of OPLS-DA model was further analyzed using 200 iterations permutation tests indicating intercepts of R2 = 0.56, Q2 = –0.44 (POS mode), and R2 = 0.49, Q2 = −0.48 (NEG mode) in NCI N87/R group (Fig. 1B and E), R2 = 0.51, Q2 = −0.53 (POS mode), and R2 = 0.47, Q2 = −0.46 (NEG mode) in MKN45/R group, respectively (Fig. 1H and K). The validation plot strongly showed that OPLS-DA model was reliable for explaining and predicting the variations as Q2 regression indicated a negative intercept while R2 values of permuted models were positive. Then, hierarchical clustering analysis was performed using heatmap to visualize the whole altered metabolomes in POS and NEG modes from resistant and parental groups. The results indicated that the whole metabolome changed significantly between NCI N87 and NCI N87/R, MKN45 and MKN45/R cells respectively (Fig. S5†).
3.3 Shortlist and identification of differential metabolites
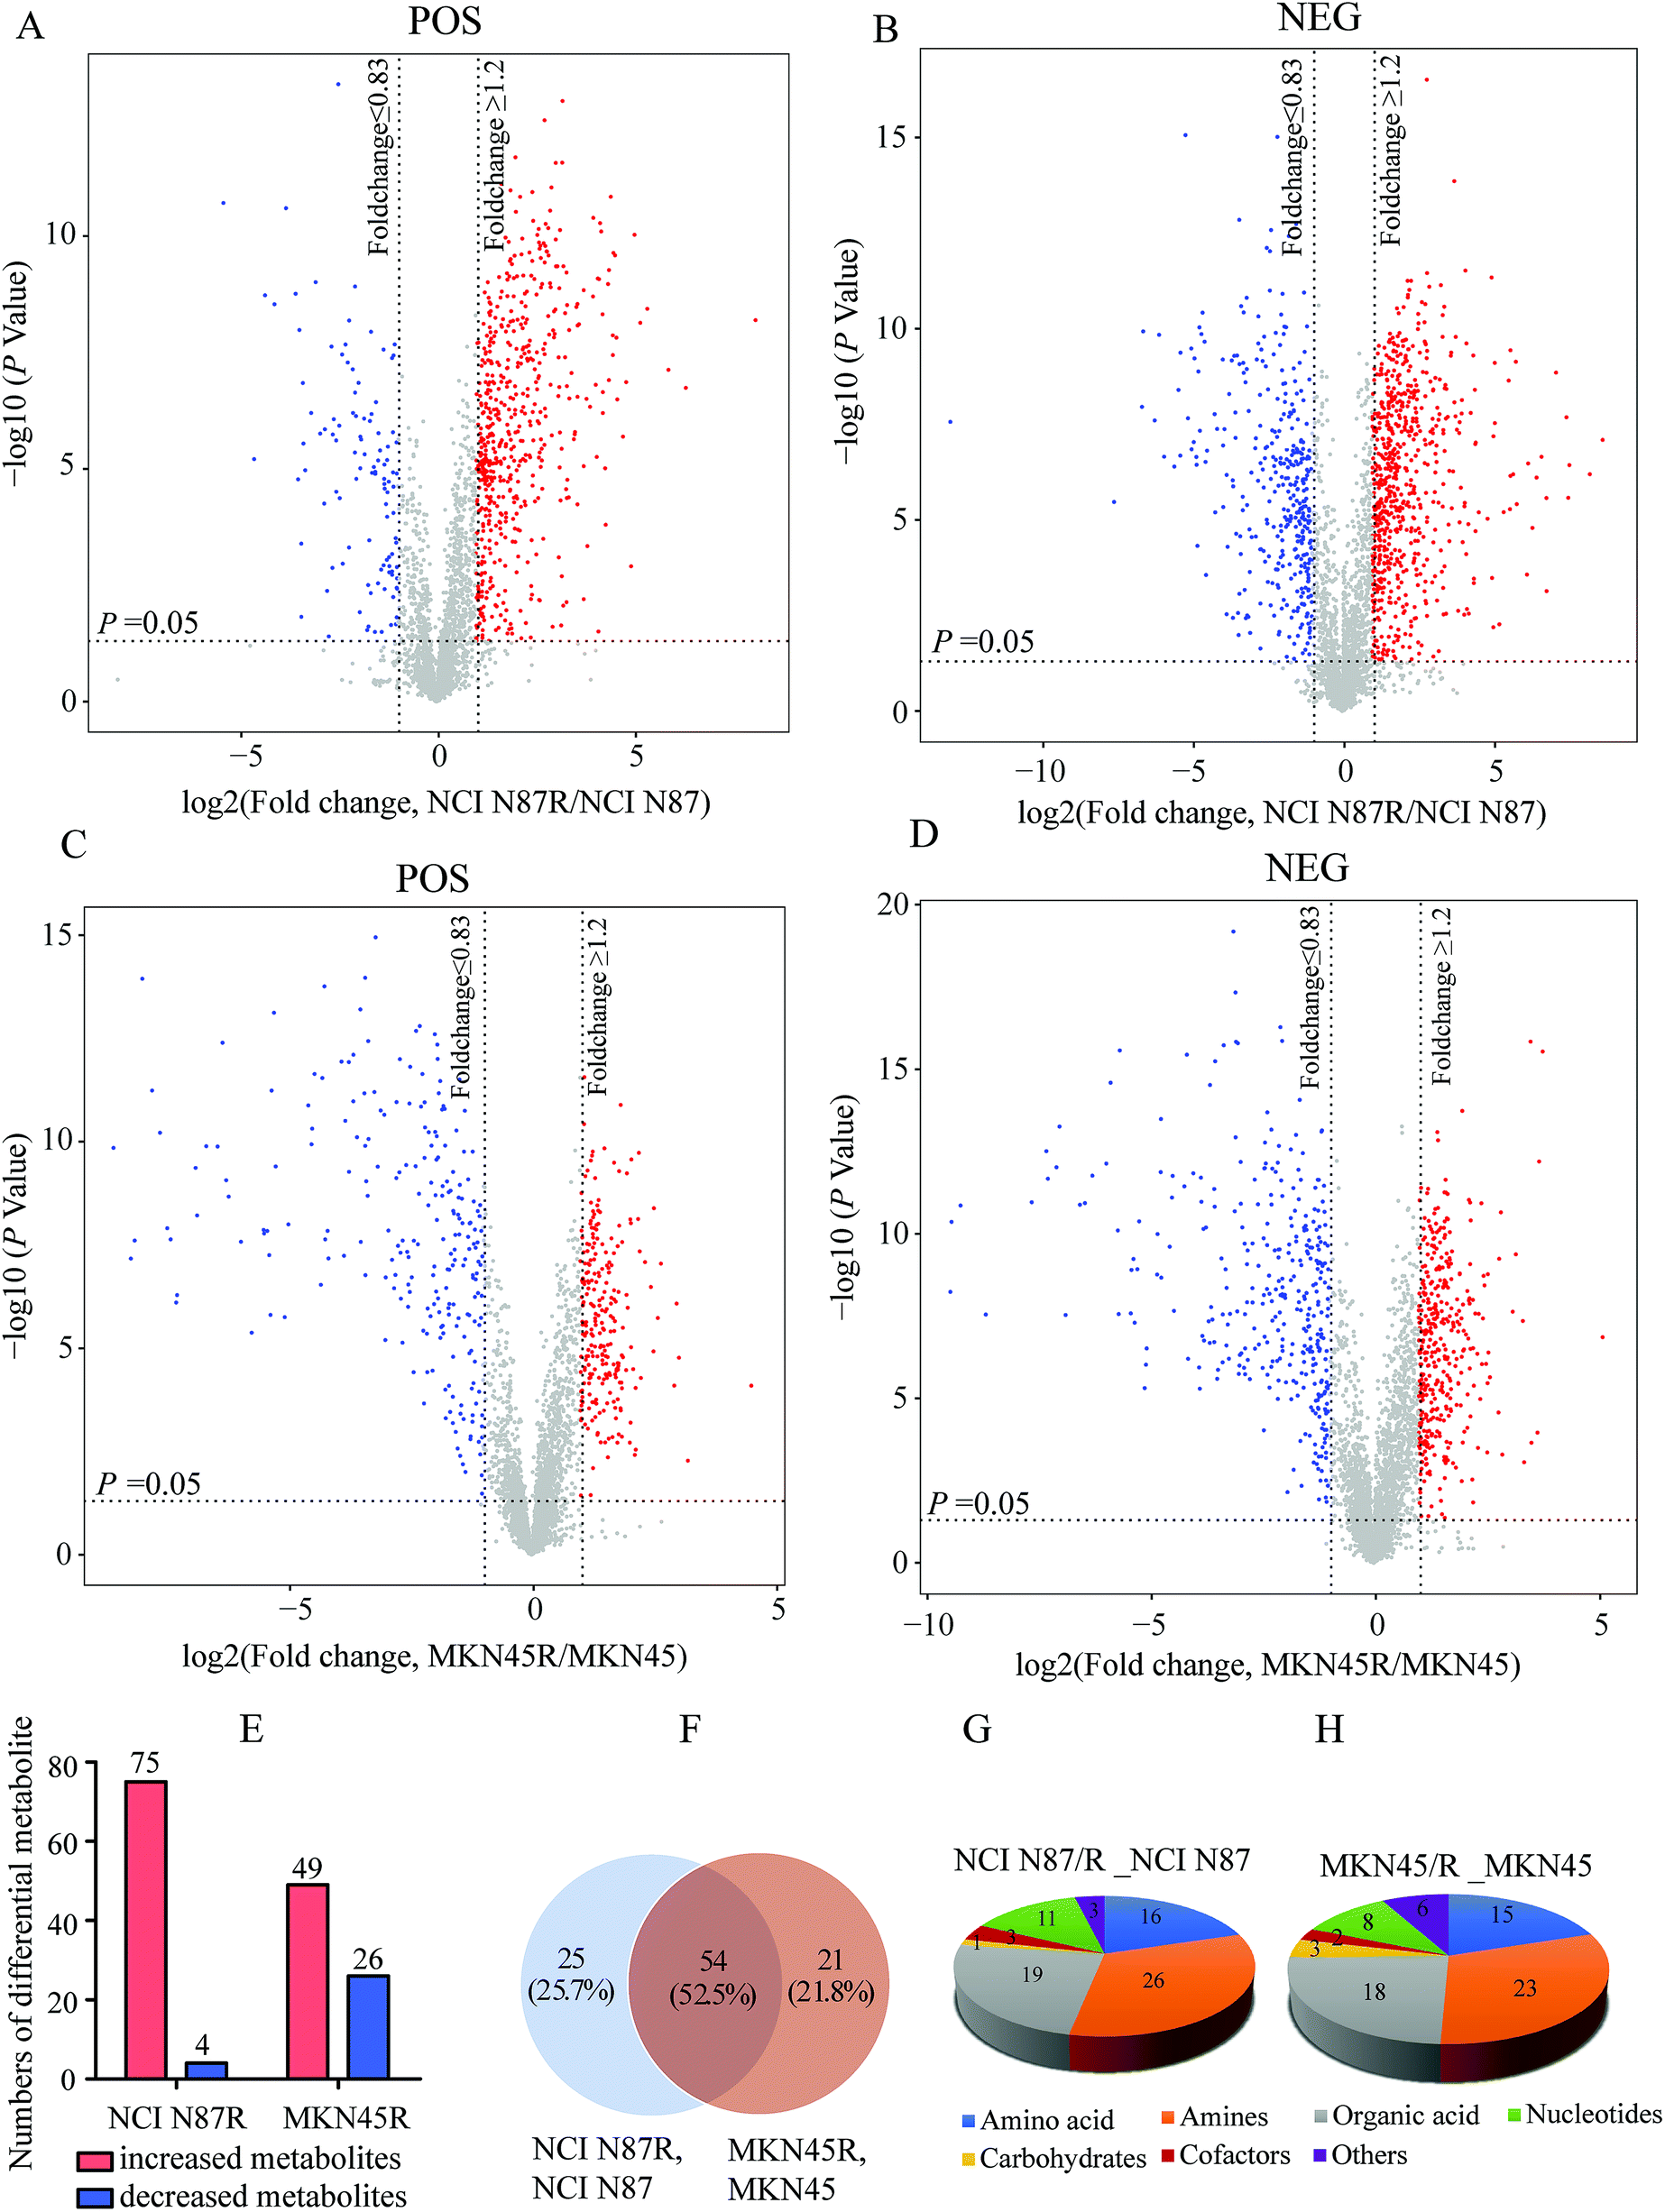
We screened potential variables by VIP value based on OPLS-DA model in both ion modes, as shown in Fig. 1C, F, I and L. Those variables with VIP values more than 1 were considered as discriminatory variables in resistant cells compared to parental cells. Subsequently, a volcano plot was employed to screen differential metabolites abundance against the corresponding p value obtained from unpaired-sample t-test (Fig. 2A–D). Differential metabolites were confirmed using in-house standard database by matching retention times with MS/MS fragmentation patterns after which MS/MS data with m/z tolerance less than 20 ppm were accepted. Compared with NCI N87 and MKN45 cells, the quantitative values of 75 and 49 metabolites displayed a more than 1.2 fold increase in NCI N87/R and MKN45/R cells (p < 0.05, VIP > 1), whereas 4 and 26 metabolites showed a less than 0.83 fold decrease in NCI N87/R and MKN45/R cells (p < 0.05, VIP > 1), respectively (Fig. 2E, Tables 1 and 2). From the Venn diagram, it was determined that 54 metabolites shared these two pairs of cell lines (Table S2†), however, 25 identified metabolites exclusively involved with NCI N87 and NCI N87/R cells (Table S3†), and 21 metabolites exclusively involved with MKN45 and MKN45/R cells (Fig. 2F, Table S4†). These metabolites were further classified according to their property, including amino acids, amines, organic acids, nucleotides, cofactors, carbohydrates and others, of which amines, organic acid and amino acid accounted for more than half of all identified metabolites (Fig. 2G and H).
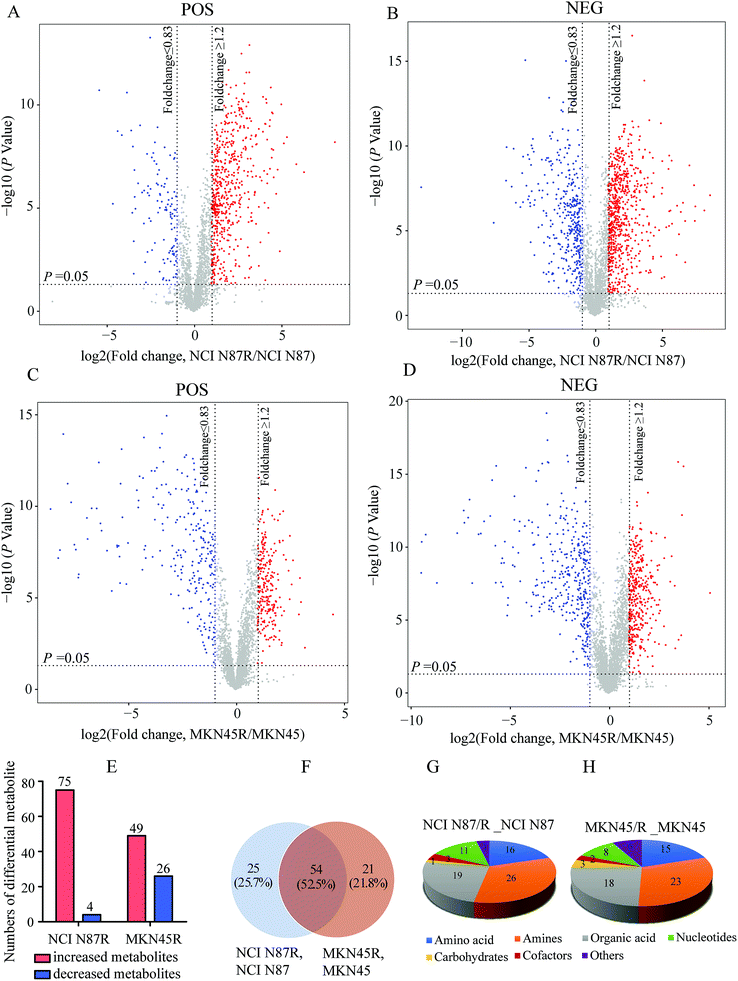 |
| | Fig. 2 Screening and analysis of differential metabolites between NCI N87 and NCI N87/R, MKN45 and MKN45/R cells respectively. (A–D) Differential metabolites in NCI N87 and NCI N87/R cells, MKN45 and MKN45/R cells in POS and NEG ion modes were screened by volcano plot respectively. The mean ratios of seven biological repeats were plotted in log2 scale (x-axis) against the corresponding −log10 p value (y-axis). Metabolites which showed fold changes greater than 1.2 or less than 0.83 and p < 0.05 are regarded as increased and decreased and marked in red and blue, respectively. The gray dots are considered as no significant change. (E) Increased and decreased metabolites in NCI N87/R and MKN45/R cells respectively. (F) Venn diagram shows the shared and non-shared metabolites of NCI N87 and NCI N87/R cells, MKN45 and MKN45/R cells respectively. (G and H) Classification of differential metabolites by their properties both in NCI N87/R and NCI N87, MKN45/R and MKN45 cells respectively. | |
Table 1 Metabolites increased or decreased significantly in NCI N87/R cells compared with NCI N87 cellsa
| No |
Metabolites |
VIP |
RT (s) |
HMDB |
KEGG |
FC (NCI N87R/NCI N87) |
P value |
ESI |
| VIP, variable importance in the projection. RT, retention time. FC, fold change. ESI, electrospray ionization. HMDB, human metabolome database. KEGG, kyoto encyclopedia of genes and genomes. |
| 1 |
L-Proline |
4.6 |
35.4170 |
HMDB0000162 |
C00148 |
1.3960 |
0.0002 |
+ |
| 2 |
Cellobiose |
2.9 |
33.7888 |
HMDB0000055 |
C06422 |
0.6710 |
3.48 × 10⁻⁷ |
+ |
| 3 |
Choline |
22.9 |
32.4745 |
HMDB0000097 |
C00114 |
2.0284 |
5.99 × 10⁻⁹ |
+ |
| 4 |
5′-Methylthioadenosine |
2.0 |
35.8421 |
HMDB0001173 |
C00170 |
1.7675 |
5.32 × 10⁻⁸ |
+ |
| 5 |
Adenine |
4.3 |
44.4459 |
HMDB0000034 |
C00147 |
5.4576 |
7.25 × 10⁻¹¹ |
+ |
| 6 |
Creatine |
15.7 |
35.7037 |
HMDB0000064 |
C00300 |
1.7088 |
7.12 × 10⁻⁷ |
+ |
| 7 |
Thiamine |
1.7 |
36.4755 |
HMDB0000235 |
C00378 |
1.8201 |
6.08 × 10⁻⁷ |
+ |
| 8 |
Niacinamide |
5.6 |
59.2615 |
HMDB0001406 |
C00153 |
1.5696 |
1.78 × 10⁻⁵ |
+ |
| 9 |
Pyroglutamic acid |
5.7 |
31.9499 |
HMDB0000267 |
C01879 |
2.0601 |
4.06 × 10⁻⁸ |
+ |
| 10 |
L-Glutamic acid |
5.4 |
32.3365 |
HMDB0000148 |
C00025 |
1.5868 |
2.68 × 10⁻⁶ |
+ |
| 11 |
Taurine |
2.9 |
31.1176 |
HMDB0000251 |
C00245 |
1.3869 |
2.23 × 10⁻⁵ |
+ |
| 12 |
Citicoline |
1.4 |
35.3315 |
HMDB0001413 |
C00307 |
5.2571 |
1.02 × 10⁻¹² |
+ |
| 13 |
Pantothenic acid |
3.2 |
158.147 |
HMDB0000210 |
C00864 |
4.5107 |
1.88 × 10⁻¹³ |
+ |
| 14 |
Nicotinamide |
1.4 |
40.88955 |
HMDB0001406 |
C00153 |
1.3486 |
0.01 |
+ |
| 15 |
L-Acetylcarnitine |
2.8 |
56.9584 |
HMDB0000201 |
C02571 |
1.9848 |
7.54 × 10⁻⁸ |
+ |
| 16 |
Phosphocholine |
1.9 |
56.1840 |
HMDB0001565 |
C00588 |
1.6809 |
5.89 × 10⁻⁶ |
+ |
| 17 |
Palmitoylethanolamide |
1.0 |
480.6915 |
HMDB0002100 |
C16512 |
1.8073 |
1.06 × 10⁻⁷ |
+ |
| 18 |
L-Carnitine |
5.7 |
34.3274 |
HMDB0000062 |
C00318 |
2.0857 |
6.53 × 10⁻⁸ |
+ |
| 19 |
S-Adenosylmethionine |
2.4 |
36.2733 |
HMDB0001185 |
C00019 |
2.4336 |
6.17 × 10⁻⁹ |
+ |
| 20 |
Propionylcarnitine |
1.7 |
133.7750 |
HMDB0000824 |
C03017 |
3.5739 |
6.03 × 10⁻¹² |
+ |
| 21 |
Cysteinylglycine |
2.7 |
44.9057 |
HMDB0000078 |
C01419 |
3.8361 |
3.14 × 10⁻¹¹ |
+ |
| 22 |
NAD |
1.5 |
56.7913 |
HMDB0000902 |
C00003 |
2.0087 |
2.44 × 10⁻⁹ |
+ |
| 23 |
Guanine |
2.2 |
135.8350 |
HMDB0000132 |
C00242 |
2.0889 |
4.04 × 10⁻⁹ |
+ |
| 24 |
2′-Deoxyguanosine 5′-monophosphate |
3.5 |
36.6211 |
HMDB0001044 |
C00362 |
2.4355 |
6.64481 × 10⁻¹¹ |
+ |
| 25 |
Octadecanamide |
5.5 |
537.857 |
HMDB0034146 |
C13846 |
0.8240 |
0.0001 |
+ |
| 26 |
N-Acetylneuraminic acid |
2.6 |
33.7925 |
HMDB0000230 |
C19910 |
1.9471 |
6.85 × 10⁻⁸ |
+ |
| 27 |
Epicatechin |
2.6 |
59.4799 |
HMDB0001871 |
C09727 |
1.2773 |
0.0001 |
+ |
| 28 |
Acetylcholine |
2.0 |
36.3677 |
HMDB0000895 |
C01996 |
1.7678 |
8.66 × 10⁻⁷ |
+ |
| 29 |
Glutathione |
15.1 |
45.2376 |
HMDB0000125 |
C00051 |
3.2209 |
8.84 × 10⁻¹¹ |
+ |
| 30 |
Phosphocreatine |
2.2 |
32.8868 |
HMDB0001511 |
C02305 |
1.9052 |
3.22 × 10⁻⁹ |
+ |
| 31 |
L-Methionine |
1.2 |
45.3115 |
HMDB0000696 |
C00073 |
1.5902 |
0.005 |
+ |
| 32 |
Butyrylcarnitine |
2.9 |
170.4390 |
HMDB0002013 |
C02862 |
2.0575 |
3.64 × 10⁻⁸ |
+ |
| 33 |
Phytosphingosine |
3.1 |
397.9985 |
HMDB0004610 |
C12144 |
1.2246 |
0.001 |
+ |
| 34 |
L-Leucine |
3.2 |
70.9547 |
HMDB0000687 |
C00123 |
1.5630 |
1.10 × 10⁻⁵ |
+ |
| 35 |
Cytidine monophosphate |
2.9 |
36.4080 |
HMDB0000095 |
C00055 |
2.3179 |
1.33 × 10⁻⁹ |
+ |
| 36 |
Sphinganine 1-phosphate |
17.8 |
394.8375 |
HMDB0001383 |
C01120 |
2.3413 |
1.15 × 10⁻¹¹ |
+ |
| 37 |
Guanosine monophosphate |
0.6 |
56.7896 |
HMDB0001397 |
C00144 |
1.4963 |
6.377 × 10⁻⁸ |
+ |
| 38 |
Uridine 5′-monophosphate |
0.9 |
36.2258 |
HMDB0000288 |
C00105 |
2.9006 |
2.18 × 10⁻¹⁰ |
+ |
| 39 |
S-Acetyldihydrolipoamide-E |
0.8 |
35.7337 |
HMDB0006878 |
C16255 |
2.6177 |
7.79 × 10⁻⁸ |
+ |
| 40 |
Citrulline |
1.6 |
31.6570 |
HMDB0000904 |
C00327 |
1.7571 |
7.74 × 10⁻⁸ |
− |
| 41 |
Xanthine |
1.5 |
58.4007 |
HMDB0000292 |
C00385 |
2.8307 |
0.0005 |
− |
| 42 |
Stearic acid |
12.2 |
547.5595 |
HMDB0000827 |
C01530 |
1.4557 |
1.01 × 10⁻⁵ |
− |
| 43 |
Phosphoenolpyruvic acid |
3.0 |
24.8485 |
HMDB0000263 |
C00074 |
2.5323 |
1.43 × 10⁻¹¹ |
− |
| 44 |
Citric acid |
2.2 |
25.7271 |
HMDB0000094 |
C00158 |
1.2785 |
0.02 |
− |
| 45 |
Malic acid |
4.0 |
25.3318 |
HMDB0000744 |
C00711 |
1.3012 |
0.0001 |
− |
| 46 |
Guanosine |
1.5 |
136.0755 |
HMDB0000133 |
C00387 |
2.2168 |
3.40 × 10⁻¹⁰ |
− |
| 47 |
Palmitoleic acid |
4.3 |
452.1460 |
HMDB0003229 |
C08362 |
0.8207 |
0.008 |
− |
| 48 |
Glyceric acid |
3.2 |
27.3797 |
HMDB0000139 |
C00258 |
4.0376 |
2.78 × 10⁻¹⁴ |
− |
| 49 |
Adenosine 5′-monophosphate |
1.8 |
35.94495 |
HMDB0000045 |
C00020 |
2.3069 |
2.60 × 10⁻⁸ |
− |
| 50 |
Phosphoric acid |
3.1 |
26.9356 |
HMDB0002142 |
C00009 |
1.5048 |
3.06 × 10⁻⁸ |
− |
| 51 |
Inosine |
1.6 |
133.9610 |
HMDB0000195 |
C00294 |
5.5066 |
3.94 × 10⁻¹⁷ |
− |
| 52 |
Adenosine |
2.4 |
152.9105 |
HMDB0000050 |
C00212 |
20.9751 |
1.19 × 10⁻¹⁸ |
− |
| 53 |
N-Acetyl-L-aspartic acid |
7.6 |
25.9006 |
HMDB0000812 |
C01042 |
2.9541 |
7.41 × 10⁻¹³ |
− |
| 54 |
L-Phenylalanine |
2.4 |
138.2565 |
HMDB0000159 |
C00079 |
1.4643 |
6.93 × 10⁻⁶ |
− |
| 55 |
Pantothenic acid |
3.9 |
44.6851 |
HMDB0000210 |
C00864 |
7.2750 |
1.16 × 10⁻¹² |
− |
| 56 |
Eicosenoic acid |
1.4 |
553.0170 |
HMDB0002231 |
C16526 |
1.6940 |
0.0007 |
− |
| 57 |
3-Phosphoglyceric acid |
4.1 |
25.46095 |
HMDB0000807 |
C00597 |
4.0795 |
3.55 × 10⁻¹¹ |
− |
| 58 |
Glyceraldehyde |
6.0 |
28.4658 |
HMDB0001051 |
C02154 |
1.2649 |
0.004 |
− |
| 59 |
Uridine diphosphategalactose |
1.8 |
26.2993 |
HMDB0000302 |
C00052 |
1.7224 |
0.0008 |
− |
| 60 |
Mannitol |
1.6 |
32.7260 |
HMDB0000765 |
C00392 |
1.2095 |
0.008 |
− |
| 61 |
L-Threonine |
1.5 |
31.3912 |
HMDB0000167 |
C00188 |
1.4401 |
8.30 × 10⁻⁶ |
− |
| 62 |
ADP |
1.1 |
41.6414 |
HMDB0001341 |
C00008 |
1.5467 |
1.03 × 10⁻⁵ |
− |
| 63 |
NADP |
1.4 |
31.3920 |
HMDB0000217 |
C00006 |
1.3246 |
8.74 × 10⁻⁵ |
− |
| 64 |
L-Alanine |
2.6 |
44.2452 |
HMDB0000161 |
C00041 |
0.1184 |
5.50 × 10⁻⁸ |
− |
| 65 |
L-Tyrosine |
2.4 |
56.9651 |
HMDB0000158 |
C00082 |
1.9311 |
3.20 × 10⁻⁶ |
− |
| 66 |
L-Norleucine |
4.4 |
56.43535 |
HMDB0001645 |
C01933 |
1.5363 |
2.50 × 10⁻⁶ |
− |
| 67 |
Uridine 5′-diphosphate |
1.9 |
33.9202 |
HMDB0000295 |
C00015 |
1.2607 |
0.004 |
− |
| 68 |
L-Histidine |
2.9 |
36.1976 |
HMDB0000177 |
C00135 |
1.8894 |
8.34 × 10⁻⁸ |
− |
| 69 |
Cytidine monophosphate N-acetylneuraminic acid |
2.7 |
26.0052 |
HMDB0001176 |
C00128 |
1.9331 |
2.22 × 10⁻⁹ |
− |
| 70 |
Uridine diphosphate glucuronic acid |
4.1 |
23.5885 |
HMDB0000935 |
C00167 |
1.7208 |
5.25 × 10⁻⁶ |
− |
| 71 |
Uridine diphosphate-N-acetylglucosamine |
12.2 |
27.0695 |
HMDB0000290 |
C00043 |
1.4951 |
2.65 × 10⁻⁶ |
− |
| 72 |
Uracil |
1.3 |
31.0772 |
HMDB0000300 |
C00106 |
1.5423 |
0.008 |
− |
| 73 |
L-Valine |
2.1 |
35.9451 |
HMDB0000883 |
C00183 |
1.4427 |
4.34 × 10⁻⁵ |
− |
| 74 |
Fumaric acid |
1.9 |
25.1480 |
HMDB0000134 |
C00122 |
1.3931 |
1.66 × 10⁻⁶ |
− |
| 75 |
Gluconic acid |
9.0 |
27.6422 |
HMDB0000625 |
C00257 |
2.3027 |
1.86 × 10⁻⁹ |
− |
| 76 |
L-Glutamine |
4.1 |
30.8678 |
HMDB0000641 |
C00064 |
3.9806 |
1.82 × 10⁻¹⁴ |
− |
| 77 |
L-Aspartic acid |
4.2 |
26.8376 |
HMDB0000191 |
C00049 |
5.5817 |
1.94 × 10⁻¹⁶ |
− |
| 78 |
LysoPE (18:0) |
1.0 |
405.8790 |
HMDB0011129 |
— |
1.4053 |
0.0001 |
− |
| 79 |
Cytidine |
4.0 |
28.9824 |
HMDB0000089 |
C00475 |
1.4827 |
6.27 × 10⁻⁶ |
− |
Table 2 Metabolites increased or decreased significantly in MKN45/R cells compared with MKN45 cellsa
| No |
Metabolites |
VIP |
RT (s) |
HMDB |
KEGG |
FC (MKN45R/MKN45) |
P value |
ESI |
| VIP, variable importance in the projection. RT, retention time. FC, fold change. ESI, electrospray ionization. HMDB, human metabolome database. KEGG, kyoto encyclopedia of genes and genomes. |
| 1 |
L-Proline |
3.8 |
35.4170 |
HMDB0000162 |
C00148 |
1.2837 |
0.008 |
+ |
| 2 |
Cellobiose |
3.2 |
33.7888 |
HMDB0000055 |
C06422 |
0.2040 |
1.58 × 10⁻¹³ |
+ |
| 3 |
Choline |
15.4 |
32.4745 |
HMDB0000097 |
C00114 |
1.3359 |
0.0002 |
+ |
| 4 |
Adenine |
4.4 |
44.4459 |
HMDB0000034 |
C00147 |
2.3015 |
4.21 × 10⁻⁵ |
+ |
| 5 |
Thiamine |
1.2 |
36.4755 |
HMDB0000235 |
C00378 |
1.4556 |
0.0008 |
+ |
| 6 |
L-Lysine |
1.4 |
28.7140 |
HMDB0000182 |
C00047 |
1.4812 |
4.19 × 10⁻⁶ |
+ |
| 7 |
Niacinamide |
5.3 |
59.2615 |
HMDB0001406 |
C00153 |
0.6031 |
2.27 × 10⁻⁷ |
+ |
| 8 |
Pyroglutamic acid |
7.7 |
31.9499 |
HMDB0000267 |
C01879 |
2.1890 |
1.52 × 10⁻⁷ |
+ |
| 9 |
L-Histidine |
3.0 |
30.3191 |
HMDB0000177 |
C00135 |
2.1235 |
2.81 × 10⁻⁷ |
+ |
| 10 |
L-Glutamic acid |
4.0 |
32.3366 |
HMDB0000148 |
C00025 |
1.3327 |
0.005 |
+ |
| 11 |
Taurine |
2.7 |
31.1177 |
HMDB0000251 |
C00245 |
1.3456 |
0.0006 |
+ |
| 12 |
L-Acetylcarnitine |
1.6 |
56.9584 |
HMDB0000201 |
C02571 |
0.7241 |
0.004 |
+ |
| 13 |
Phosphocholine |
2.3 |
56.1840 |
HMDB0001565 |
C00588 |
0.3351 |
4.11 × 10⁻⁸ |
+ |
| 14 |
Glycerophosphocholine |
2.4 |
31.7692 |
HMDB0000086 |
C00670 |
0.5661 |
1.29 × 10⁻⁷ |
+ |
| 15 |
Palmitoylethanolamide |
1.2 |
480.6915 |
HMDB0002100 |
C16512 |
1.7875 |
1.37 × 10⁻⁸ |
+ |
| 16 |
L-Carnitine |
3.5 |
34.3274 |
HMDB0000062 |
C00318 |
0.7062 |
0.0002 |
+ |
| 17 |
S-Adenosylmethionine |
1.0 |
36.2733 |
HMDB0001185 |
C00019 |
0.7868 |
0.020298 |
+ |
| 18 |
L-Tyrosine |
2.2 |
70.5395 |
HMDB0000158 |
C00082 |
1.4748 |
0.0008 |
+ |
| 19 |
2-Methylbutyroylcarnitine |
1.1 |
196.1540 |
HMDB0000378 |
— |
0.2539 |
5.79 × 10⁻¹¹ |
+ |
| 20 |
Guanine |
3.2 |
135.8350 |
HMDB0000132 |
C00242 |
2.4015 |
6.77 × 10⁻⁹ |
+ |
| 21 |
Betaine aldehyde |
1.4 |
644.4320 |
HMDB0001252 |
C00576 |
1.5168 |
0.0001 |
+ |
| 22 |
2′-Deoxyguanosine 5′-monophosphate |
3.4 |
36.6211 |
HMDB0001044 |
C00362 |
0.3005 |
9.16 × 10⁻¹⁰ |
+ |
| 23 |
Octadecanamide |
4.7 |
537.8570 |
HMDB0034146 |
C13846 |
1.2187 |
0.002 |
+ |
| 24 |
Tetradecanoylcarnitine |
2.2 |
541.2920 |
HMDB0005066 |
— |
2.3906 |
1.74 × 10⁻¹⁰ |
+ |
| 25 |
L-Glutamine |
6.6 |
31.5669 |
HMDB0000641 |
C00064 |
3.2374 |
3.21 × 10⁻¹⁰ |
+ |
| 26 |
Adenosine |
12.9 |
135.7995 |
HMDB0000050 |
C00212 |
2.2772 |
3.09 × 10⁻⁸ |
+ |
| 27 |
Sphinganine |
2.3 |
534.6815 |
HMDB0000269 |
C00836 |
0.3745 |
9.38 × 10⁻⁹ |
+ |
| 28 |
LysoPE (16:0/0:0) |
1.2 |
416.3290 |
HMDB0011503 |
— |
1.2236 |
6.20 × 10⁻⁵ |
+ |
| 29 |
Allopurinol |
2.8 |
135.0065 |
HMDB0014581 |
— |
2.1975 |
4.90 × 10⁻⁷ |
+ |
| 30 |
LysoPC (16:0) |
5.2 |
428.3845 |
HMDB0010382 |
C04230 |
1.6623 |
1.49 × 10⁻⁶ |
+ |
| 31 |
L-Threonine |
2.4 |
31.9197 |
HMDB0000167 |
C00188 |
1.6272 |
1.11 × 10⁻⁵ |
+ |
| 32 |
Phosphocreatine |
2.6 |
32.8868 |
HMDB0001511 |
C02305 |
2.0246 |
0.0001 |
+ |
| 33 |
L-Methionine |
1.6 |
45.3115 |
HMDB0000696 |
C00073 |
1.7167 |
0.0001 |
+ |
| 34 |
D-Erythrose 4-phosphate |
1.2 |
36.4582 |
HMDB0001321 |
C00279 |
1.6459 |
3.20 × 10⁻⁶ |
+ |
| 35 |
Phytosphingosine |
6.4 |
397.9985 |
HMDB0004610 |
C12144 |
0.2525 |
2.50 × 10⁻¹³ |
+ |
| 36 |
L-Leucine |
3.1 |
70.9547 |
HMDB0003640 |
C02486 |
1.4880 |
0.0004 |
+ |
| 37 |
Sanguinarine |
2.7 |
33.5626 |
HMDB0029367 |
C06162 |
0.4514 |
3.69 × 10⁻⁸ |
+ |
| 38 |
S-Acetyldihydrolipoamide-E |
1.4 |
35.7338 |
HMDB0006878 |
C16255 |
0.7209 |
0.01 |
+ |
| 39 |
Creatine |
1.2 |
34.0587 |
HMDB0000064 |
C00300 |
0.6324 |
0.001 |
− |
| 40 |
Citrulline |
1.2 |
31.6570 |
HMDB0000904 |
C00327 |
1.3967 |
3.6 × 10⁻⁷ |
− |
| 41 |
Phosphoenolpyruvic acid |
3.6 |
24.8485 |
HMDB0000263 |
C00074 |
2.5987 |
4.53 × 10⁻⁹ |
− |
| 42 |
Citric acid |
3.1 |
25.7272 |
HMDB0000094 |
C00158 |
1.7135 |
0.0002 |
− |
| 43 |
Malic acid |
4.4 |
25.3318 |
HMDB0000744 |
C00711 |
1.4057 |
1.64 × 10⁻⁵ |
− |
| 44 |
Guanosine |
1.9 |
136.0755 |
HMDB0000133 |
C00387 |
2.3383 |
4.06 × 10⁻¹¹ |
− |
| 45 |
Glyceric acid |
3.9 |
27.3797 |
HMDB0000139 |
C00258 |
2.9207 |
4.14 × 10⁻⁹ |
− |
| 46 |
Mannose 6-phosphate |
2.8 |
25.7232 |
HMDB0001078 |
C00275 |
1.9186 |
0.0001 |
− |
| 47 |
Dihydroxyacetone phosphate |
2.3 |
26.0046 |
HMDB0001473 |
C00111 |
0.5036 |
3.92 × 10⁻⁹ |
− |
| 48 |
Adenosine monophosphate |
1.3 |
35.9450 |
HMDB0000045 |
C00020 |
0.4241 |
2.8 × 10⁻⁷ |
− |
| 49 |
Phosphoric acid |
2.9 |
26.9357 |
HMDB0002142 |
C00009 |
1.5446 |
1.66 × 10⁻⁷ |
− |
| 50 |
Inosine |
1.6 |
133.9610 |
HMDB0000195 |
C00294 |
2.3397 |
1.22 × 10⁻⁸ |
− |
| 51 |
L-Phenylalanine |
2.2 |
138.2565 |
HMDB0000159 |
C00079 |
1.4232 |
9.29 × 10⁻⁵ |
− |
| 52 |
Pantothenic acid |
1.7 |
44.6851 |
HMDB0000210 |
C00864 |
1.3815 |
0.009 |
− |
| 53 |
Uridine 5′-monophosphate |
1.4 |
29.4426 |
HMDB0000288 |
C00105 |
0.5397 |
2.39 × 10⁻⁶ |
− |
| 54 |
Eicosenoic acid |
1.4 |
553.0170 |
HMDB0002231 |
C16526 |
1.6465 |
8.79 × 10⁻⁵ |
− |
| 55 |
3-Phosphoglyceric acid |
5.7 |
25.4610 |
HMDB0000807 |
C00597 |
4.0369 |
3.24 × 10⁻⁷ |
− |
| 56 |
Glyceraldehyde |
5.2 |
28.4658 |
HMDB0001051 |
C02154 |
0.7719 |
0.0003 |
− |
| 57 |
Eicosapentaenoic acid |
3.1 |
432.0920 |
HMDB0001999 |
C06428 |
1.3442 |
2.96 × 10⁻⁹ |
− |
| 58 |
L-Norleucine |
4.0 |
56.4354 |
HMDB0001645 |
C01933 |
1.4960 |
5.97 × 10⁻⁵ |
− |
| 59 |
Uridine 5′-diphosphate |
2.7 |
33.9202 |
HMDB0000295 |
C00015 |
0.4701 |
7.87 × 10⁻¹⁰ |
− |
| 60 |
Pyruvic acid |
2.4 |
30.5934 |
HMDB0000243 |
C00022 |
0.6753 |
0.01 |
− |
| 61 |
Arachidonic acid |
7.8 |
462.0745 |
HMDB0001043 |
C00219 |
1.3942 |
4.72 × 10⁻⁹ |
− |
| 62 |
Uridine diphosphate glucuronic acid |
4.5 |
23.5885 |
HMDB0000935 |
C00167 |
0.2308 |
2.13 × 10⁻¹³ |
− |
| 63 |
N-Acetylneuraminic acid |
7.8 |
28.0273 |
HMDB0000230 |
C19910 |
0.4453 |
7.89 × 10⁻¹⁴ |
− |
| 64 |
Uridine diphosphate-N-acetylglucosamine |
16.2 |
27.0695 |
HMDB0000290 |
C00043 |
0.1223 |
1.62 × 10⁻¹⁶ |
− |
| 65 |
Cholesterol sulfate |
3.8 |
446.2680 |
HMDB0000653 |
C18043 |
0.7937 |
9.38 × 10⁻⁵ |
− |
| 66 |
L-Valine |
1.8 |
35.9451 |
HMDB0000883 |
C00183 |
1.3524 |
0.0003 |
− |
| 67 |
Fumaric acid |
1.8 |
25.1481 |
HMDB0000134 |
C00122 |
1.4028 |
2.05 × 10⁻⁵ |
− |
| 68 |
Gluconic acid |
5.8 |
27.6422 |
HMDB0000625 |
C00257 |
1.5604 |
0.008 |
− |
| 69 |
L-Aspartic acid |
3.2 |
26.8376 |
HMDB0000191 |
C00049 |
1.7824 |
1.11 × 10⁻⁵ |
− |
| 70 |
Cytidine |
4.6 |
28.9824 |
HMDB0000089 |
C00475 |
0.3858 |
2.63 × 10⁻¹⁰ |
− |
| 71 |
Nicotinic acid |
1.9 |
23.5113 |
HMDB0001488 |
C00253 |
1.2232 |
0.01 |
− |
| 72 |
N-Acetyl-glucosamine 1-phosphate |
1.7 |
26.2725 |
HMDB0001367 |
C04256 |
0.2427 |
1.38 × 10⁻¹⁶ |
− |
| 73 |
L-Tryptophan |
1.1 |
162.2730 |
HMDB0000929 |
C00078 |
1.3658 |
0.001 |
− |
| 74 |
NAD |
1.7 |
35.9749 |
HMDB0000902 |
C00003 |
1.3304 |
0.002 |
− |
| 75 |
NADP |
1.4 |
31.3921 |
HMDB0000217 |
C00006 |
1.5035 |
0.001 |
− |
3.4 Pathway enrichment analysis
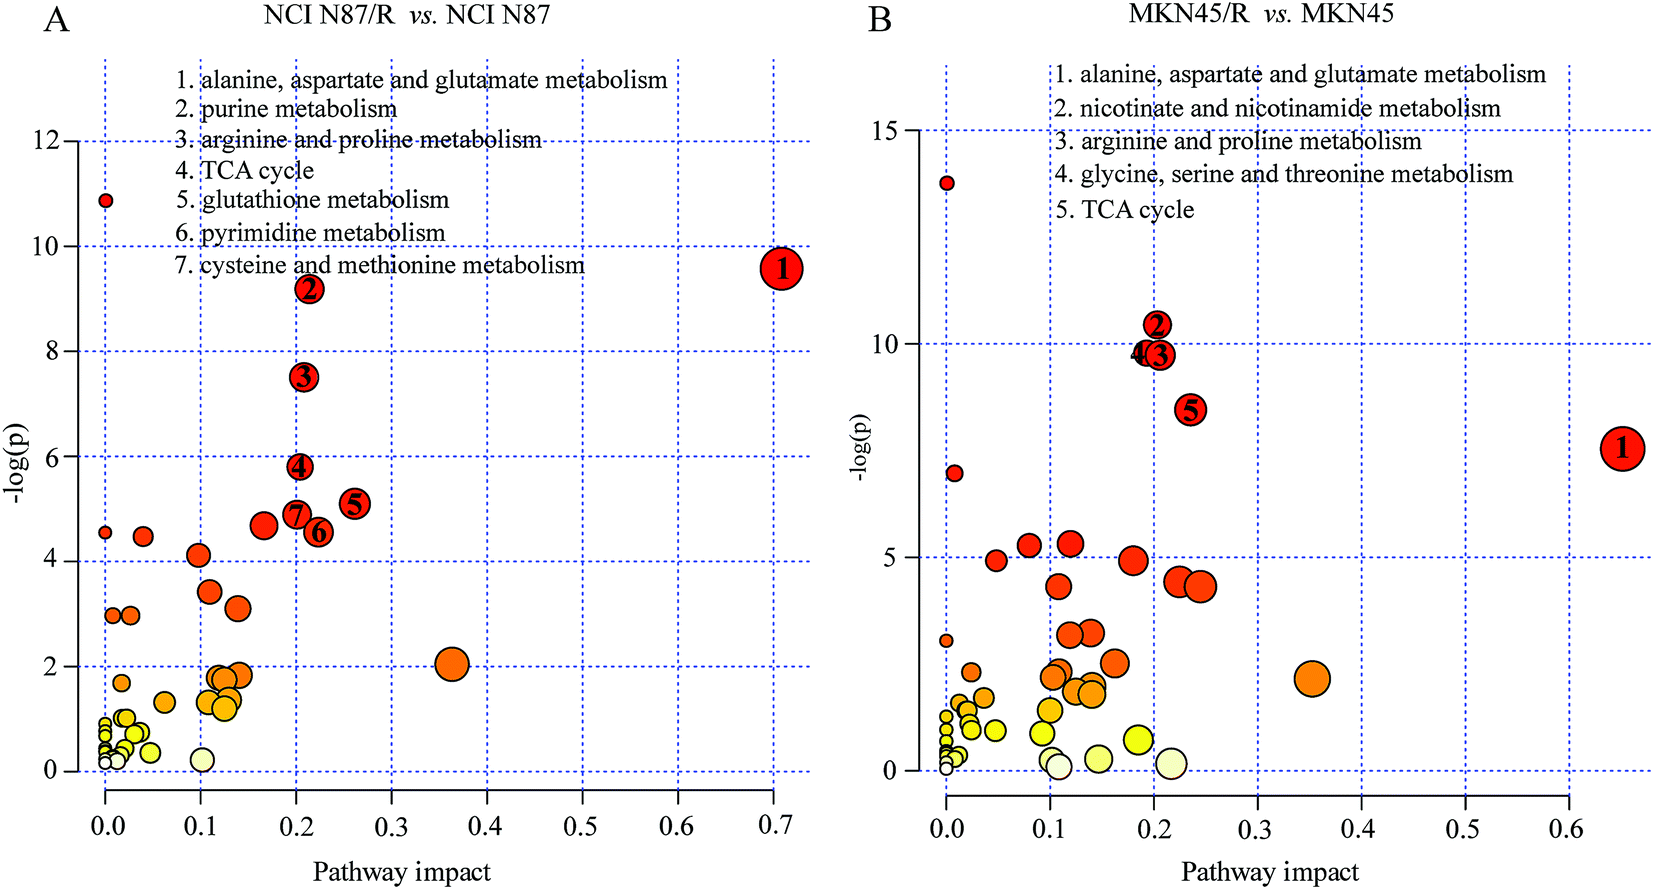
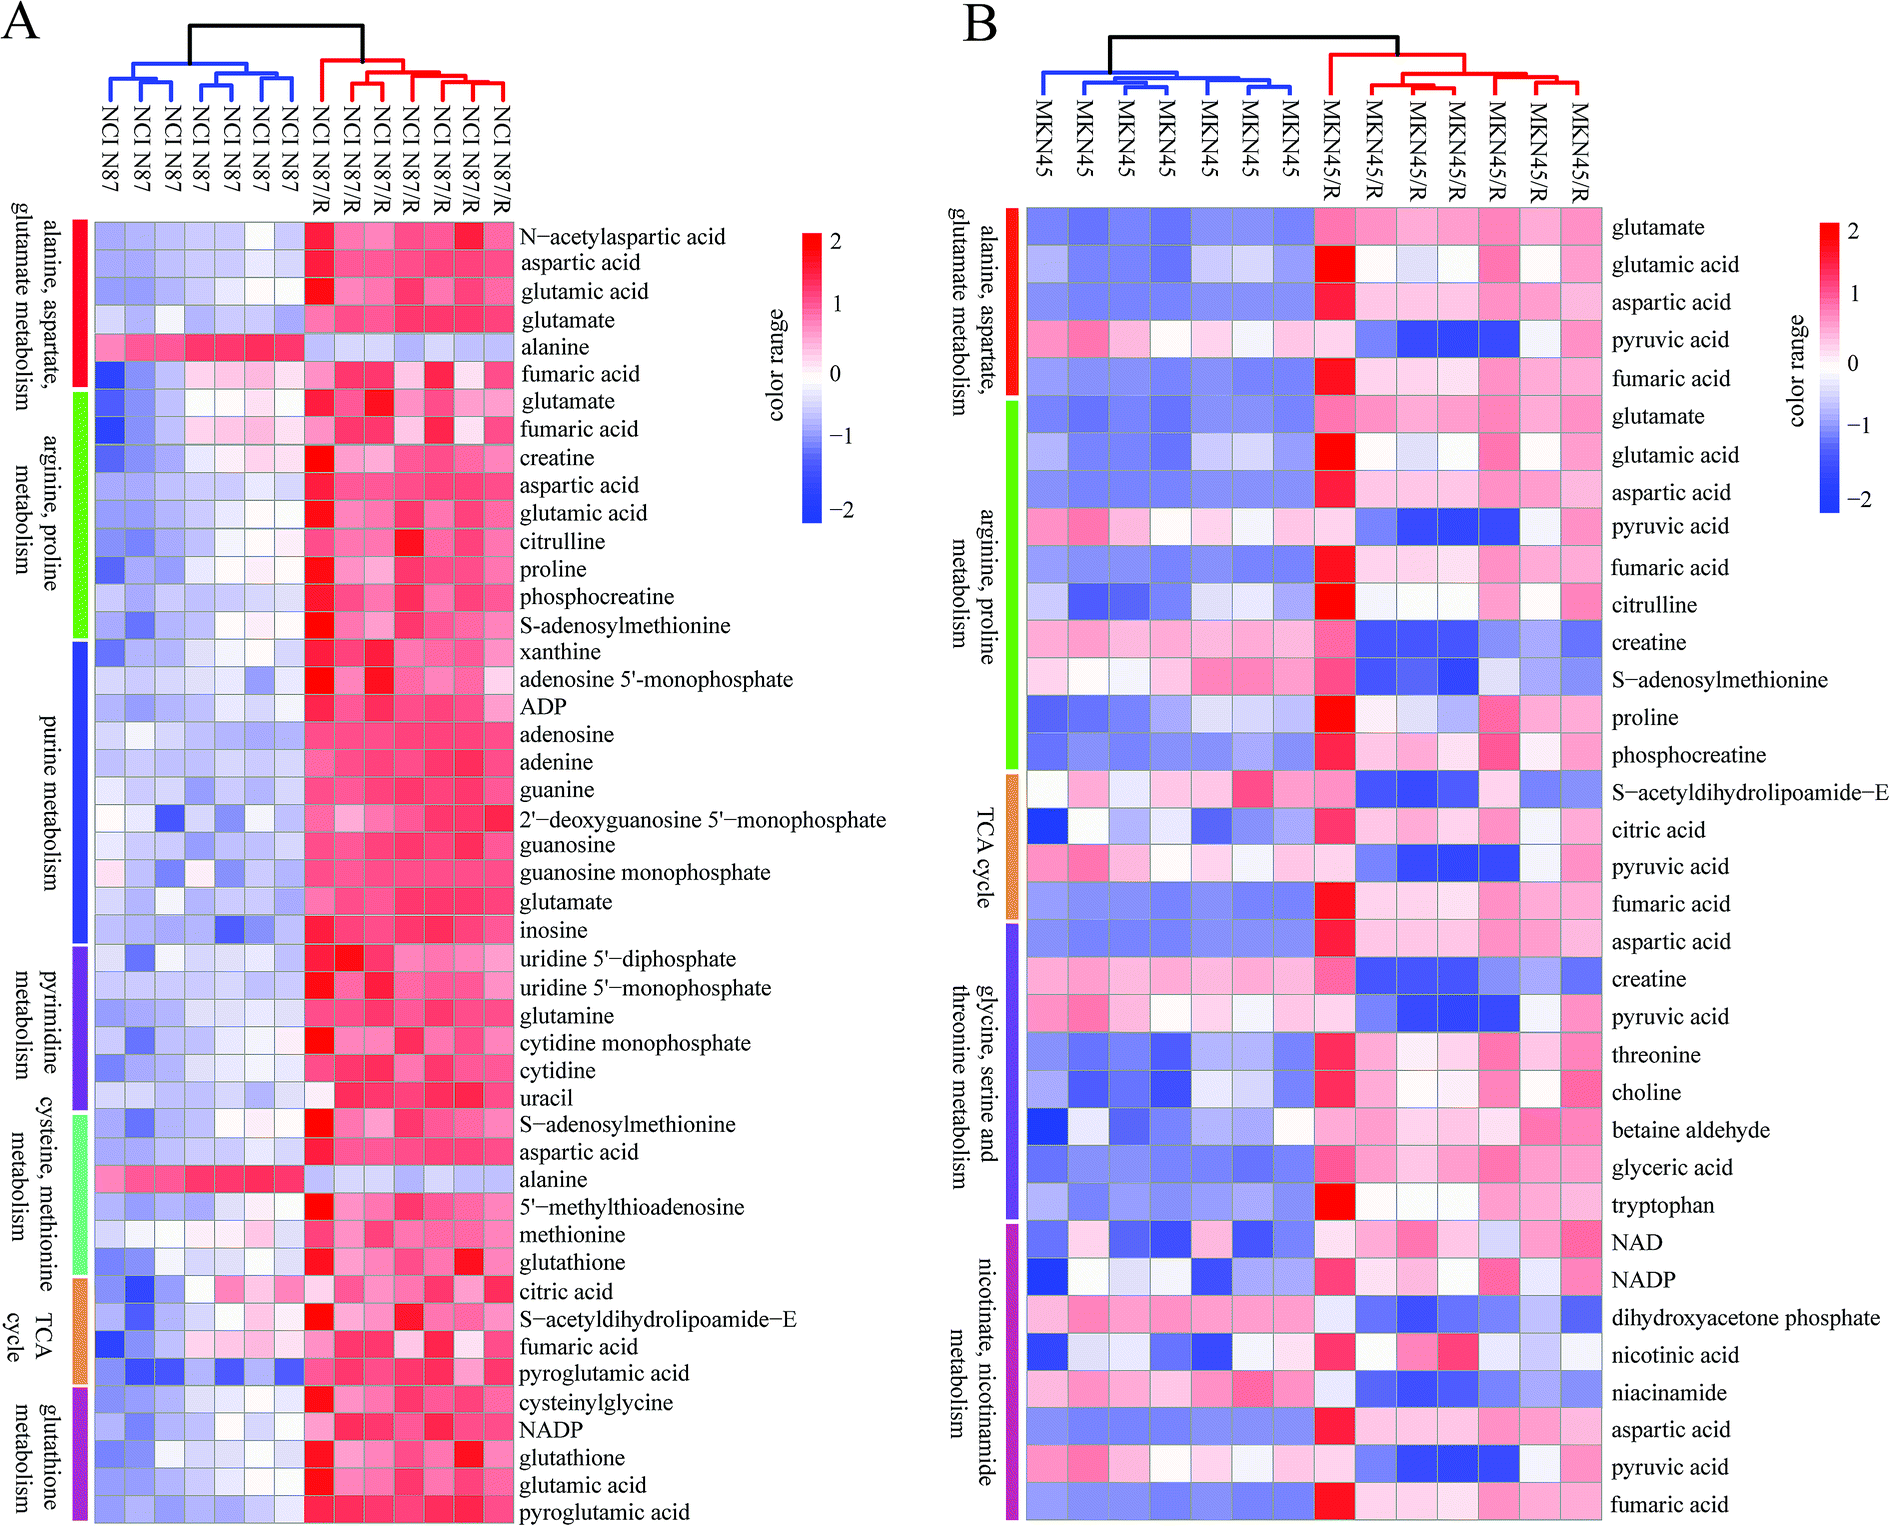
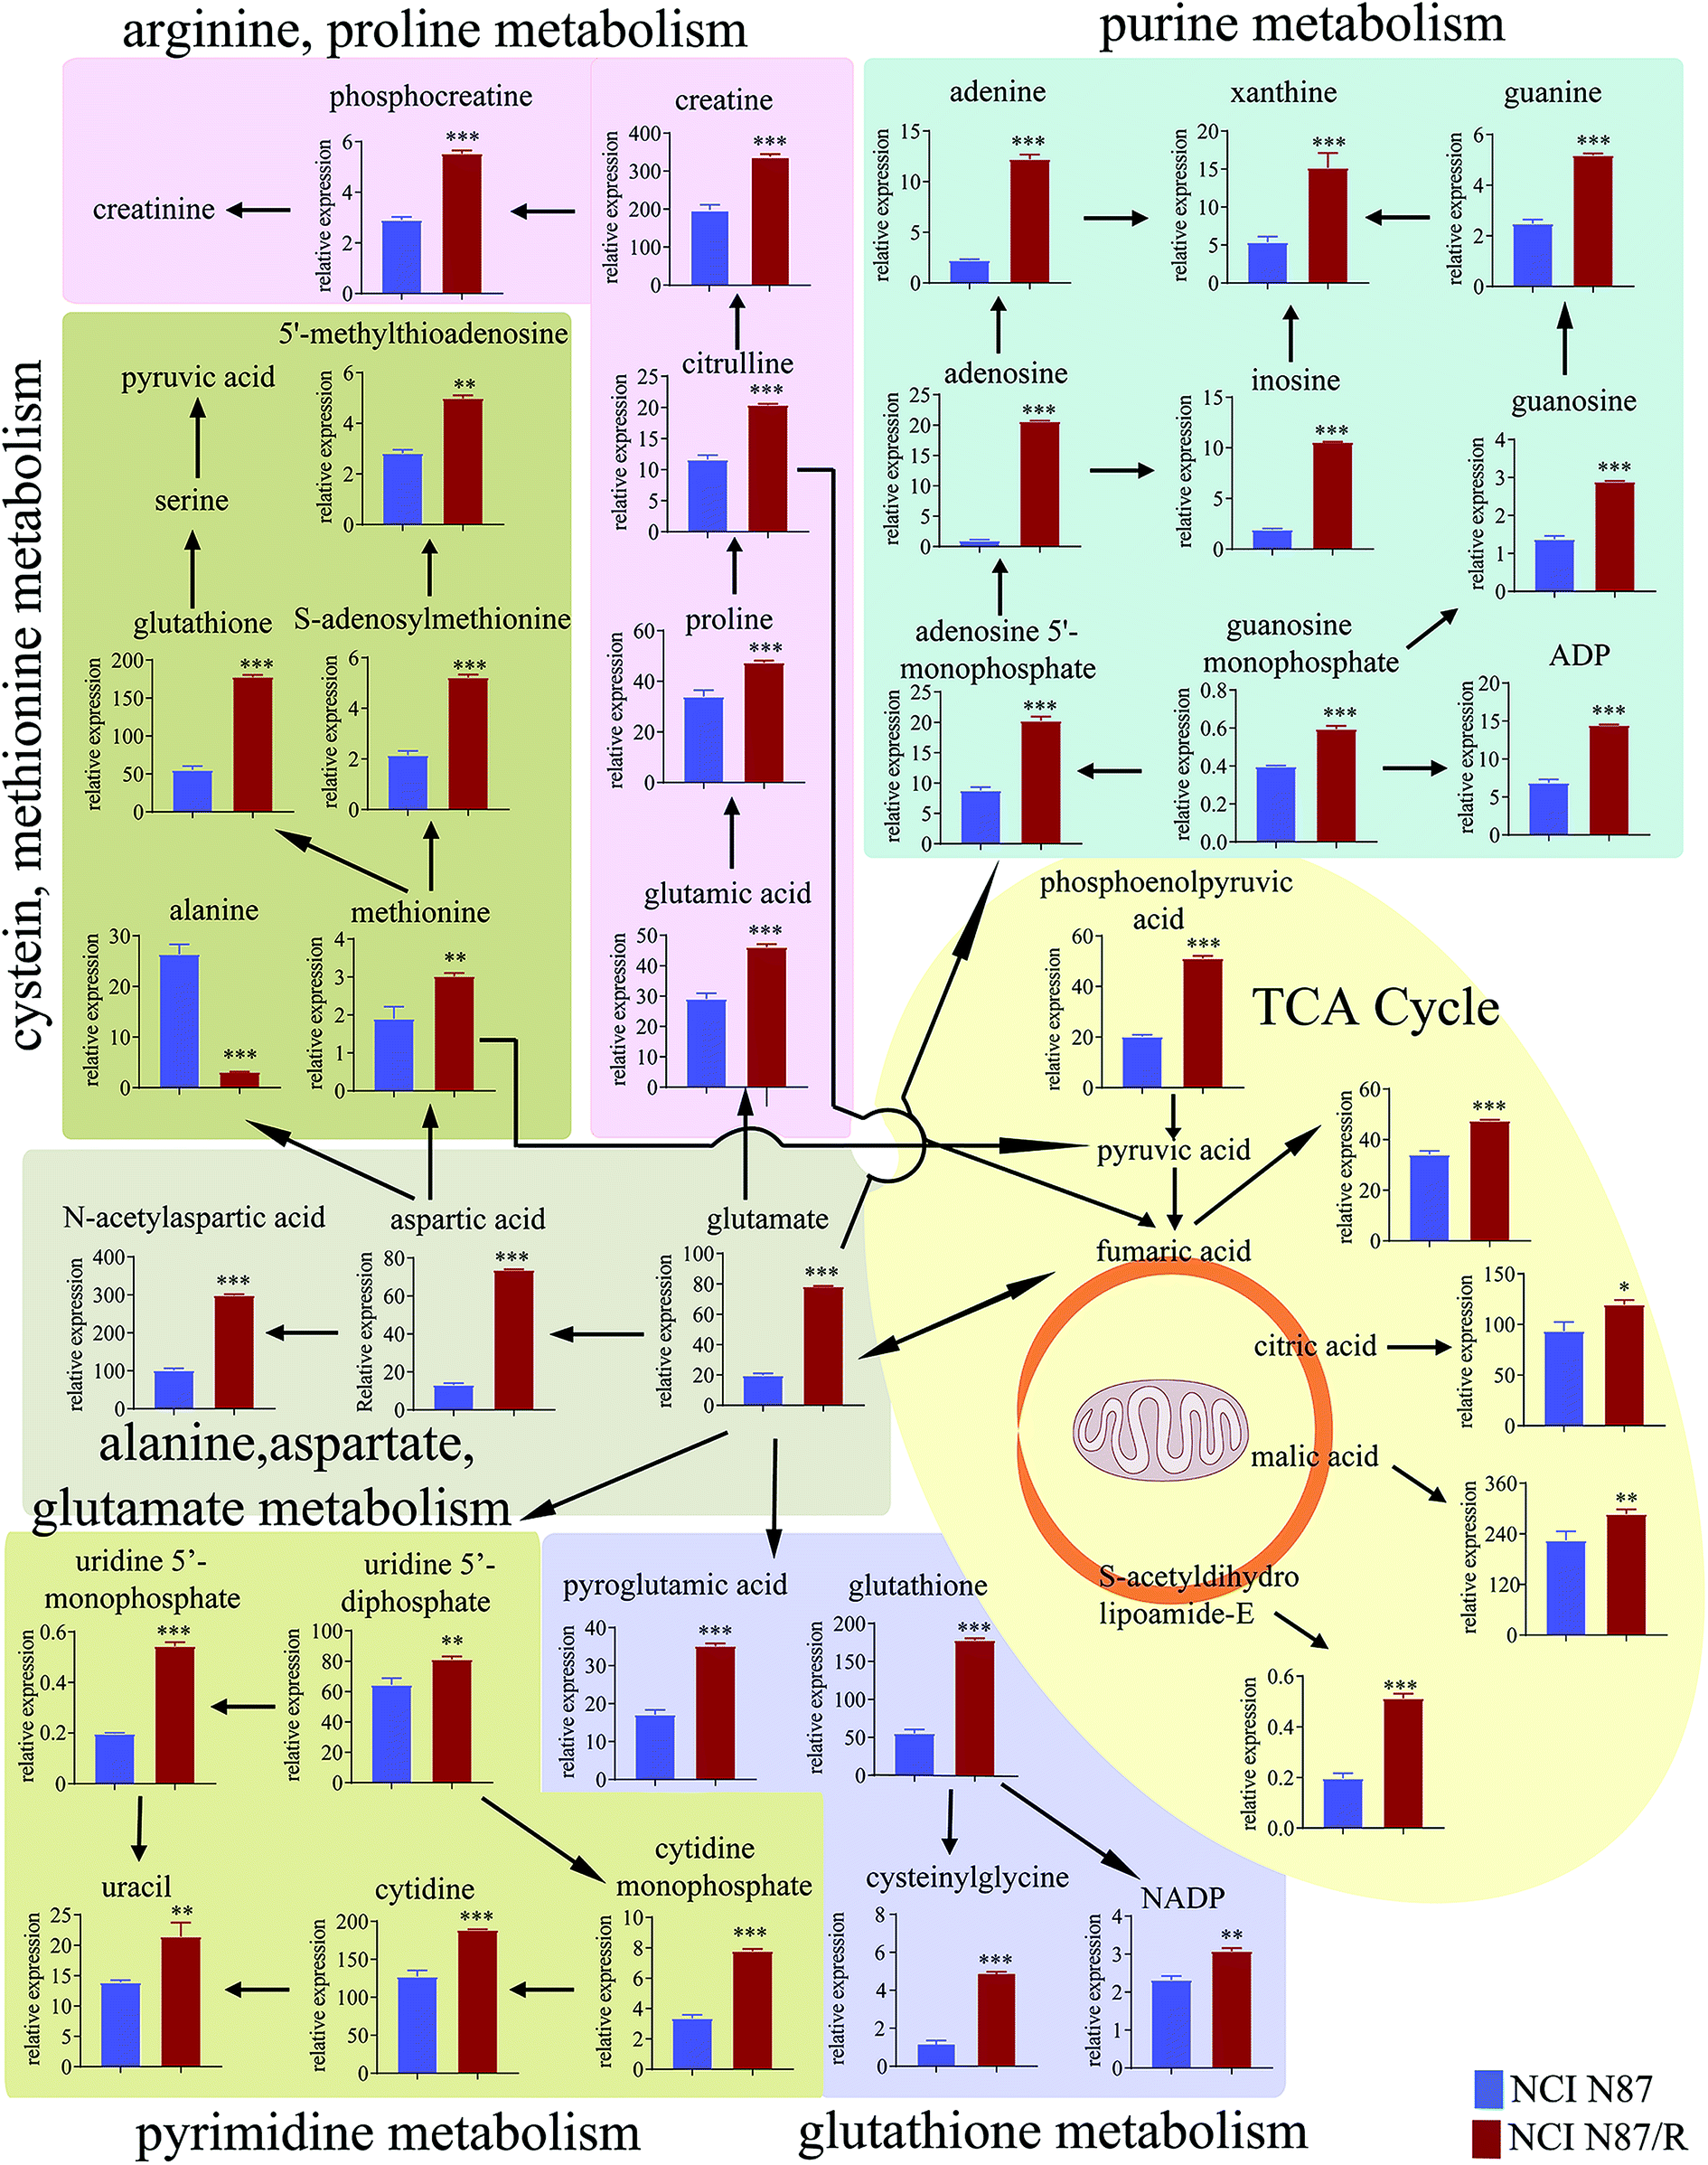
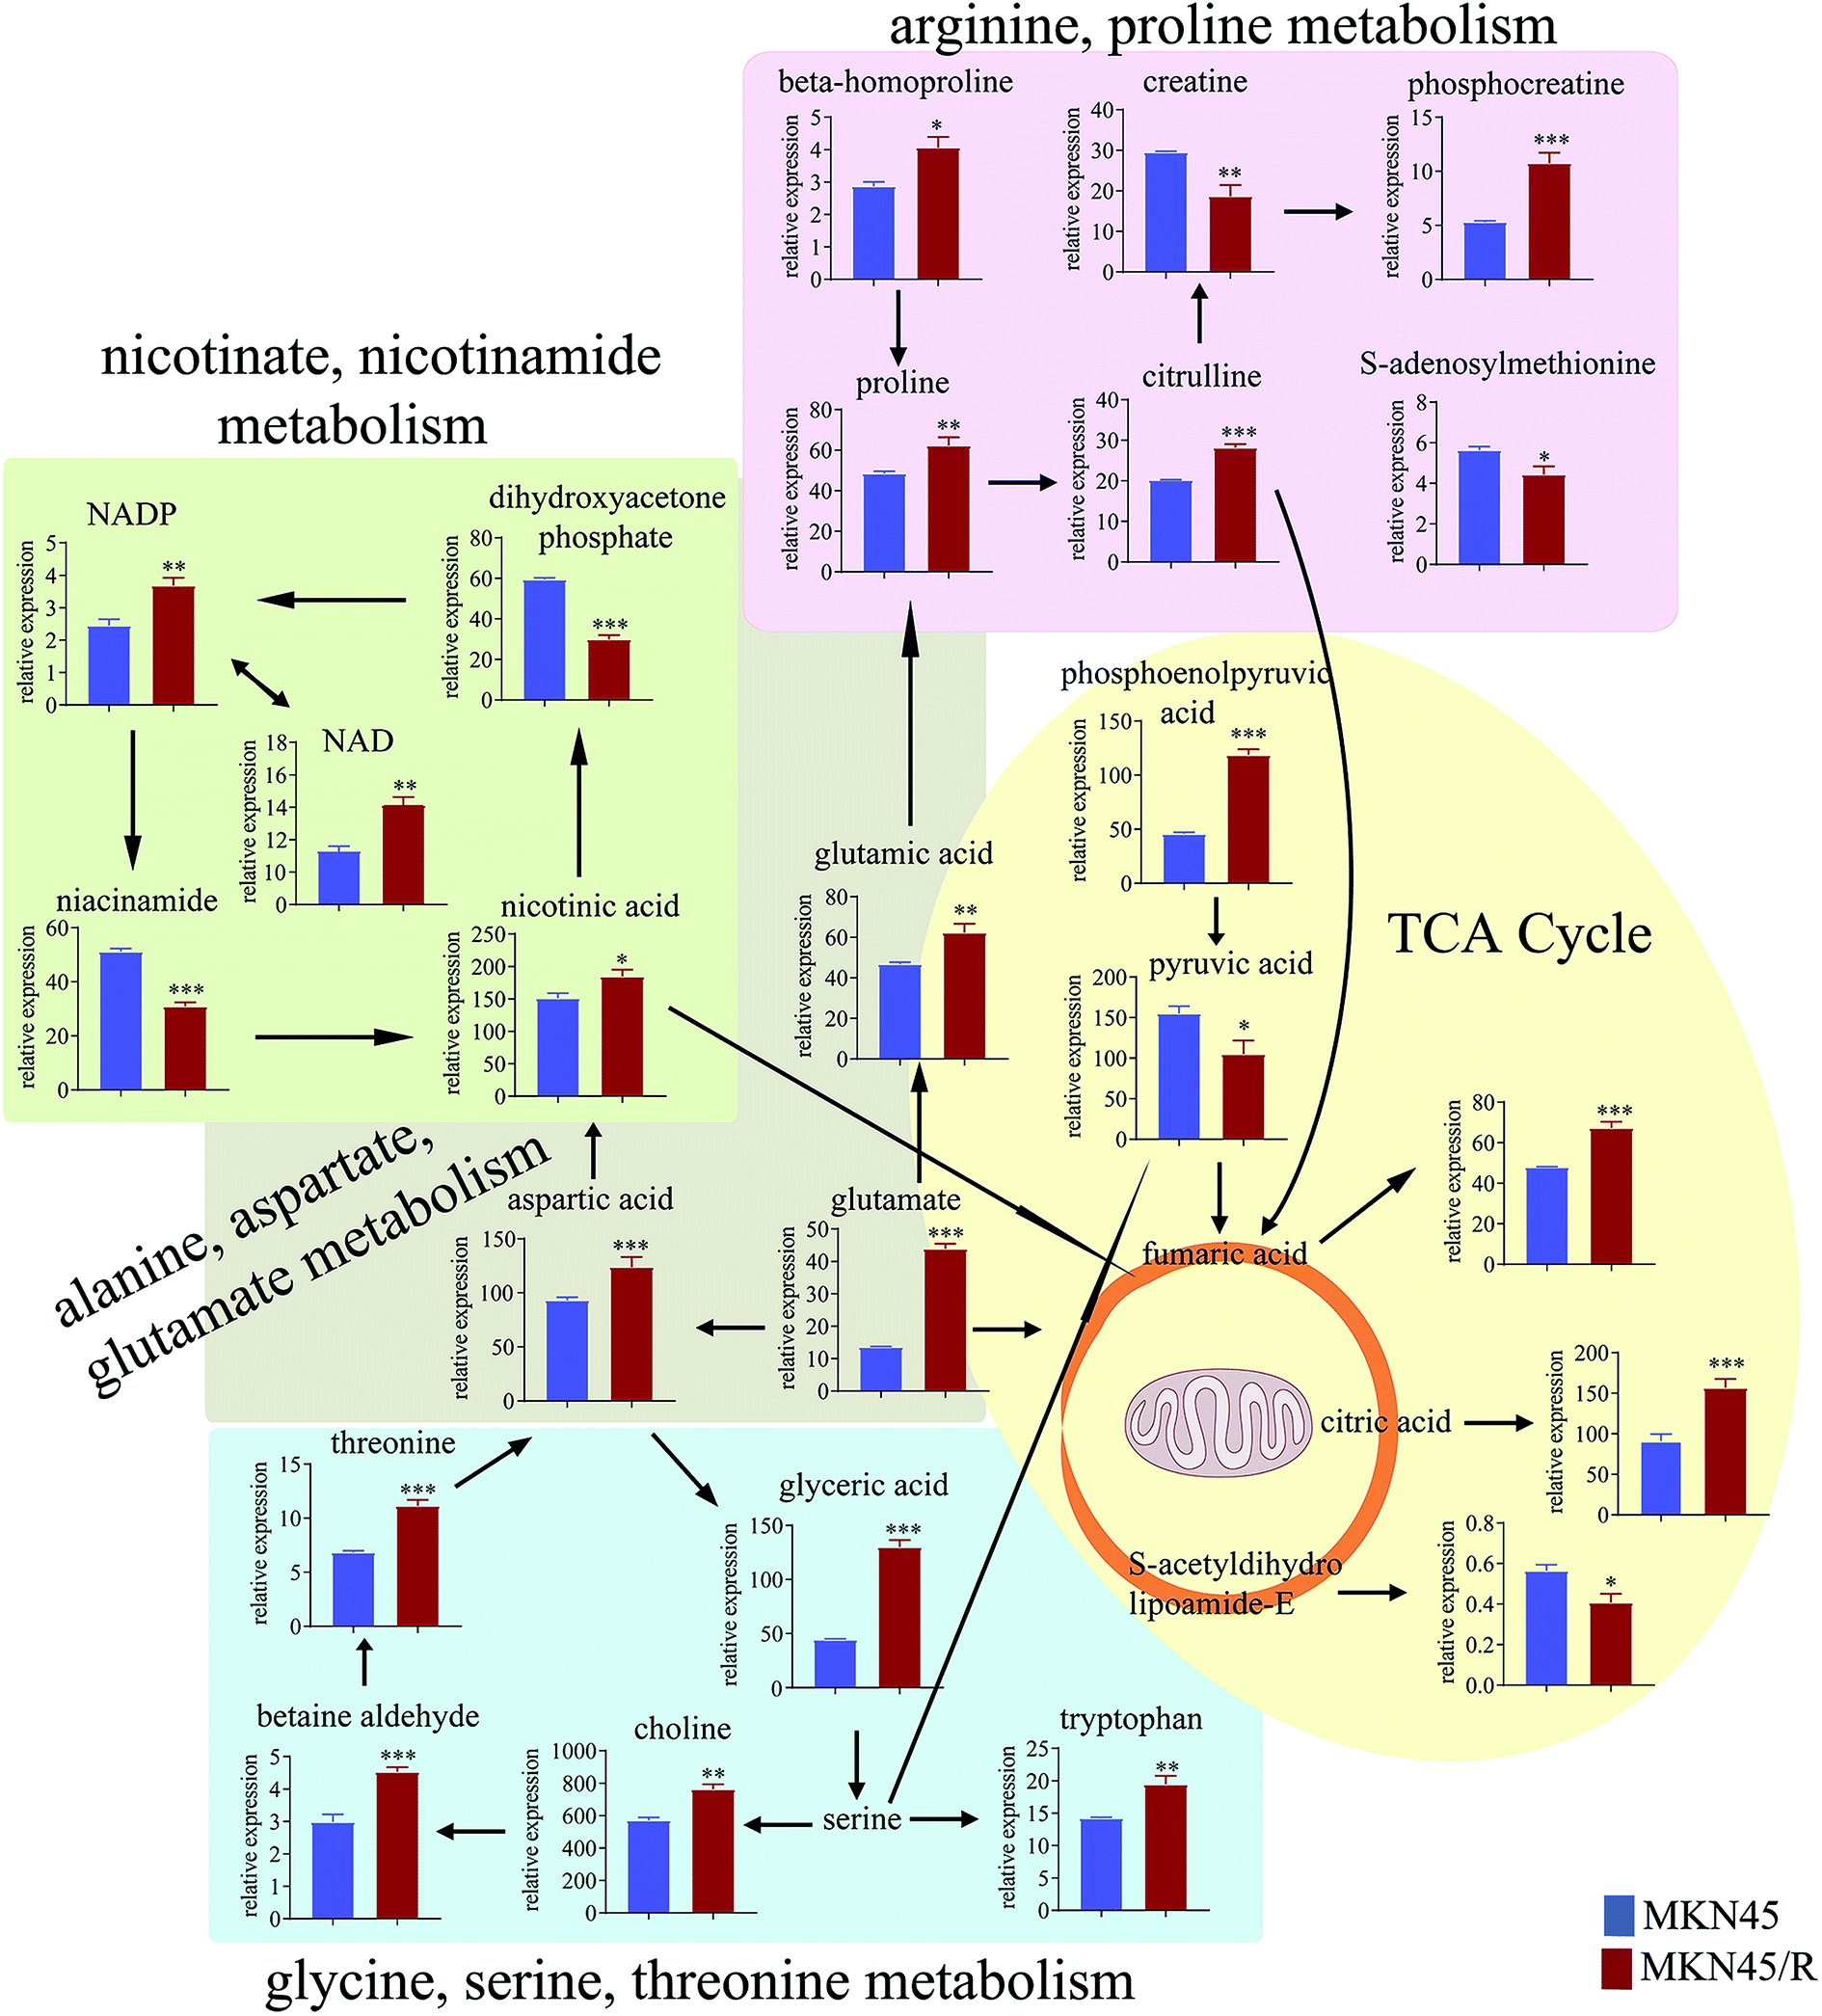
The differential metabolites (VIP > 1, FC ≥ 1.2 or ≤0.83, and p < 0.05) were imported into MetaboAnalyst for metabolic pathway analysis after which potential functional role of the profile alterations associated with trastuzumab resistance were analyzed further. Accordingly, after implementing the pathway library of Homo sapiens, the Fisher's exact test was applied for the pathway enrichment analysis to test if compounds involved in a particular pathway were enriched compared with random hits. Relative-betweenness centrality was used for pathway topology analysis. The pathway impact values were calculated by cumulative percentage according to the matched metabolites numbers while p values were obtained by enrichment analysis based on false FDR and Holm–Bonferroni method. In view of the p value and pathway impact values, the top seven metabolic pathways that emerged with high pathway impact values (>0.2) and low p values (<0.05) were observed in NCI N87/R cells, including (i) alanine, aspartate and glutamate metabolism, (ii) purine metabolism, (iii) arginine and proline metabolism, (iv) TCA cycle, (v) glutathione metabolism, (vi) pyrimidine metabolism, (vii) cysteine and methionine metabolism (Fig. 3A, Table 3) Similarly, the top five pathways obtained in MKN45/R cells included: (i) alanine, aspartate and glutamate metabolism, (ii) nicotinate and nicotinamide metabolism, (iii) arginine and proline metabolism, (iv) glycine, serine and threonine metabolism, (v) TCA cycle (Fig. 3B, Table 4). These metabolic pathways involved amino acid, nucleotide, carbohydrate and cofactors and vitamin metabolism. Apparently among all these pathways, alanine, aspartate and glutamate metabolism, arginine and proline metabolism and TCA cycle were shared by both NCI N87/R and MKN45/R cells. Nevertheless, it was discerned that metabolic pathways of cysteine and methionine, pyrimidine, glutathione and purine metabolism were altered most significantly in NCI N87/R cells. In contrast, glycine, serine, threonine metabolism, and nicotinate, nicotinamide metabolism particularly changed in MKN45/R cells. These identified metabolic pathways were visualized by heatmap respectively (Fig. 4A and B). In addition, we noticed that many metabolites displayed a dramatic increase in trastuzumab resistant cells compared with parental cells, including aspartic acid, fumaric acid, glutamic acid, proline, NADP and NAD, etc. Alanine was down-regulated in NCI N87/R, while pyruvic acid, S-adenosylmethionine, creatine, S-acetyldihydrolipoamide-E, dihydroxyacetone phosphate and niacinamide demonstrated a prominent decrease in MKN45/R cells. The relative normalized quantification of differential metabolites and metabolic pathways were represented by color range (Fig. 4A and B). Next, we comprehensively utilized KEGG database to portray integrated metabolic map to reveal the most relevant metabolic pathways and their potential functions based on pathway enrichment analysis and topology analysis in NCI N87/R and MKN45/R cells respectively. The results were presented manually by drawing integrated metabolic pathway network (Fig. 5 and 6). Apparently all metabolic pathways were strongly associated with TCA cycle, considered as a central route in the cellular respiration machinery that integrates multiple fuel sources such as nucleotide and amino acid, suggesting that TCA cycle regulates the whole of metabolic pathways and promotes metabolic changes in NCI N87/R and MKN45/R cells. Among these, we also noticed that alanine, aspartate and glutamate metabolism exhibited prominent changes with the lowest p values and highest pathway impact values in NCI N87/R (P = 6.96 × 10⁻⁵, pathway impact value = 0.71) and MKN45/R cells (P = 5.32 × 10⁻⁴, pathway impact value = 0.65) (Tables 3 and 4). These results indicate that metabolism in certain amino acids and TCA cycle has common characteristics in NCI N87/R and MKN45/R cells while at the same time exhibiting respective signatures of NCI N87/R and MKN45/R cells. For instance, nicotinate and nicotinamide metabolism was typical in MKN45/R cells while purine, glutathione and pyrimidine were exclusive in NCI N87/R cells.
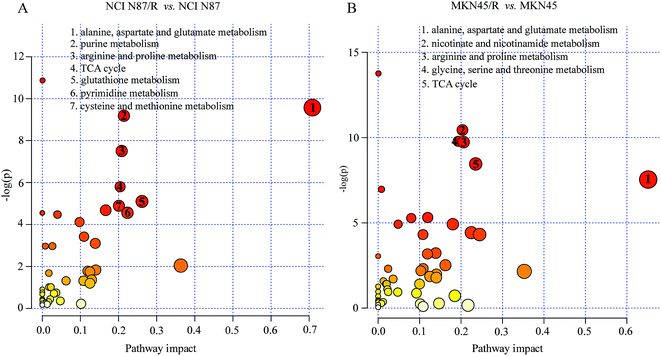 |
| | Fig. 3 Pathway enrichment analysis corresponding to the differential metabolites using MetaboAnalyst in NCI N87 and NCI N87/R (A), MKN45 and MKN45/R cells (B) respectively. The pathway impact values (x-axis) represent the influencing factor of topological analysis, and the –log(p) (y-axis) represents the p value of the pathway enrichment analysis. Size of the nodes shows the influence factor of topological analysis, while color of the nodes indicates p value of the enrichment analysis. The vital metabolic pathways were defined as having –log(p) > 2 and pathway impact factor > 0.2. | |
Table 3 The top seven metabolic pathways enriched via MetaboAnalyst based on all identified differential metabolites in NCI N87/R cells
| No |
Pathway name |
Compound hits |
p-Value |
Holm p |
FDR |
Pathway impact |
| 1 |
Alanine, aspartate and glutamate metabolism |
6/24 |
6.96 × 10⁻⁵ |
0.005 |
0.001 |
0.71 |
| 2 |
Purine metabolism |
11/92 |
1.02 × 10⁻⁴ |
0.007 |
0.002 |
0.21 |
| 3 |
Arginine and proline metabolism |
9/77 |
5.49 × 10⁻⁴ |
0.04 |
0.008 |
0.21 |
| 4 |
TCA cycle |
4/20 |
0.003 |
0.02 |
0.04 |
0.20 |
| 5 |
Glutathione metabolism |
5/38 |
0.006 |
0.05 |
0.06 |
0.26 |
| 6 |
Pyrimidine metabolism |
6/60 |
0.01 |
0.06 |
0.05 |
0.22 |
| 7 |
Cysteine and methionine metabolism |
6/56 |
0.007 |
0.07 |
0.07 |
0.20 |
Table 4 The top five metabolic pathways enriched via MetaboAnalyst based on all identified differential metabolites in MKN45/R cells
| No |
Pathway name |
Compound hits |
p-Value |
Holm p |
FDR |
Pathway impact |
| 1 |
Alanine, aspartate and glutamate metabolism |
5/24 |
5.32 × 10⁻⁴ |
0.03 |
0.006 |
0.65 |
| 2 |
Nicotinate and nicotinamide metabolism |
8/44 |
2.91 × 10⁻⁵ |
0.002 |
7.77 × 10⁻⁴ |
0.21 |
| 3 |
Arginine and proline metabolism |
10/77 |
5.92 × 10⁻⁵ |
0.004 |
9.48 × 10⁻⁴ |
0.21 |
| 4 |
Glycine, serine and threonine metabolism |
8/48 |
5.64 × 10⁻⁵ |
0.004 |
9.48 × 10⁻⁴ |
0.20 |
| 5 |
TCA cycle |
5/20 |
2.13 × 10⁻⁴ |
0.01 |
0.002 |
0.23 |
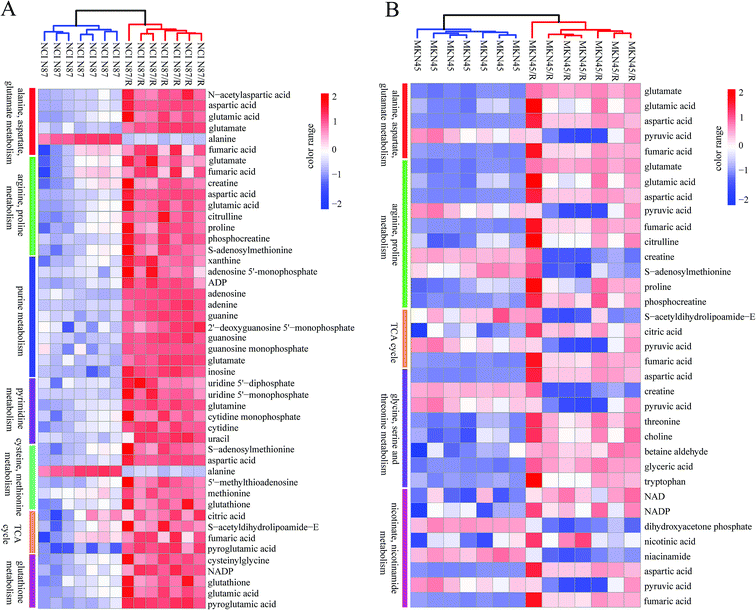 |
| | Fig. 4 Heat map visualization of differential metabolites from significantly altered pathways in (A) NCI N87/R and NCI N87 cells, and (B) MKN45/R and MKN45 cells. Each row represents a metabolite and each column represents a sample. The increased and decreased metabolites are represented by range of red and blue intensities, respectively. | |
 |
| | Fig. 5 Network analysis of significantly changed metabolic pathways and quantification of differential metabolites. The top seven metabolic pathways in NCI N87/R cells were analyzed. Each colored map indicates a different pathway. Quantitative results of increased and decreased metabolites were expressed as mean ± SEM of seven independent experiments.*p < 0.05,**p < 0.01,***p < 0.001 vs. NCI N87. | |
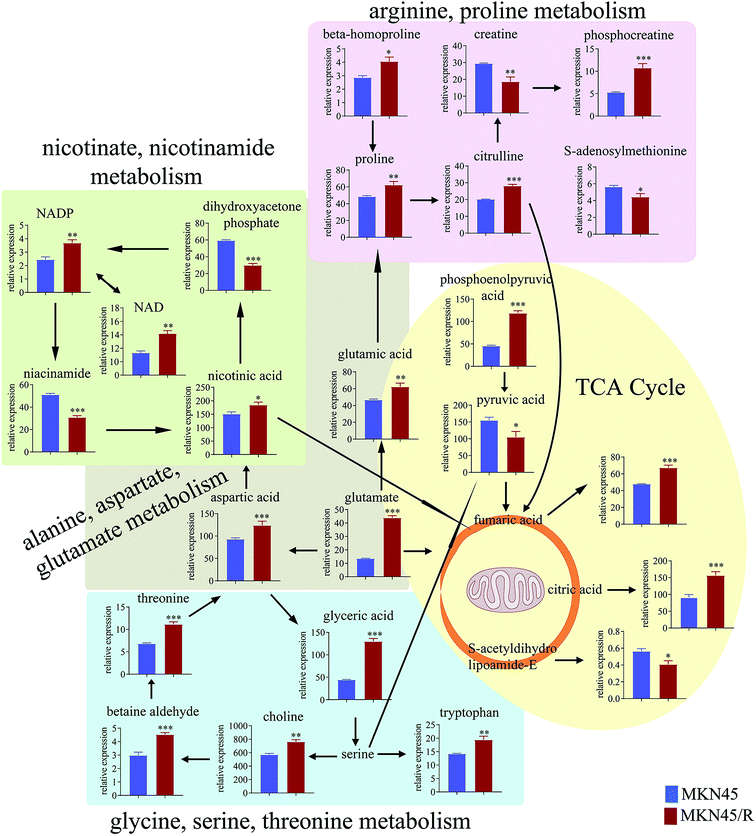 |
| | Fig. 6 Network analysis of significantly changed metabolic pathways and quantification of differential metabolites. The five metabolic pathways in MKN45/R cells were analyzed. Each colored map indicates a different pathway. Quantitative results of increased and decreased metabolites were expressed as mean ± SEM of five independent experiments. *p < 0.05, **p < 0.01, ***p < 0.001 vs. MKN45. | |
3.5 Metabolomics–proteomics network analysis and validation
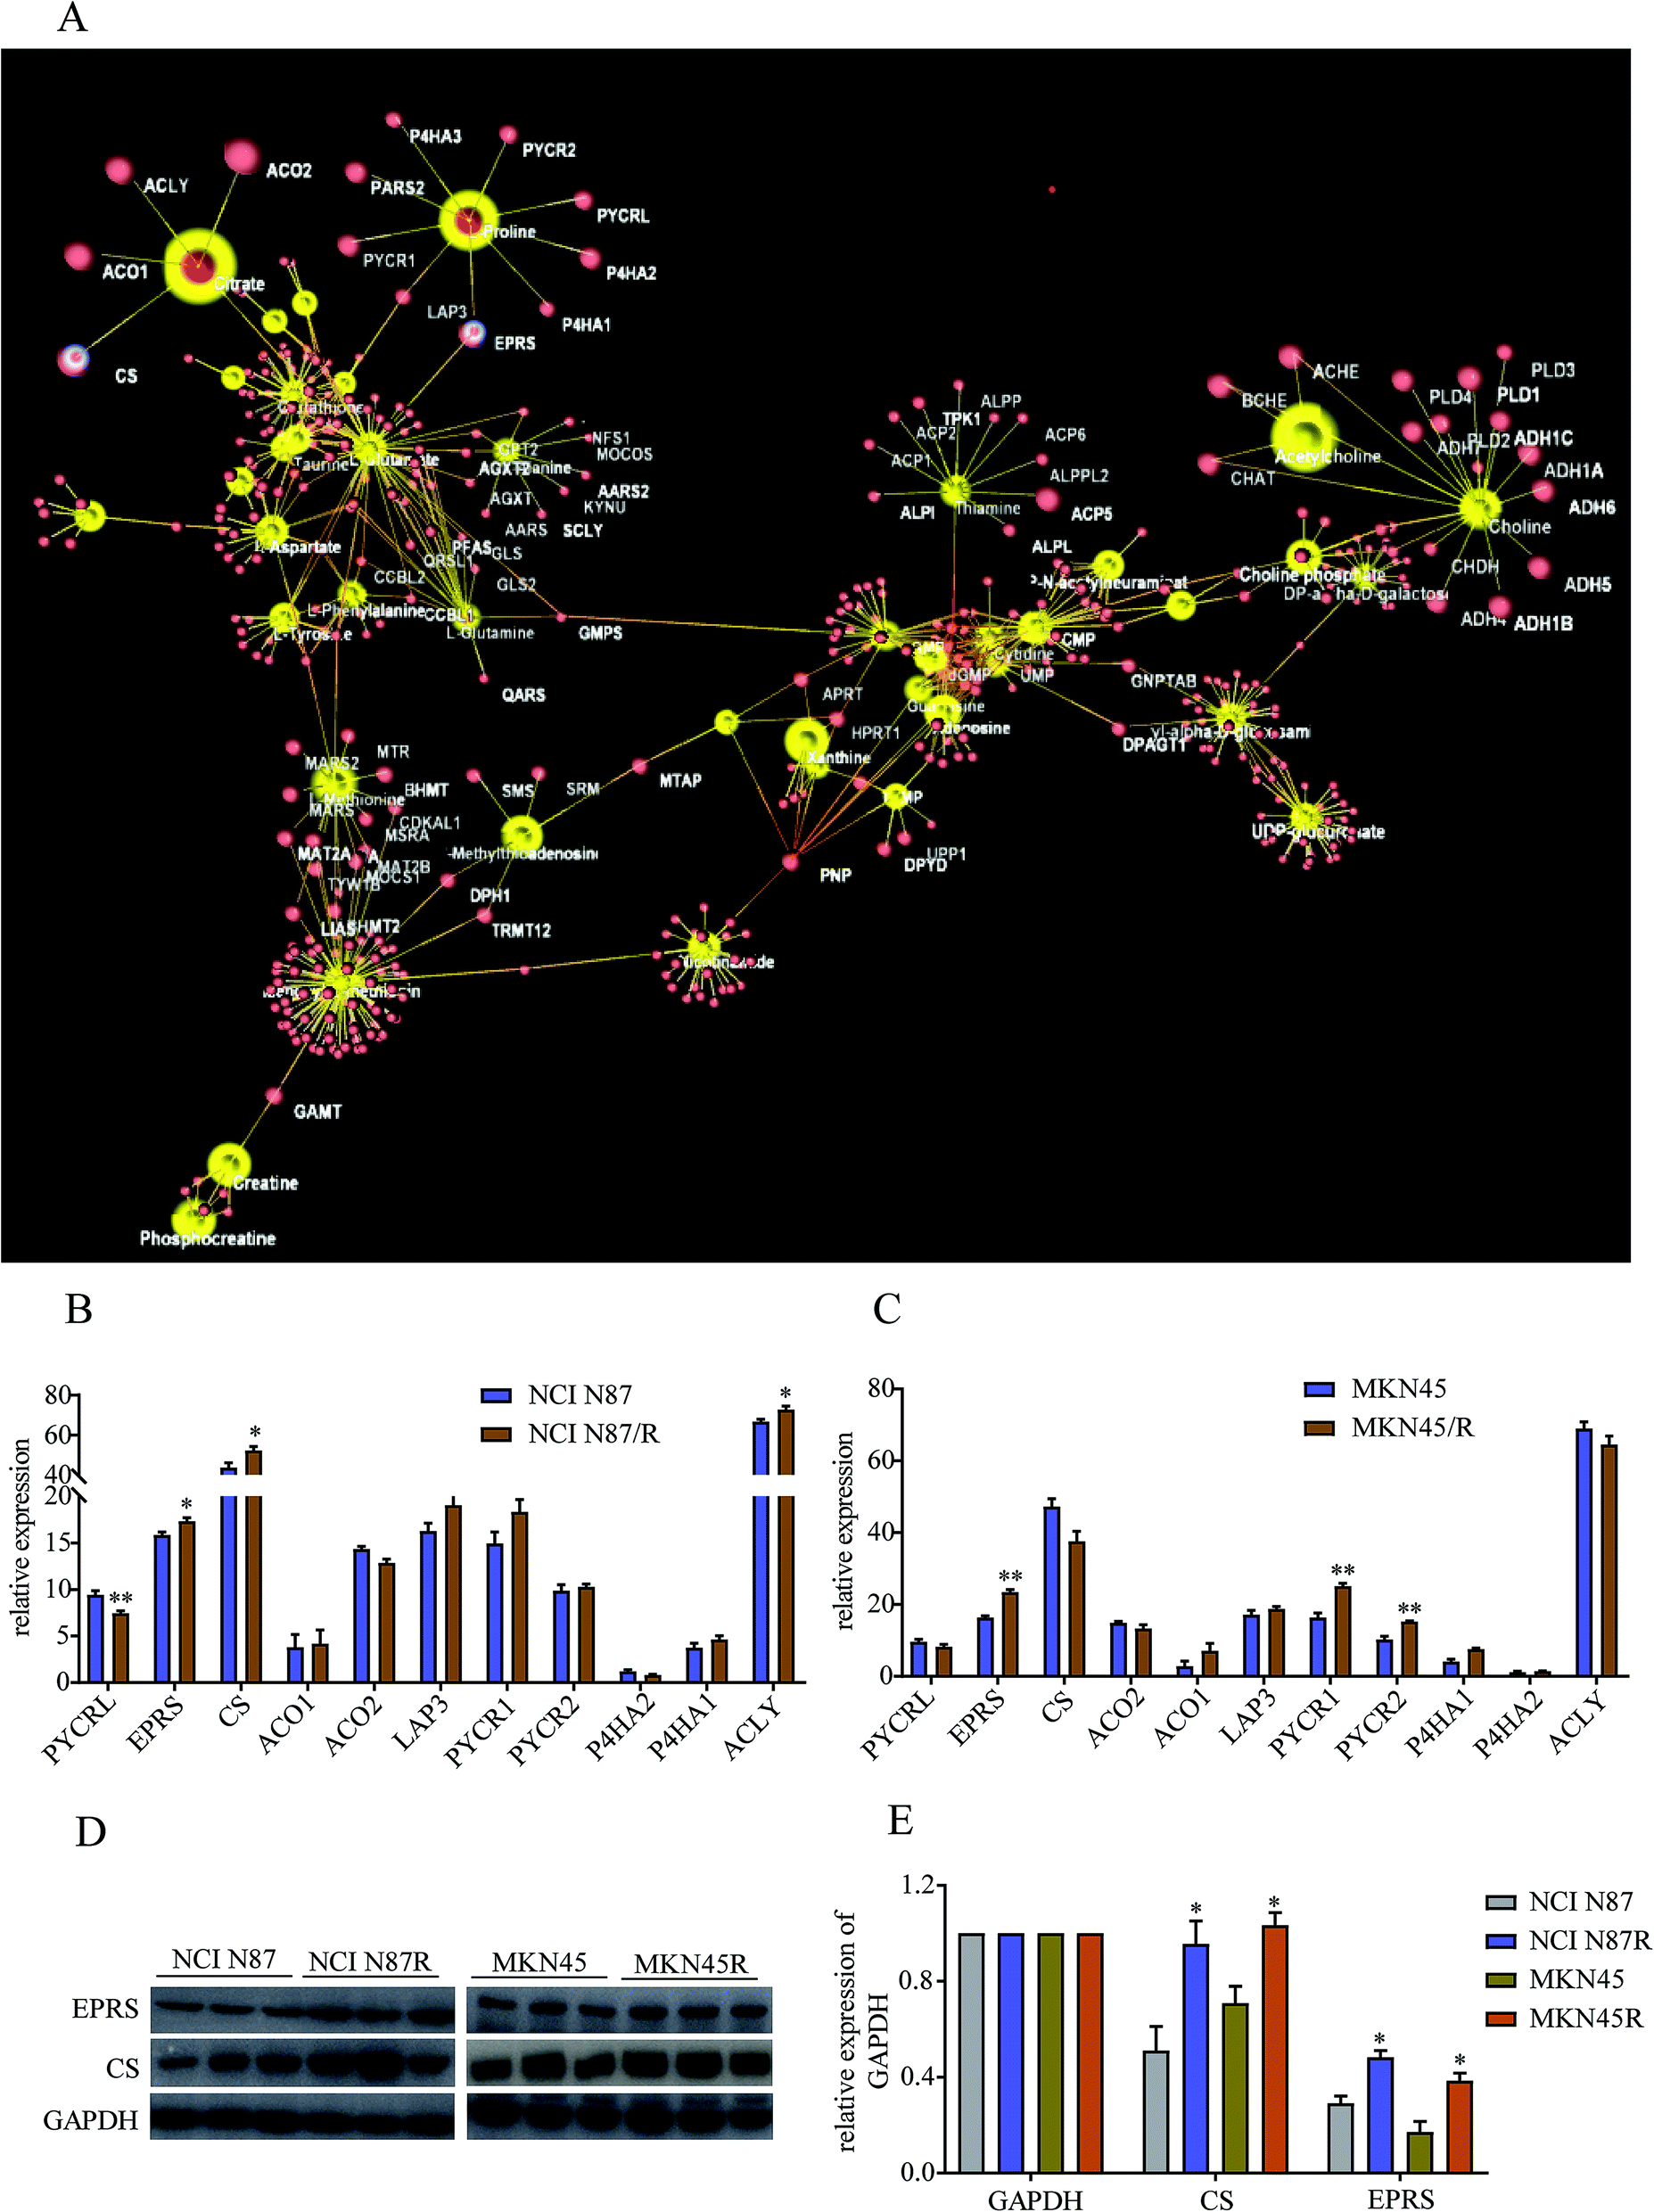
To further explore regulatory relationships of the biologically related molecules, we constructed a metabolomics–proteomics network of differential metabolites and regulatory target genes based on the OmicsNet website, the results of which were represented by an integrated network (Fig. 7A). Fortunately, we noticed citrate, a key metabolite in TCA cycle, was regulated by four target genes, including citrate synthase (CS), cytoplasmic aconitate hydratase 1/2 (ACO1/2), and ATP-citrate synthase (ACLY). Similarly, proline was regulated by glutamyl-prolyl tRNA synthetase (EPRS), cytosol aminopeptidase (LAP3), pyrroline-5-carboxylate reductase 1/2 (PYCR1/2), pyrroline-5-carboxylate reductase 3 (PYCRL), probable proline--tRNA ligase (PARS2) and prolyl 4-hydroxylase subunit alpha 1/2/3 (P4HA1, P4HA2 and P4HA3). Proteomics results demonstrated relatively high levels of CS, ACLY and EPRS and low levels of PYCRL in NCI N87/R cells while EPRS, PYCR1/2 showed prominent up-regulation in MKN45/R cells compared with their parental cells (p < 0.05, p < 0.01) (Fig. 7B and C). Other target genes regulating citrate and proline which include LAP3, ACO1/2 and P4HA 1/2/3 showed no significant changes in resistant cells compared to their parental cells (p > 0.05), indicating CS, ACLY, EPRS, PYCRL and PYCR1/2 have major roles in regulating citrate and proline. Next, we further confirmed the expression levels of CS and EPRS in NCI N87/R and MKN45/R cells by western blot (Fig. 7D and E) which were consistent with proteomics results.
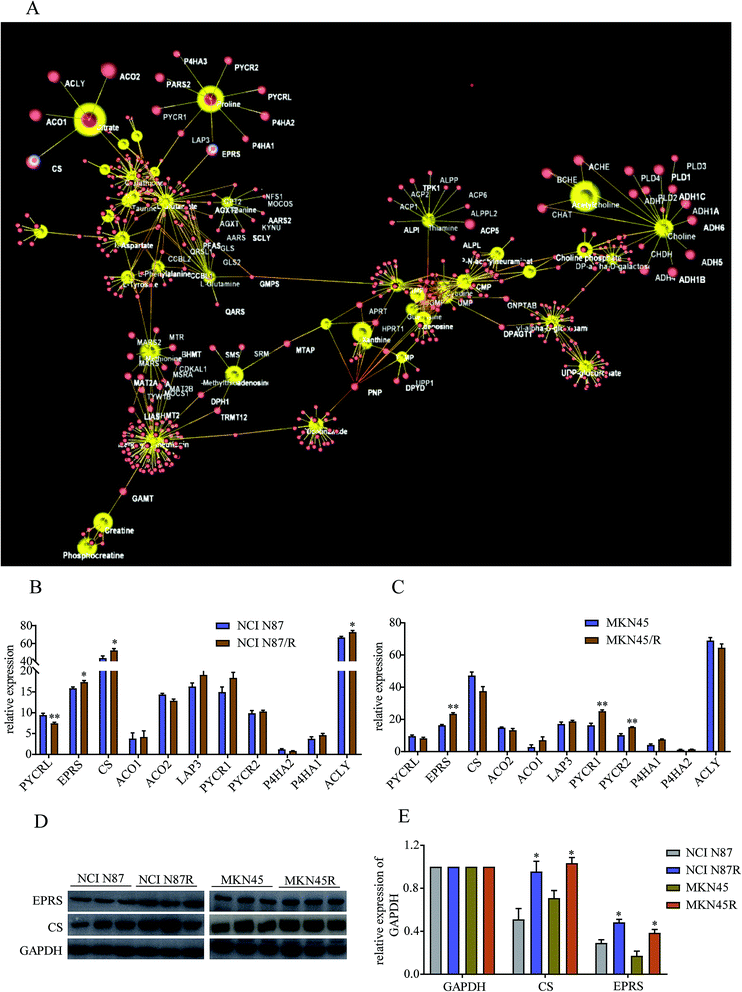 |
| | Fig. 7 Analysis of differentially expressed metabolites and target genes. (A) Constructing the metabolomics–proteomics network of differential metabolites and regulatory target genes based on the OmicsNet website. Red nodes represent target genes, yellow nodes represent differential metabolites in NCI N87/R and MKN45/R cells respectively. CS and EPRS are highlighted due to verification by western blot. (B and C) CS and EPRS proteins were quantified by mass spectrometry respectively. (D) CS and EPRS proteins were detected using western blot with GAPDH as loading control. (E) Quantification of western blot signals in two groups of cell lines. Three independent biological replicates are shown as mean ± SEM. *p < 0.05, **p < 0.01 vs. controls. | |
4. Discussion
Although trastuzumab is one of the most effective antibody drug targeting HER-2 positive advanced gastric and breast cancer, trastuzumab resistance has become a universal phenomenon in clinical therapy. Underlying mechanism of drug resistance has not been fully understood further complicating the situation. Mounting evidence demonstrates that acquired resistance of tumor is closely related to abnormal metabolism such as alternative metabolic pathways involved in biosynthesis and catabolism.23 Besides, it is widely acknowledged that metabolomic reprogramming often occurs in drug-resistant cancer cells to adapt for survival and proliferation.24 Previous work has shown that gemcitabine resistance in pancreatic cancer cells reprogrammed glucose metabolism and enhanced pyrimidine synthesis.20 Recent metabolomics has revealed that methionine degradation and cysteine biosynthesis are two canonical pathways related to platinum resistance in ovarian cancer cells.25 In our study, global metabolomics was performed to profile the specific metabolic pathways and metabolic signatures between trastuzumab resistant gastric cancer cells and parental cells. Pathways enrichment analysis revealed that metabolic pathways including those of amino acid, energy, cofactors and nucleotide metabolism were prominently altered in NCI N87/R and MKN45/R cells, suggesting the contribution of these pathways in maintaining trastuzumab resistance.
TCA cycle is a central hub for oxidative phosphorylation and supervises energy metabolism, protein biosynthesis and redox balance in cells. Aberrant TCA cycle function is implicated in a wide variety of biological processes including drug resistance of cancer cells.26 Previous studies have shown that cancer cells can uncouple glycolysis from TCA cycle allowing the use of additional fuel sources to meet their heightened metabolic needs, such as glutamine, which is the most important amino acid in organisms, serving to transport nitrogen for biosynthesis of nonessential amino acids, such as purines, pyrimidines, and fatty acid, or entering the TCA cycle in the form of α-ketoglutarate.27 Our results manifest that citric acid, fumaric acid, and phosphoenolpyruvic acid, which are intermediate metabolites and promote the up-regulation of TCA cycle, increased significantly in NCI N87/R and MKN45/R cells suggesting that high levels of these metabolites in TCA cycle contribute to trastuzumab resistance. Moreover, we analyzed target genes regulating citric acid from our previous proteomics data. CS, a crucial enzyme in TCA cycle, catalyzes the reaction between oxaloacetic acid and acetyl-CoA to synthesize citric acid. A growing body of evidence indicate that high levels of CS is closely associated with tumor metastasis, proliferation and drug resistance by increasing ATP synthesis which contribute to cell proliferation and drug resistance.28,29 Consistent with these studies, our results from proteomics data displayed that CS was upregulated in trastuzumab resistant cells compared with parental cells, suggesting its contribution to trastuzumab resistance. ACLY, another key cytosolic enzyme, catalyzes the cleavage of citrate into oxaloacetate and acetyl-CoA, the latter serving as common substrate for de novo lipogenesis. The upregulated fatty acid synthesis is the most important metabolic pathway for the proliferation and survival of cancer cells.30 Increasing evidence suggests that high expression of ACLY promote tumor progression and drug resistance by upregulating metabolic pathways, including gluconeogenesis and glycolysis, glutamine metabolism, and fatty acid synthesis.30,31 Our results suggest that high expression of ACLY regulates trastuzumab resistance by controlling citric acid levels to improve energy supply for cancer cells.
Proline, synthesized from glutamate, can be interconverted to other substrates and is the source of carbon exchange between TCA cycle and urea cycle.32 Here, EPRS, PYCRL and PYCR1/2, genes that regulate proline biosynthesis, catabolism and cycling, were identified by proteomics data. EPRS catalyzes the attachment of glutamate/proline to the corresponding tRNA. High expression of EPRS is closely correlated with tumor proliferation, poor prognosis and drug resistance.33 However, the underlying mechanisms involving in tumor metabolism and drug resistance remain unclear. PYCR1/2 (located in the mitochondria) is a class of housekeeping enzyme that catalyzes the proline biosynthesis and involved in signal transduction, apoptosis, redox potential and mitochondrial integrity.34,35 High expression of PYCR1/2 is proved in a variety of malignancies, and promotes tumor growth and drug resistance by generating redox NADP+, which increases the activity of the pentose phosphate pathway, glycolysis and ATP production.35,36 PYCRL (located in the cytosol), an isozyme of PYCR1/2, prefers to reduce nicotinamide adenine dinucleotide phosphate (NADPH) for a cofactor. Our results displayed that PYCR1/2 increased and PYCRL was decreased in trastuzumab resistant cells when compared with parental cells respectively, indicating that proline biosynthesis was enhanced in resistant cells.
Alanine, aspartate and glutamate metabolism provides a critical fuel for cancer cells proliferation and survivability. Specifically, glutamate is an indispensable nitrogen and carbon source for synthesis of amino acid, nucleobases and hexosamines.37 Aspartate is also necessary in several cancers for biosynthetic process which promotes tumor proliferation, migration and invasion.38 Thus, alterations in alanine, aspartate and glutamate metabolism may be an important process for drug resistance acquisition. Our results show that alanine, aspartate and glutamate metabolism was considerably altered in trastuzumab resistant cells, which are consistent with this viewpoint.
Glycine, serine and threonine metabolism are needed for the synthesis of proteins and nucleic acid, while they are also necessary for cancer cell survival.39 We noticed that glycine, serine and threonine metabolism is peculiar to MKN45/R cells and displayed a prominent change, suggesting that NCI N87/R and MKN45/R cells possess their particular characteristics.
It is well known that glutathione is a key substrate for protecting cells from oxidative stress, it is also indispensable to maintain NADPH/NADP+ ratio. Previous study indicated that the level of glutathione metabolism was higher in A2780 resistant ovarian cancer cells compared with sensitive cells.40 Another study demonstrated that although the intracellular glutathione level increases after exposure to cisplatin, there is no clear correlation between the intracellular glutathione in ovarian cancer cells and their resistance to cisplatin neither after initial nor after repeated exposure to this drug.41 Our results display that glutathione, cysteinylglycine, pyroglutamic acid and NADP, which are key metabolites of glutathione metabolism, elevated prominently in NCI N87/R cells, suggesting that trastuzumab resistant cells had stronger anti-oxidative ability than parental cells. Another study suggested that higher level of methionine contributed to oxidation resistance, promoting proliferation of cancer cells and protecting cancer cells against chemotherapeutic drugs.42 We noticed an accumulation of methionine in NCI N87/R cells which promoted antioxidation in trastuzumab resistant cells.
We also found a dramatic change of pyrimidine/purine metabolism in trastuzumab resistant cells. The levels of relevant metabolites such as uridine 5′-diphosphate, uridine 5′-monophosphate, cytidine monophosphate, cytidine and uracil were elevated in pyrimidine metabolism whereas ADP, guanosine, guanosine monophosphate, guanine, adenosine, adenine, inosine xanthine, adenosine 5′-monophosphate and 2′-deoxyguanosine 5′-monophosphate were increased in purine metabolism in NCI N87/R compared with NCI N87 cells. The reason for high levels of pyrimidine/purine metabolisms is still unclear.
Abbreviations
| HER-2 | Human epidermal growth factor receptor-2 |
| MVDA | Multivariate statistical data analysis |
| QC | Quality control |
| NCE | Normalized collisional energy |
| PCA | Principal component analysis |
| OPLS-DA | Orthogonal partial least square discriminant analysis |
| VIP | Variable importance in the projection |
| FC | Fold change |
| NADP | Nicotinamide adenine dinucleotide phosphate |
| NAD | Nicotinamide adenine dinucleotide |
| CS | Citrate synthase |
| ACO1/2 | Cytoplasmic aconitate hydratase 1/2 |
| ACLY | ATP-citrate synthase |
| EPRS | Glutamyl-prolyl tRNA synthetase |
| LAP3 | Cytosol aminopeptidase |
| PYCR1/2 | Pyrroline-5-carboxylate reductase 1/2 |
| PYCRL | Pyrroline-5-carboxylate reductase 3 |
| PARS2 | Probable proline--tRNA ligase |
| P4HA1/2/3 | Prolyl 4-hydroxylase subunit alpha 1/2/3 |
| TCA cycle | Tricarboxylic acid cycle |
| NADPH | Nicotinamide adenine dinucleotide phosphate |
| HMDB | Human metabolome database |
| KEGG | Kyoto encyclopedia of genes and genomes |
| NMR | Nuclear magnetic resonance |
| LC/MS | Liquid chromatography-mass spectrometry |
| GC/MS | Gas chromatography-mass spectrometry |
Conflicts of interest
There are no conflicts to declare.
Acknowledgements
This work was funded by the applied basic research programs of Science and Technology of Sichuan, China (Grant No. 2019YJ0378), the project of Science and Technology of Nanchong, China (Grant No. 18SXHZ0402), the project of Sichuan Province Education Department, China (Grant No. 17ZB0170), and the research fund for doctoral program of North Sichuan Medical College (Grant No. CBY17-QD05). Data acquisition of UHPLC-Q Exactive-MS/MS was accomplished by Biotree Biotech Co., Ltd. (Shanghai, China).
References
- R. L. Siegel, K. D. Miller and A. Jemal, Cancer statistics, Ca-Cancer J. Clin., 2019, 69, 7–34 CrossRef PubMed.
- Y. Fu, R. Gui and J. Liu, HER-2-induced PI3K signaling pathway was involved in the pathogenesis of gastric cancer, Cancer Gene Ther., 2015, 22, 145–153 CrossRef CAS PubMed.
- Z. Wang, W. Wang, S. Xu, S. Wang, Y. Tu, Y. Xiong, J. Mei and C. Wang, The role of MAPK signaling pathway in the Her-2-positive meningiomas, Oncol. Rep., 2016, 36, 685–695 CrossRef CAS PubMed.
- A. Ruiz-Saenz, C. Dreyer, M. R. Campbell, V. Steri, N. Gulizia and M. M. Moasser, HER2 amplification in tumors activates PI3K/Akt signaling independent of HER3, Cancer Res., 2018, 78, 3645–3658 CAS.
- F. Li, L. Zhang, F. Feng, K. Zheng, Y. Li, T. Wang and G. Ren, Livin participates in resistance to trastuzumab therapy for breast cancer through ERK1/2 and AKT pathways and promotes EMT-like phenotype, RSC Adv., 2018, 8, 28588–28601 RSC.
- M. H. Jin, A. R. Nam, J. E. Park, J. H. Bang, Y. J. Bang and D. Y. Oh, Resistance mechanism against trastuzumab in HER2-positive cancer cells and its negation by Src inhibition, Mol. Cancer Ther., 2017, 16, 1145–1154 CrossRef CAS PubMed.
- Z. Sun, Y. Shi, Y. Shen, L. Cao, W. Zhang and X. Guan, Analysis of different HER-2 mutations in breast cancer progression and drug resistance, J. Cell. Mol. Med., 2015, 19, 2691–2701 CrossRef CAS PubMed.
- J. Liu, C. Pan, L. Guo, M. Wu, J. Guo, S. Peng, Q. Wu and Q. Zuo, A new mechanism of trastuzumab resistance in gastric cancer: MACC1 promotes the Warburg effect via activation of the PI3K/AKT signalling pathway, J. Hematol. Oncol., 2016, 9, 76 CrossRef PubMed.
- Y. Sun, Tumor microenvironment and cancer therapy resistance, Cancer Lett., 2016, 380, 205–215 CrossRef CAS PubMed.
- M. D. Galsky, Resistance to prostate-cancer treatment is driven by immune cells, Nature, 2018, 559, 338–339 CrossRef CAS PubMed.
- S. M. Shaffer, M. C. Dunagin, S. R. Torborg, E. A. Torre, B. Emert, C. Krepler, M. Beqiri, K. Sproesser, P. A. Brafford, M. Xiao, E. Eggan, I. N. Anastopoulos, C. A. Vargas-Garcia, A. Singh, K. L. Nathanson, M. Herlyn and A. Raj, Rare cell variability and drug-induced reprogramming as a mode of cancer drug resistance, Nature, 2017, 546, 431–435 CrossRef CAS PubMed.
- L. Schwartz, C. T. Supuran and K. O. Alfarouk, The Warburg effect and the hallmarks of cancer, Anti-Cancer Agents Med. Chem., 2017, 17, 164–170 CrossRef CAS PubMed.
- W. Liu, J. Chang, M. Liu, J. Yuan, J. Zhang, J. Qin, X. Xia and Y. Wang, Quantitative proteomics profiling reveals activation of mTOR pathway in trastuzumab resistance, Oncotarget, 2017, 8, 45793–45806 Search PubMed.
- W. Liu, J. Yuan, Z. Liu, J. Zhang and J. Chang, Label-Free quantitative proteomics combined with biological validation reveals activation of Wnt/β-catenin pathway contributing to trastuzumab resistance in gastric cancer, Int. J. Mol. Sci., 2018, 19, 1981 CrossRef PubMed.
- J. Chang, Y. Wang, F. Zhang and W. Liu, Proteomic study of transcription factors in trastuzumab-resistant gastric cancer based on liquid chromatography-mass spectrometry technique, Chin. J. Anal. Chem., 2019, 47, 1035–1044 CAS.
- J. K. Nicholson and J. C. Lindon, Systems biology: metabonomics, Nature, 2008, 455, 1054–1056 CrossRef CAS PubMed.
- D. S. Wishart, Metabolomics for investigating physiological and pathophysiological processes, Physiol. Rev., 2019, 99, 1819–1875 CrossRef PubMed.
- R. Chen, J. Wang, C. Liao, L. Zhang, Q. Guo and X. Wang, Exploring the biomarkers and therapeutic mechanism of kidney-yang deficiency syndrome treated by You-gui pill using systems pharmacology and serum metabonomics, RSC Adv., 2018, 8, 1098–1115 RSC.
- M. Rahman and M. R. Hasan, Cancer metabolism and drug resistance, Metabolites, 2015, 5, 571–600 CrossRef CAS PubMed.
- T. Gebregiworgis, F. Bhinderwala, V. Purohit, N. V. Chaika, P. K. Singh and R. Powers, Insights into gemcitabine resistance and the potential for therapeutic monitoring, Metabolomics, 2018, 14, 156 CrossRef PubMed.
- S. Bijlsma, L. Bobeldijk, E. R. Verheij, R. Ramaker, S. Kochhar, I. A. Macdonald, B. van Ommen and A. K. Smilde, Large-scale human metabolomics studies: a strategy for data (pre-) processing and validation, Anal. Chem., 2006, 78, 567–574 CrossRef CAS PubMed.
- J. Chong, O. Soufan, C. Li, I. Caraus, S. Li, G. Bourque, D. S. Wishart and J. Xia, MetaboAnalyst 4.0: towards more transparent and integrative metabolomics analysis, Nucleic Acids Res., 2018, 46, W486–W494 CrossRef CAS PubMed.
- Y. Zhao, H. Liu, Z. Liu, Y. Ding, S. P. Ledoux, G. L. Wilson, R. Voellmy, Y. Lin, W. Lin, R. Nahta, B. Liu, O. Fodstad, J. Chen, Y. Wu, J. E. Price and M. Tan, Overcoming trastuzumab resistance in breast cancer by targeting dysregulated glucose metabolism, Cancer Res., 2011, 71, 4585–4597 CrossRef CAS PubMed.
- X. You, W. Jiang, W. Lu, H. Zhang, T. Yu, J. Tian, S. Wen, G. Garcia-Manero, P. Huang and Y. Hu, Metabolic reprogramming and redox adaptation in sorafenib-resistant leukemia cells: detected by untargeted metabolomics and stable isotope tracing analysis, Cancer Commun., 2019, 39, 17 CrossRef PubMed.
- L. M. Poisson, A. Munkarah, H. Madi, I. Datta, S. Hensley-Alford, C. Tebbe, T. Buekers, S. Giri and R. Rattan, A metabolomic approach to identifying platinum resistance in ovarian cancer, J. Ovarian Res., 2015, 8, 13 CrossRef PubMed.
- N. M. Anderson, P. Mucka, J. G. Kern and H. Feng, The emerging role and targetability of the TCA cycle in cancer metabolism, Protein Cell, 2018, 9, 216–237 CrossRef CAS PubMed.
- J. Q. Chen and J. Russo, Dysregulation of glucose transport, glycolysis, TCA cycle and glutaminolysis by oncogenes and tumor suppressors in cancer cells, Biochim. Biophys. Acta, 2012, 1826, 370–384 CAS.
- L. Chen, T. Liu, J. Zhou, Y. Wang, X. Wang, W. Di and S. Zhang, Citrate synthase expression affects tumor phenotype and drug resistance in human ovarian carcinoma, PLoS One, 2014, 9, e115708 CrossRef PubMed.
- B. Schlichtholz, J. Turyn, E. Goyke, M. Biernacki, K. Jaskiewicz, Z. Sledzinski and J. Swierczynski, Enhanced citrate synthase activity in human pancreatic cancer, Pancreas, 2005, 30, 99–104 CrossRef CAS PubMed.
- N. Zaidi, J. V. Swinnen and K. Smans, ATP-citrate lyase: a key player in cancer metabolism, Cancer Res., 2012, 72, 3709–3714 CrossRef CAS PubMed.
- Y. Zhou, L. R. Bollu, F. Tozzi, X. Ye, R. Bhattacharya, G. Gao, E. Dupre, L. Xia, J. Lu, F. Fan, S. Bellister, L. M. Ellis and Z. Weihua, ATP citrate lyase mediates resistance of colorectal cancer cells to SN38, Mol. Cancer Ther., 2013, 12, 2782–2791 CrossRef CAS PubMed.
- W. Liu, C. N. Hancock, J. W. Fischer, M. Harman and J. M. Phang, Proline biosynthesis augments tumor cell growth and aerobic glycolysis: involvement of pyridine nucleotides, Sci. Rep., 2015, 5, 17206 CrossRef CAS PubMed.
- I. Katsyv, M. Wang, W. M. Song, X. Zhou, Y. Zhao, S. Park, J. Zhu, B. Zhang and H. Y. Irie, EPRS is a critical regulator of cell proliferation and estrogen signaling in ER+ breast cancer, Oncotarget, 2016, 7, 69592–69605 CrossRef PubMed.
- T. Zeng, L. Zhu, M. Liao, W. Zhuo, S. Yang, W. Wu and D. Wang, Knockdown of PYCR1 inhibits cell proliferation and colony formation via cell cycle arrest and apoptosis in prostate cancer, Med. Oncol., 2017, 34, 27 CrossRef PubMed.
- K. Yan, X. Xu, T. Wu, J. Li, G. Cao, Y. Li and Z. Ji, Knockdown of PYCR1 inhibits proliferation, drug resistance and EMT in colorectal cancer cells by regulating STAT3-mediated p38 MAPK and NF-κB signalling pathway, Biochem. Biophys. Res. Commun., 2019, 520, 486–491 CrossRef CAS PubMed.
- J. Ding, M. L. Kuo, L. Su, L. Xue, F. Luh, H. Zhang, J. Wang, T. G. Lin, K. Zhang, P. Chu, S. Zheng, X. Liu and Y. Yen, Human mitochondrial pyrroline-5-carboxylate reductase 1 promotes invasiveness and impacts survival in breast cancers, Carcinogenesis, 2017, 38, 519–531 CrossRef CAS PubMed.
- Y. Tian, W. Du, S. Cao, Y. Wu, N. Dong, Y. Wang and Y. Xu, Systematic analyses of glutamine and glutamate metabolisms across different cancer types, Chin. J. Cancer, 2017, 36, 88 CrossRef PubMed.
- A. Fu and N. N. Danial, Grasping for aspartate in tumor metabolism, Nat. Cell Biol., 2018, 20, 738–739 CrossRef CAS PubMed.
- J. W. Locasale, Serine, glycine and one-carbon units: cancer metabolism in full circle, Nat. Rev. Cancer, 2013, 13, 572–583 CrossRef CAS PubMed.
- S. Okuno, H. Sato, K. Kuriyama-Matsumura, M. Tamba, H. Wang, S. Sohda, H. Hamada, H. Yoshikawa, T. Kondo and S. Bannai, Role of cystine transport in intracellular glutathione level and cisplatin resistance in human ovarian cancer cell lines, Br. J. Cancer, 2003, 88, 951–956 CrossRef CAS PubMed.
- N. Nikounezhad, M. Nakhjavani and F. H. Shirazi, Cellular glutathione level does not predict ovarian cancer cells resistance after initial or repeated exposure to cisplatin, J. Exp. Ther. Oncol., 2017, 12, 1–7 CAS.
- P. Bin, R. Huang and X. Zhou, Oxidation resistance of the sulfur amino acids: methionine and cysteine, BioMed Res. Int., 2017, 9584932 Search PubMed.
Footnotes |
| † Electronic supplementary information (ESI) available. See DOI: 10.1039/c9ra06607a |
| ‡ These authors have contributed equally to this work. |
|
| This journal is © The Royal Society of Chemistry 2019 |
Click here to see how this site uses Cookies. View our privacy policy here. 
 Open Access Article
 This Open Access Article is licensed under a Creative Commons Attribution-Non Commercial 3.0 Unported Licence
 ab,
Qiang Wang‡c and
Jinxia Chang*a
ab,
Qiang Wang‡c and
Jinxia Chang*a