
 Open Access Article
 This Open Access Article is licensed under a Creative Commons Attribution-Non Commercial 3.0 Unported Licence
Conductivity and giant permittivity study of Zn0.5Ni0.5Fe2O4 spinel ferrite as a function of frequency and temperature
Mohsen Elain
Hajlaoui
ab,
Radhia
Dhahri
a,
Nessrine
Hnainia
b,
Aida
Benchaabane
 cd,
Essebti
Dhahri
a and
Kamel
Khirouni
e
cd,
Essebti
Dhahri
a and
Kamel
Khirouni
e
aLaboratoire Physique Appliquée, Faculté des Sciences, Université de Sfax, B. P. 1171, Sfax 3000, Tunisia. E-mail: elain.hajlaoui@istmt.utm.tn
bLaboratoire des Nanomatériaux et de Systèmes pour les Energies Renouvelables Centre de Recherches et des Technologies de l’Energie, Technopole Borj Cedria, BP 095 Hammam Lif, Tunisia
cLaboratoire Matériaux Avancés et Phénomènes Quantiques, Faculté des Sciences de Tunis El Manar, Campus Universitaire, Université Tunis El-Manar, 2092 Tunis, Tunisia
dLaboratoire de Physique de la Matière Condensée, UFR des Sciences d’Amiens, 80039 Amiens, France
eLaboratoire de Physique des Matériaux et des Nanomatériaux Appliqués à l'Environnement, Faculté des Sciences, Université de Gabès, 6079 Gabès, Tunisia
First published on 10th October 2019
Abstract
Ni0.5Zn0.5Fe2O4 was prepared by the solid state reaction route at different temperatures. The dielectric properties of spinel ferrites were investigated in the frequency range 50 Hz–10 MHz and in the temperature range 300–420 K. Conductance is shown to increase with increasing frequency and temperature. Impedance analyses indicated that the relaxation phenomenon is strongly dependent on temperature and frequency. The impedance plots displayed both intra- and inter-granular contributions. Electrical equivalent circuit was proposed to explain the impedance results. The decrease of giant permittivity values with the increase in frequency proves the dispersion in the low frequency range and is showing the Maxwell–Wagner interfacial polarization.
Introduction
In recent years, spinel ferrite materials have attracted the interest of scientists, especially synthetic chemists1–3 because of their application in several disciplines such as biomedicine,4 catalysis,5 and magnetic resonance imaging.6 Among the diverse spinel ferrites Zn–Ni ferrites are found to be very attractive for the modern electronics industry due to high mechanical strength, good chemical stability, high magnetic permeability and resistivity.3,7,8 In order to prepare these ferrite nanomaterials, different methods have been reported, such as co-precipitation,9 sol–gel combustion,10 hydrothermal11 and ball milling methods.12 Moreover, spinel ferrites Ni0.5Zn0.5Fe2O4 are best known for their low dielectric loss, large permeability, high electric resistivity and unique magnetic structure.13 Due to these properties they are widely used in electronics devices such as magnetic heads, magnetic resonance imaging, filters,14 gas sensors,15–17 super capacitors and fuel cells.18,19 Hence it is challenging to prepare magnetic nanoparticles with bulk magnetic properties. Moreover, ferrite microstructures highly depend on the preparation process where annealing temperature affects magnetic and electric properties. In this context, many reports covered the structural and magnetic properties of Ni–Zn systems.20–23 The study of the electric properties, however, is still ongoing.This work aims to investigate the dielectric properties of Zn0.5Ni0.5Fe2 O4 ferrite system a wide frequency (50 Hz–10 MHz) and temperature (300–420 K) range by using X-ray diffraction and impedance spectroscopy. We deduce the transport mechanism involved in dc and ac conductance. Both conductance and activation energy values of our samples as a function of temperature and frequency are established.
Experimental
Nickel–zinc ferrites Ni0.5Zn0.5Fe2O4 were synthesized using solid-state reaction technique. Powder of the oxides NiO, ZnO and Fe3O4 with above 99.9% purity were mixed and pressed into pellets with 8 mm of diameter and 1.2 mm of thickness. Finally, the samples were sintered for 24 h at 1000 °C then heated at 1200 °C for 12 h to obtain the homogeneity of the compound.The homogeneity, the phase purity, lattice structure and cell parameters of the ferrites nanoparticles was checked by XRD technique using X-ray diffractometer (Siemens D5000 X-ray diffractometer) with monochromatized Cu-Kα radiation λCu = 1.5406 Å radiation.
In order to prepare the sample for electrical characterization, we have achieved to deposit, on each side of the pellet, an aluminum layer of 200 nm thickness using thermal heat evaporation under vacuum. To prevent solvent infiltration into the paint, a gold wire is attached to the aluminum layer by a silver paint. Electrical and dielectric data over large temperature range were recorded through an Agilent 4294A impedance analyzer, whose frequency scale is of 40 Hz–110 MHz. For completely excluding the effects of sun shine and other sources of lights, the measurements were conducted under dark.
Results and discussion
From X-ray diffractogramme, it is clear that the synthesized compound is single phase (Fig. 1). The Rietveld refinements of the XRD data performed using Fullprof program24 revealed that this compound crystallizes in the cubic structure with the Pm3m space group in which α = 8312 Å and V = 586.631 Å3. Fig. 2 show the structure of Ni0.5Zn0.5Fe2O4. The average particle size DSC was calculated using Scherrer's formula:25 | (1) |
 | (2) |
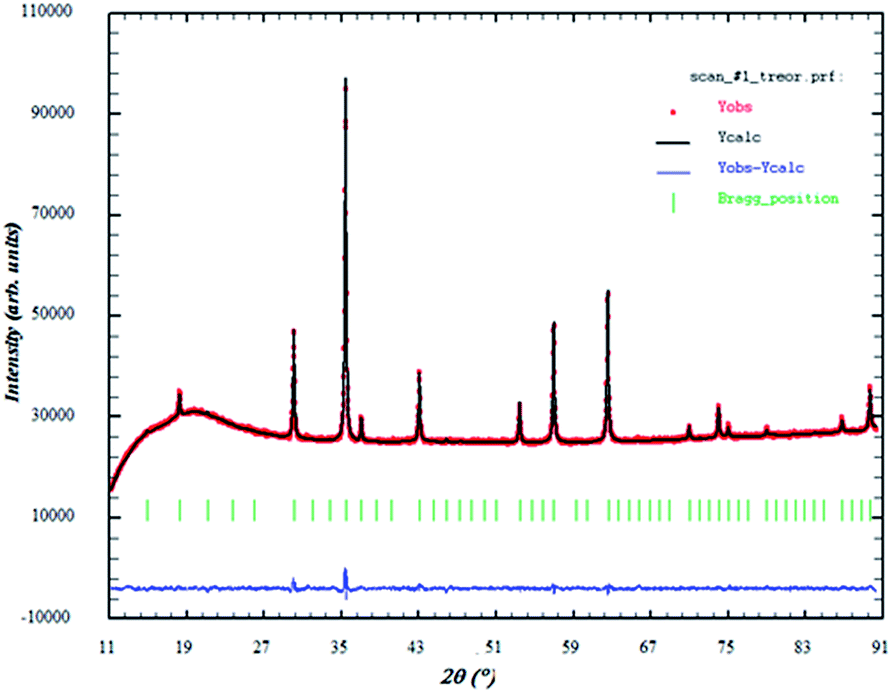 | ||
| Fig. 1 Observed (circle), calculated (continuous line) and difference patterns (at the bottom) of X-ray diffraction data for Ni0.5Zn0.5Fe2O4. | ||
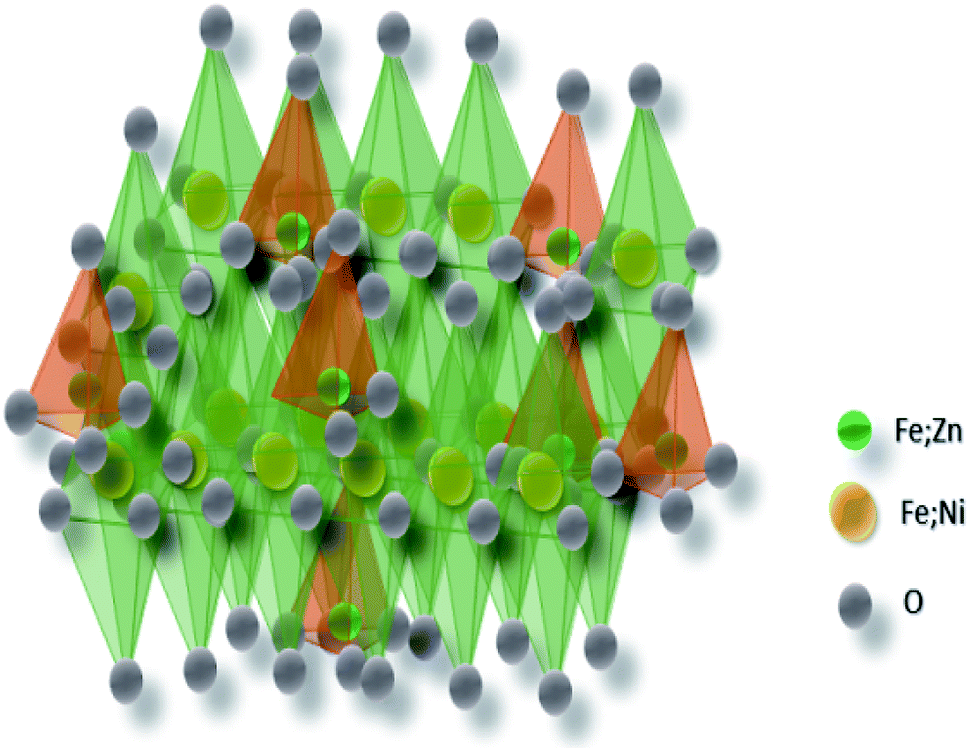 | ||
| Fig. 2 Representation of Ni0.5Zn0.5Fe2O4. The octahedral sites are shown in green and the tetrahedral sites are in orange. | ||
Fig. 3 exhibits the variation of conductance as a function of frequency at different temperatures. This physical entity is expressed by the following relation:
 | (3) |
| G(ω) = A(ω)s | (4) |
 | ||
| Fig. 3 Conductance as a function of frequency at different temperatures. | ||
Fig. 4 exhibits the variation of conductance with temperature. Shown in green and the tetrahedral sites are in orange.
 | ||
| Fig. 4 Variation of conductance as function of temperature at f = 83 Hz. | ||
It is well known that conduction in ferrites is led by the hopping of charge carriers between the sites.28
The mechanism can be defined by the following equation:29
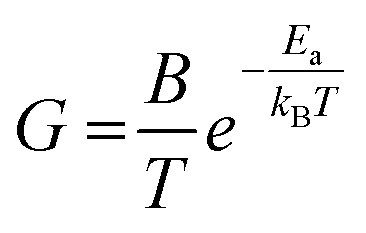 | (5) |
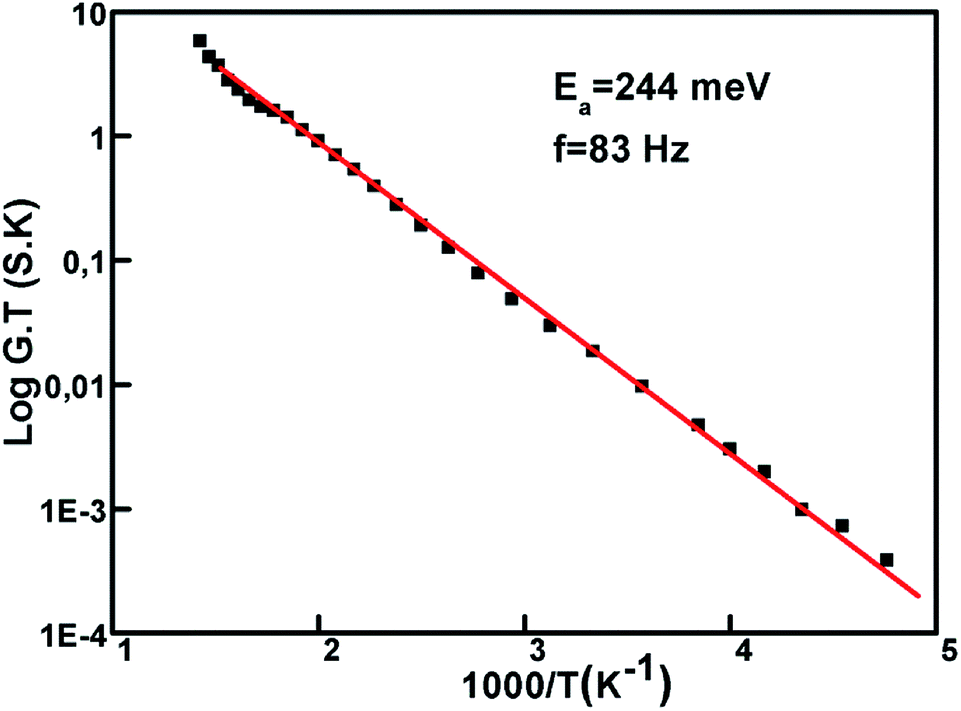 | ||
| Fig. 5 Variation of log(G.T) with 1000 T−1 for x = 50%. | ||
Fig. 6 presents the variation of Z′ as function of frequency and by varying temperature from 300 K to 420 K with a step of 20 K each time. We also notice the presence of two zones, the first one is limited from 5 × 10³ Hz and the second one beginning from 106. As we may see in the plot, for low temperatures and low frequencies the impedance values are elevated, and they decrease significantly for higher temperatures range. These values illustrate the temperature dependency behavior of conduction that directly affects the resistance. The alternating current resistance diminishes with the rising conduction at high temperatures. In fact, the remarkable change is attributed to the decrease of the potential barrier that creates free charge carriers. At high frequencies, we notice an acute decay of impedance that could be explained with the presence of a space-charge region resulting from the decline of charge barrier under the influence of temperature.30 It is known that grain boundaries are active interfaces for the creation of such region.31 Indeed, we can clearly observe constant values for Z′ at different temperatures for low frequencies suggesting an accumulation of charge carriers at the grain boundaries.32
 | ||
| Fig. 6 Variation of real impedance Z′ with frequency at different temperatures. | ||
The variation of frequency dependent Z′′ at varying temperature is shown in Fig. 7. We note that Z′′ decrease when temperature increase. The plot indicates the presence of two peaks, called relaxation frequencies. The first peak, located between 50 Hz and 103 Hz depending on the temperature, is attributed to the grain boundaries. Whereas the second one placed between 105 Hz and 107 Hz is attributed to the relaxation of the grain boundary. In fact, we can notice the shift towards higher frequencies as the temperature increases. This tendency indicates that charge carriers are thermally activated33 and are accumulated at the grain boundaries, and further confirms the semiconducting behavior of the nickel ferrites.
 | ||
| Fig. 7 Variation of imaginary impedance Z′′ with frequency at different temperatures. | ||
On the other side, the resistance is very low and keeps decreasing with the rising heat. Furthermore, for the frequency range around 106 we can clearly observe the merging of Z′′ regardless of temperature, which indicates the decrease of space charge polarization.34
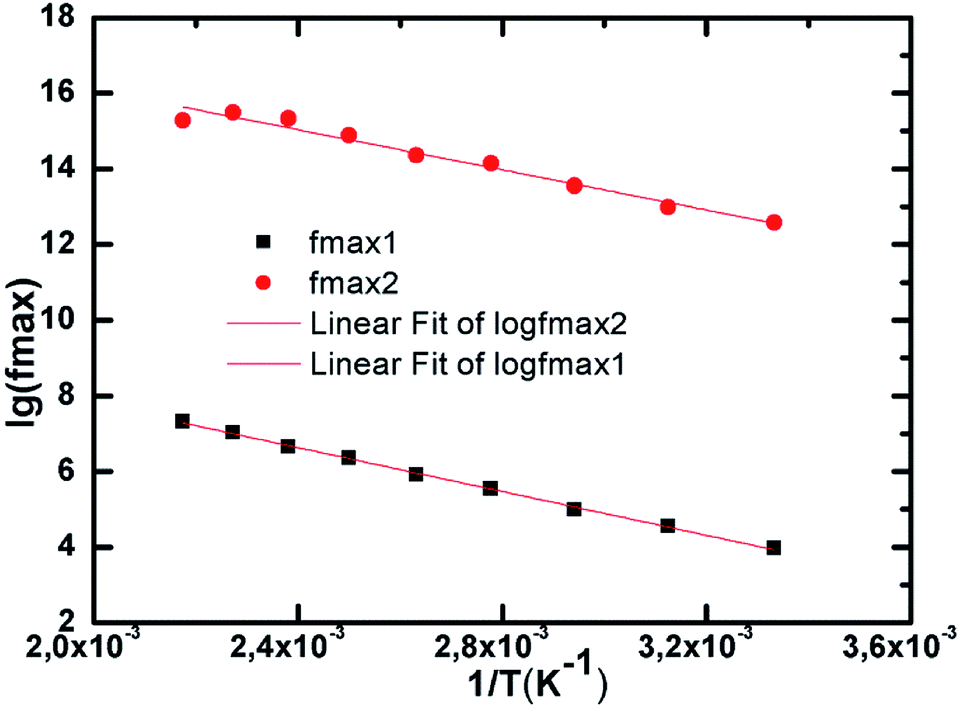
In order to determine the value of maximum frequency fmax for which the imaginary impedance has maximum value, we superposed both Z′ and Z′′. We observe the presence of two pics which correspond respectively to the two inflexion points for Z′ and two maximums for Z′′. The frequency fmax corresponds to the projection of the inflexion point on the frequency axis. For this case we have two inflexion points providing two maximums in agreement with the results discussed in the paragraph above.
Thus, from Fig. 8 we conclude the values of fmax = 92.6 Hz and fmax = 782.4 × 10⁵ Hz.
 | ||
| Fig. 8 Frequency dependence of real and imaginary parts of impedance Z′ and Z′′ at 320 K. | ||
The plot of normalized imaginary part of impedance  as a function of normalized frequency
  is exhibited in Fig. 9.
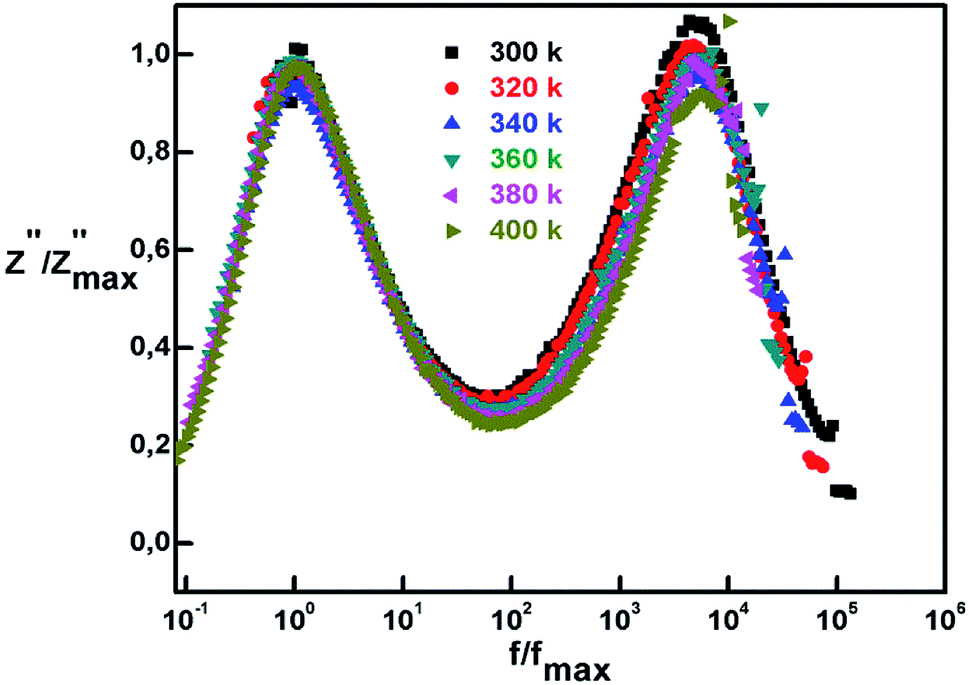 | ||
Fig. 9
 vs.
vs.
 plots of nickel ferrites at different temperatures. plots of nickel ferrites at different temperatures. | ||
The representation aims to enable the study of dielectric relaxation. We observe an overlap of spectra into a master curve which denotes that relaxation process is irrespective to temperature. In fact, the temperature independency indicates the existence of one relaxation mechanism35 for all spectra and the merging behavior could be explained by the emission of space charge.36 Moreover, the value of full width at half maximum is found to be > 1.14 decades indicating a polydisperse non-exponential relaxation. This non-Debye (non-exponential) relaxation type may refer to a hopping mechanism of charge carriers along with time dependent mobility of the same type of charge carriers.37 To ground deeper explanation to this phenomenon we refer to the following relation defining the non-Debye relaxation:38
 | (6) |
![[thin space (1/6-em)]](https://www.rsc.org/images/entities/char_2009.gif) f plot, we use the following relation:39
f plot, we use the following relation:39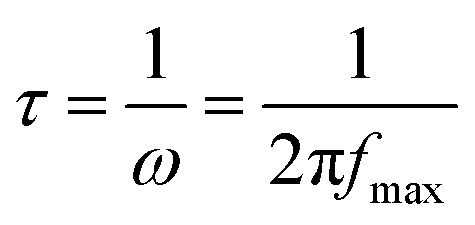 | (7) |
 | ||
| Fig. 10 Arrhenius plots for logarithmic representation of frequency as a function of 1/T. | ||
As discussed above we conclude that the relaxation frequency is increasing with temperature. The two slopes, attributed to the two frequencies observed in the impedance spectra, are used to determine the values of activation energies. Following the Arrhenius law:
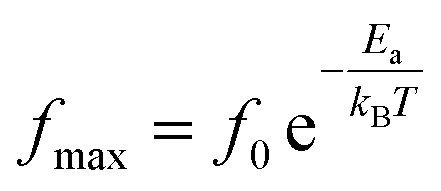 | (8) |
Fig. 11 exhibits the plots of imaginary part as a function of real part of complex impedance at various temperatures of Ni0.5Zn0.5Fe2O4. This technique aims to investigate the contribution of grains and grain boundaries based on the frequency range. The plots present two semicircular arcs that are not centered on the axis of real impedance Z′ indicating a non-Debye type of relaxation as previously concluded, and the obedience to Cole–Cole formalism.40 For complex impedance it is given by the following relation:
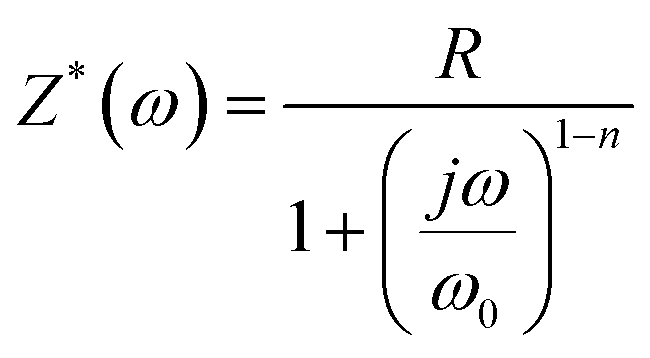 | (9) |
 | ||
| Fig. 11 Complex impedance spectrum for different temperatures. | ||
For when n → 0 it results in the classical Debye's formalism.
The decentralization could also explain the presence of only one electrical conduction mechanism.41 In fact, we can attribute the low frequency semicircle to the grain contribution, whereas the second semicircle is attributed to the grain boundaries contribution.
The formation of two semicircular arcs suggests the existence of two types of relaxation phenomena with the relaxation time given by τωmax = 1, where τ is the relaxation time and ωmax is the relaxation pulsation. As a matter of fact, these results correspond to the findings reported in the previous paragraphs.
On the other hand, we note that the interception of the plots shifts toward lower values of Z′ as the temperatures increases. There is a gradual decrease of resistance while the temperature is rising. This behavior indicates the low grain resistance for high temperatures, and the appearance of semicircles is indicative of semiconducting behavior.41
Using Z view software, we have simulated the plots of Z′′ vs. Z′. Fig. 12 is showing the simulation accompanied with the equivalent circuit used for the Ni0.5Zn0.5Fe2O4 sample. The model contains a series of three R-CPE combination circuits where R is the resistance, and CPE is the constant phase element referring to the complex element. The combinations are attributed to grains and grain boundaries. The constant phase element impedance is defined by the following equation:42
| ZCPE = [A(Jω)α]−1 | (10) |
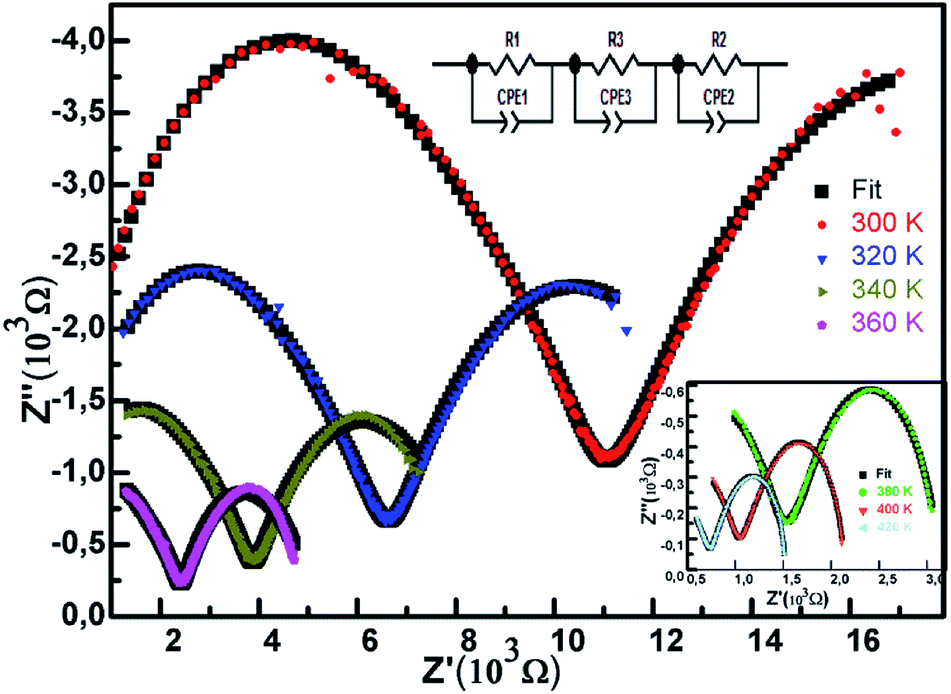 | ||
| Fig. 12 Nyquist diagram of Ni0.5Zn0.5Fe2O4 as a function of temperature. The inset showing the equivalent circuit. | ||
Using the relationship R = Z′/2 we calculated the resistance in order to further investigate the relaxation phenomena and the conduction distribution.
Table 1 presents the values of resistance R and constant phase element CPE for each series at different temperature.
| Temperature (K) | R1 (Ω) | CPE1T (F) | CPE1P (F) | R2 (Ω) | CPE2T (F) | CPE2P (F) | R3 (Ω) | CPE3T (F) | CPE3P (F) |
|---|---|---|---|---|---|---|---|---|---|
| 300 | 16161 |
312 × 10−6 | 0.59627 | 4382 | 11332 × 10−8 |
0.76477 | 6377 | 1320 × 10−10 | 0.95868 |
| 320 | 7412 | 1726 × 10−6 | 0.69692 | 2956 | 27092 × 10−8 |
0.70014 | 3695 | 1390 × 10−10 | 0.962 |
| 340 | 4088 | 14846 × 10−6 |
0.74431 | 1626 | 13597 × 10−7 |
0.61015 | 2406 | 1912 × 10−10 | 0.943 |
| 360 | 2259 | 10538 × 10−6 |
0.8178 | 778.7 | 32877 × 10−6 |
0.46832 | 1912 | 5821 × 10−10 | 0.86629 |
| 380 | 1189 | 76433 × 10−7 |
0.89876 | 529 | 11626 × 10−5 |
0.50459 | 1428 | 1607 × 10−9 | 0.79896 |
| 400 | 685.2 | 6138 × 10−7 | 0.95869 | 429.2 | 47528 × 10−6 |
0.646 | 1034 | 5586 × 10−9 | 0.72454 |
| 420 | 463.3 | 56788 × 10−7 |
0.98073 | 326.4 | 33432 × 10−6 |
0.696 | 738.6 | 10148 × 10−8 |
0.68974 |
This data was used to draw the curve given in Fig. 13 showing the variation of resistance as a function of temperature. We can notice a sharp decrease of resistance between 300 K and 340 K more pronounced for R1 than R2 and R3, thereafter it starts decreasing slowly. The temperature dependent behavior of resistance is attributed to the increase of charge mobility and thus conduction process. As the rate of resistance decreases differently in each plot, the rate of conductance is also increasing differently which indicates different activation energies as previously seen. In fact, following the Arrhenius relation we have:
 | (11) |
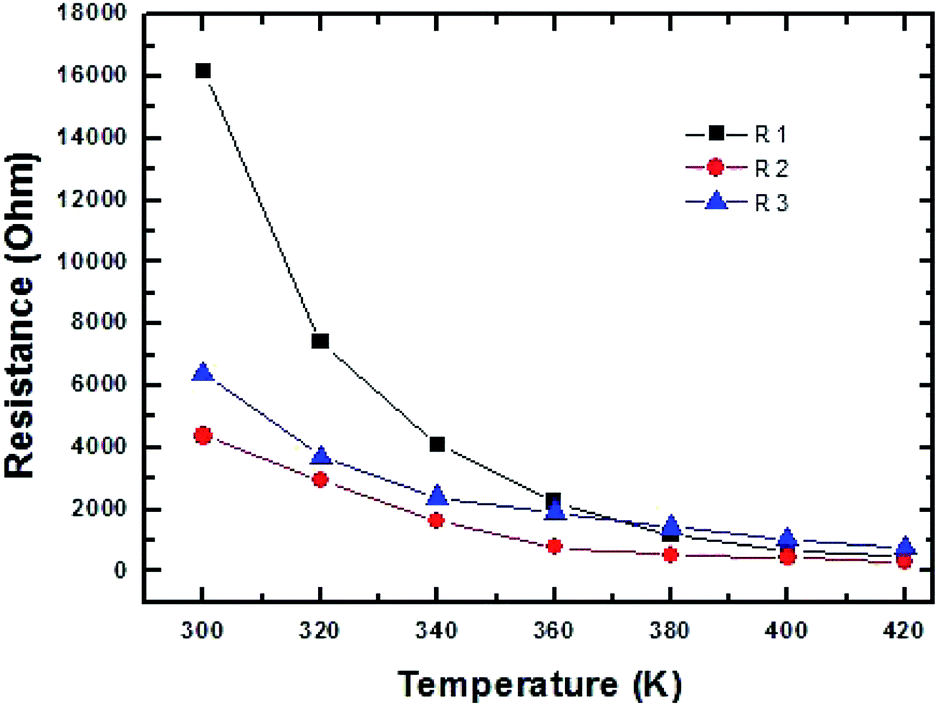 | ||
| Fig. 13 Temperature dependence of resistance. | ||
This law enables us to conclude two different activation energies in agreement with the results reported in the previous paragraphs.
Fig. 14 shows the variation of dielectric constant with frequency at various temperature ranging from 300 K to 400 K. As a matter of fact, we notice a giant permittivity of the order 106. In fact, the behavior of the permittivity could be divided according to the frequency. For low frequencies (<103 Hz) the real part of dielectric constant increases with temperature which indicates the thermal activation of the charge carriers and thus affects the polarization. In order to explain this trend, we resort to Maxwell–Wagner double layer model designed for inhomogeneous structures.7,41
 | ||
| Fig. 14 Evolution of real part of dielectric permittivity (ε′) as a function of frequency. | ||
We assume that the material is composed of two layers where the grains possess high conductance and grain boundaries have poor conductance. At lower frequencies the grain boundaries possess high resistance, so the electrons gather and generate polarization at the boundaries which explains the dielectric behavior of the material in the low frequency area. Thereafter we notice a rapid decrease of the dielectric constant independent of temperature. This could be attributed to the reverse electron motion as the frequency increase,7 resulting in reduction of polarization. We conclude that space-charge polarization is prominent in the first region. The variation of imaginary permittivity is presented in Fig. 15 as a function of frequency and at different temperatures.
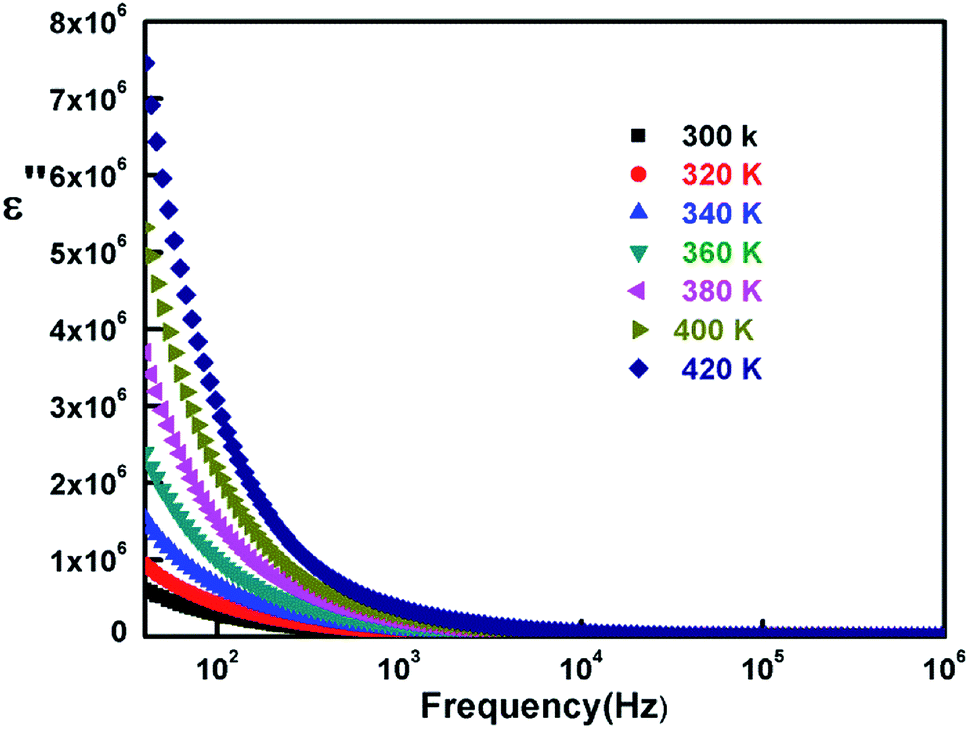 | ||
| Fig. 15 Variation of imaginary part of dielectric constant with frequency at different temperatures. | ||
The plots clearly show curves decreasing as the frequency rises. For the low frequency region, high dielectric constant values are ascribed to the highest temperatures and they diminish with it. As the frequency continues to rise, the dielectric constant also continues to lessen. Fig. 16 exhibits the frequency dependency of the dielectric tangent (tanδ) with varying temperature values. The plots show high loss for low frequency depending on temperatures, and then sharply decreases to a merging point between 102 Hz and 103 Hz.
 | ||
| Fig. 16 Variation of dielectric loss tangent as a function of frequency at various temperatures. | ||
The elevated resistance of grain boundaries at low frequencies results in electrons requiring high energy which justifies according to Koop's theory the high values of dielectric loss at that region.43 In the following frequency region, up to 104 Hz the variation is reversed. We notice a light increase of dielectric loss that is more pronounced for lower temperatures reaching again a merging point. This behavior could be explained by the piling up of the electrons at the grain boundaries after reaching the area through hopping mechanism. The last region is defined by a similar behavior to that of the first one. There is a reduction of dielectric loss for the higher frequencies, and continues to gradually decrease tending towards zero irrespective to temperature. This coalescence is due to the poor energy loss during the exchange of electrons.
Conclusions
Zn0.5Ni0.5FeO4 spinel ferrite is synthesized using the solid-state reaction technique. X-Ray diffractogramme reveals that our sample is pure and crystallizes in the orthorhombic system with Pbnm space group. The dielectric study is performed by complex impedance spectroscopy in a wide range of temperature [300–420 K] and frequency [40–107 Hz]. The relaxation frequency values are determined from impedance spectroscopy, which are thermally activated.The evolution of ac conductance as a function of temperature and frequency is found to follow Maxwell–Wegner two-layer model.
Complex impedance plots have revealed the presence of tow semicircular arcs (grain and boundary grain). This behavior was modeled by an electrical equivalent circuit composed of three series sets of resistance and capacitance in parallel. Nyquist plots show two semicircles, revealing the presence of two relaxations processes in our material associated with grains and grain boundaries. Moreover, the real and imaginary part of dielectric constant were studied as a function both of temperature and frequency. The decrease of giant permittivity values with the increase in frequency proves the dispersion in low frequency range and is showing the Maxwell–Wagner interfacial polarization.
We note a light increase of dielectric loss. This behavior could be explained by the piling up of the electrons at the grain boundaries after reaching the area through hopping mechanism.
Conflicts of interest
There are no conflicts to declare.References
- M. K. Shobanaa, K. Kim and J. H. Kim, Impact of magnesium substitution in nickel ferrites: optical and electrochemical studies, Phys. E, 2019, 108, 100–104 CrossRef.
- M. Amiri, K. Eskandari and M. Salavati-Niasari, Magnetically retrievable ferrite nanoparticles in the catalysis application, Adv. Colloid Interface Sci., 2019, 271, 101982 CrossRef CAS.
- V. Uskokovic, M. Drofenik and I. Ban, The characterization of nanosized nickel–zinc ferrites synthesized within reverse micelles of CTAB/1–hexanol/water microemulsion, J. Magn. Magn. Mater., 2004, 284, 294–302 CrossRef CAS.
- Y. P. He, S. Q. Wang, C. R. Li, Y. M. Miao, Z. Y. Wu and B. S. Zou, Synthesis and characterization of functionalized silica-coated Fe3O4 superparamagnetic nanocrystals for biological applications, J. Phys. D: Appl. Phys., 2005, 38, 1342–1350 CrossRef CAS.
- Y. Ma, J. Fu, Z. Gao, L. Zhang, C. Li and T. Wang, Dicyclopentadiene Hydroformylation to Value-Added Fine Chemicals over Magnetically Separable Fe3O4-Supported Co–Rh Bimetallic Catalysts: Effects of Cobalt Loading, Catalysts, 2017, 7, 103 CrossRef.
- S. Mornet, S. Vasseur, F. Grasset, P. Veverka, G. Goglio, A. Demourgues, J. Portier, E. Pollert and E. Duguet, Magnetic nanoparticle design for medical applications, Prog. Solid State Chem., 2006, 34, 237–247 CrossRef CAS.
- M. Atif and M. Nadeem, Sol–gel synthesis of nanocrystalline Zn1−xNixFe2O4 ceramics and its structural, magnetic and dielectric properties, J. Sol-Gel Sci. Technol., 2014, 72, 615–626 CrossRef CAS.
- S. Deka and P. A. Joy, Enhanced permeability and dielectric constant of Ni–Zn ferrite synthesized in nanocrystalline form by a combustion method, J. Am. Ceram. Soc., 2007, 90, 1494–1499 CrossRef CAS.
- M. U. Islam, T. Abbas, S. B. Niazi, Z. Ahmad, S. Sabeen and M. A. Chaudhry, Electrical behavior of fine particle, co-precipitation prepared Ni–Zn ferrites, Solid State Commun., 2004, 130, 353–356 CrossRef CAS.
- R. V. Mangalraja, S. Ananthakumar, P. Manohar and F. D. Gnanam, Dielectric behavior of Ni1−xZnxFe2O4 prepared by flash combustion technique, Mater. Lett., 2003, 57, 1151–1155 CrossRef.
- C. Upadhyay, D. Mishra, H. C. Verma, S. Anand and R. P. Das, Effect of preparation conditions on formation of nanophase Ni–Zn ferrites through hydrothermal technique, J. Magn. Magn. Mater., 2003, 260, 188–194 CrossRef CAS.
- N. M. Deraz and O. H. Abd-Elkader, Production and characterization of nano-magnetic Ni0.5Zn0.5Fe2O4 spinel solid solution, J. Anal. Appl. Pyrolysis, 2014, 106, 171–176 CrossRef CAS.
- P. Sivakumar, R. Ramech, A. Ramanand, S. Ponnysamy and C. Muthamizhchelvan, Synthesis and characterization of NiFe2O4 nanoparticles and nanorods, J. Alloys Compd., 2013, 563, 6–11 CrossRef CAS.
- A. C. F. M. Costa, A. P. A. Diniz, A. G. B. de Melo, R. H. G. A. Kiminami, D. R. Cornejo, A. A. Costa and L. Gama, Ni–Zn–Sm nanopowder ferrites: Morphological aspects and magnetic properties, J. Magn. Magn. Mater., 2008, 320, 742–749 CrossRef CAS.
- K. Wu, J. Li and C. Zhang, Zinc ferrite based gas sensors : A review, Ceram. Int., 2019, 45, 11143–11157 CrossRef CAS.
- V. D. Kapse, S. A. Ghosh, F. C. Raghuwanshi and S. D. Kapse, Nanocrystalline spinel Ni0.6Zn0.4Fe2O4: A novel material for H2S sensing, Mater. Chem. Phys., 2009, 113, 638–644 CrossRef CAS.
- V. G. Harris, Modern microwave ferrites, IEEE Trans. Magn., 2012, 84, 1075–1104 Search PubMed.
- J. S. Hardy, C. A. Coyle, J. F. Bonnett, J. W. Templeton, N. L. Canfield, D. J. Edwards, S. M. Mahserejian, L. Ge, B. J. Ingram and J. W. Stevenson, Evaluation of cation migration in lanthanum strontium cobalt ferrite solid oxide fuel cell cathodes via in-operando X-ray diffraction, J. Mater. Chem. A, 2018, 6, 1787–1801 RSC.
- R. Rani, G. Kumar, K. M. Batoo and M. Singh, Electric and Dielectric Study of Zinc Substituted Cobalt Nanoferrites Prepared by Solution Combustion Method, Am. J. Nanomater., 2013, 1, 9–12 Search PubMed.
- H. Parmar, R. V. Upadhyay, S. Rayaprol and V. Siruguri, Structural and magnetic properties of nickel–zinc ferrite nanocrystalline magnetic particles prepared by microwave combustion method, Indian J. Phys., 2014, 88, 1257–1264 CrossRef CAS.
- P. P. Hankare, U. Sankpal, R. Patil, I. Mulla, R. Sasikala, A. Tripathi and K. Garadkar, Synthesis and characterization of nanocrystalline zinc substituted nickel ferrites, J. Alloys Compd., 2010, 496, 256–260 CrossRef CAS.
- N. Gupta, A. Verma, S. C. Kashyap and D. C. Dube, Dielectric behavior of spin deposited nanocrystalline nickel–zinc ferrite thin films processed by citrate-route, Solid State Commun., 2005, 134, 689–694 CrossRef CAS.
- H. Rahmouni, A. Benali, B. Cherif, E. Dhahri, M. Boukhobza, K. Khirouni and M. Sajieddine, Structural and electrical properties of Zn1-xNixFe2O4 ferrite, Phys. B, 2015, 31–37 CrossRef CAS.
- H. M. Rietveld, A profile refinement method for nuclear and magnetic structures, J. Appl. Crystallogr., 1965, 2, 65–71 CrossRef.
- Théorie et Technique de la radiocristallographie, ed. A. Guinier and X. Dunod, 3rd edn, 1964, p. 462 Search PubMed.
- J. Sharma, J. Parashar, V. K. Saxena, D. Bhatnagar and K. B. Sharma, Study of dielectric properties of nanocrystalline cobalt ferrite up to microwave frequencies, Macromol. Symp., 2015, 357, 38–42 CrossRef CAS.
- S. Mollah, K. K. Som, K. Bose and B. K. Chaudri, J. Appl. Phys., 1993, 74, 931 CrossRef CAS.
- S. A. Mazen and A. M. El Taher, The conduction mechanism of Cu–Ge ferrite, Solid State Commun., 2010, 150, 1719–1724 CrossRef CAS.
- N. F. Mott and E. A. Davis, Electronic processes in non-crystalline materials, Clarendon Press/Oxford University press, 2nd edn, 1979 Search PubMed.
- S. A. Mazen and A. M. El Taher, The conduction mechanism of Cu–Si ferrite, J. Alloys Compd., 2010, 498, 19–25 CrossRef CAS.
- B. Kumar, Ceramic nanocomposites for energy storage and power generation, Ceramic Nanocomposites, 2013, 509–529 CAS.
- L. S. Lobo and A. B. Kumar, Structural and electrical properties of ZnCo2O4 spinel synthesized by sol–gel combustion method, J. Non- Cryst. Solids, 2019, 505, 301–309 CrossRef CAS.
- F. Borsa, D. R. Torgeson, S. W. Martin and H. K. Patel, Relaxation and fluctuations in glassy-fast-ion conductors : Wide-frequency-range NMR and conductivity measurements, Phys. Rev. B: Condens. Matter Mater. Phys., 1992, 46, 795 CrossRef CAS.
- E. V. Ramana, S. V. Suryanarayana and T. B. Sankaram, Ac impedance studies of ferro electromagnetic SrBi5−xLaxTi4FeO18 ceramics, Mater. Res. Bull., 2006, 41, 1077–1088 CrossRef CAS.
- A. Omri, M. Bejar, E. Dhahri, M. Es-Souni, M. A. Valente, M. P. F. Graça and L. C. Costa, Electrical conductivity and dielectric analysis of La0.75(Ca,Sr)0.25Mn0.85Ga0.15O3 perovskite compound, J. Alloys Compd., 2012, 536, 173–178 CrossRef CAS.
- M. A. Valente, Opt. Mater., 2001, 33, 1964 CrossRef.
- N. V. Prasad, C. S. Manda and G. S. Kumar, Impedance spectroscopic studies on lead based perovskite materials, Ferroelectrics, 2008, 366, 55–66 CrossRef CAS.
- S. Lily, K. Kumari, K. Prasad and R. N. P. Choudhary, Impedance spectroscopy of (Na0.5Bi0.5)(Zr0.25Ti0.75)O3 lead-free ceramic, J. Alloys Compd., 2008, 453, 325–331 CrossRef.
- K. Ashok, M. B. Suresh and P. Sarah, Electrical properties of Li and Nd doped SrBi4Ti4O15 ceramics, Int. J. Pure Appl. Res. Eng. Technol., 2013, 2, 3299–3307 Search PubMed.
- K. S. Cole and R. H. Cole, Dispersion and Absorption in Dielectrics I. Alternating Current Characteristics, J. Chem. Phys., 1941, 9, 341 CrossRef CAS.
- L. S. Lobo and A. B. Kumar, Structural and electrical properties of ZnCo2O4 spinel synthesized by sol-gel combustion method, J. Non-Cryst. Solids, 2019, 505, 301–309 CrossRef CAS.
- E. Barsoukov and J. R. Macdonald, Impedance Spectroscopy theory, Experiment and Applications, 2nd edn, 2005, p. 18 Search PubMed.
- A. K. Roy, K. Prasad and A. Prasad, Piezoelectric, impedance, electric modulus and Ac conductivity studies on (Bi0.5Na0.5)0.95Ba0.05TiO3 ceramic, Process. Appl. Ceram., 2013, 7, 81–91 CrossRef CAS.
| This journal is © The Royal Society of Chemistry 2019 |