
 Open Access Article
 This Open Access Article is licensed under a Creative Commons Attribution-Non Commercial 3.0 Unported Licence
In situ preparation and determination of electrochemical and electrochromic properties of copper phthalocyanine-polyaniline nanocomposite films†
Mi Ouyanga,
Xuming Hua,
Xiongchao Shaoa,
Lu Chena,
Weijun Li a,
Ru Bai*b,
Ling Zhanga,
Xiaojing Lva,
Alexey Tameevc and
Cheng Zhang*a
a,
Ru Bai*b,
Ling Zhanga,
Xiaojing Lva,
Alexey Tameevc and
Cheng Zhang*a
aInternational Sci. & Tech. Cooperation Base of Energy Material and Application, College of Chemical Engineering, Zhejiang University of Technology, Hangzhou 310014, P. R. China. E-mail: czhang@zjut.edu.cn
bCenter for Integrated Spintronics, Hangzhou Dianzi University, Hangzhou 310018, P. R. China. E-mail: bairu@hdu.edu.cn
cThe Laboratory for Electronic and Photonic Processes in Polymer Nanocomposites, A. N. Frumkin Institute of Physical Chemistry and Electrochemistry of the Russian Academy of Sciences, Moscow 119071, Russia
First published on 25th October 2019
Abstract
Copper phthalocyanine (CuPc) films with different morphologies were electrodeposited on the surfaces of ITO electrodes. Then, in each case, a polyaniline (PANI) film was electrochemically polymerized in situ on the surface of the copper phthalocyanine film to form a CuPc-PANI composite film. The electrochemical properties of the CuPc-PANI composite film were observed to be much better than those of the film without CuPc. With the modification involving the CuPc nanowires, the composite film formed a finer particle surface and an increased interface area between the PANI and the electrolyte. Compared to the single-component PANI film, the CuPc-PANI composite film exhibited better performance with a higher optical contrast (58% at 730 nm), a faster response speed (coloring time of 1.02 s, discoloring time of 1.96 s), and better cycling stability (68.71% of the initial electrochemical activity after 500 cycles, in contrast to only about 48.02% for PANI). Moreover, the CuPc-PANI film shows a new feature that can be used as a supercapacitor (specifically a capacitance value of about 5.4 mF cm−2 at typical currents). Our results demonstrate that the prepared CuPc-PANI composite film is one of the best candidates for multiple potential applications such as high-performance polymer electrochromic materials and supercapacitors.
1. Introduction
Polymer electrochromic (PEC) materials are considered to be the most promising next-generation electrochromic (EC) materials1–5 due to their advantages such as easy tailoring of their molecular structure, adjustable energy band, wide range of color change, high optical contrast, fast response, low energy consumption and good processing performance. However, in order to be used in the field of flat displays, a PEC material must meet the requirements of multi-color and even full-color displays, including high cycling stability, fast response speed, etc. At present, the multi-color display properties of PEC materials are mainly achieved through the design and modification of molecular structures,2,6–8 such as donor–acceptor (D–A) structure design,9,10 introduction of functional groups, and copolymerization of different monomers.11–13 The construction of a cross-linked structural polymer14,15 or the combination of a polymer and inorganic material16–18 can significantly improve the cycling stability and color change response speed of the PEC materials.Using organic–inorganic composites has been widely reported to improve the properties of PEC materials.19 For example, compared to a PTBTPA film, a PTBTPA/ZnO composite film was reported by Lv et al.20 to exhibit a faster switching time and much higher electrochemical stability. Xia et al.21 explored TiO2/PANI core/shell nanorod array heterostructures as electrochromic materials, and showed them to display four color modes and fast optical switching speeds. Kateb et al.22 prepared a ZnO/PEDOT core/shell nanorod array film as an electrochromic electrode; the film showed high contrast, fast switching rate and high coloration efficiency. Despite the remarkable results of these efforts, there are still some problems to be solved, such as interface problems (caused by the difference between polymers and inorganic materials) and the selection of the nanomaterial. The properties of materials can be effectively improved by using nanocomposites, but usually inorganic materials are needed to construct nanostructures, which leads to the interface problem of organic–inorganic materials. In contrast, polymer–organic composites can reduce the interface problem and improve the properties of composites to some extent.23 However, there have been relatively few reports on polymer–organic composites.
Polyaniline (PANI) and its derivatives constitute a class of typical polymer electrochromic materials. PEC materials with this type of configuration have been widely reported.24–26 Although the aniline structure does not necessarily lead to excellent electrochromic properties, the conclusions that come from such versatile structures are more universal and persuasive. Copper phthalocyanine (CuPc) is a class of classical organic photoconductive materials whose electrical conductivity levels differ significantly between light and dark states.27,28 It has been reported that CuPc has been nanocomposited with titanium dioxide to improve its photoconductivity by orders of magnitude.29,30
Based on the above considerations, we set out in the work described in this paper to electrodeposit a nano-CuPc film on the surface of an ITO electrode, and in situ composite a polyaniline film by carrying out electrochemical polymerization to obtain a CuPc-PANI nanocomposite film. Such formation of the CuPc-PANI nanocomposite was expected to increase the contact interface between polyaniline and the electrode. The introduction of CuPc was expected to improve the interfacial compatibility and electrical conductivity of the composites so as to further enhance the electrochemical properties of the material.
2. Experimental
2.1 Preparation of CuPc nanowires, PANI films and CuPc-PANI composites films
All solvents and chemicals were of analytical grade and used without further purification. Copper phthalocyanine (CuPc, >90%) and trifluoroacetic acid (TFA, >99.5%) were purchased from Aladdin. The analytical reagents dichloromethane and chloroform were provided by Shanghai Lingfeng Chemical Reagent Co., Ltd. Toluene and acetone were obtained from Hangzhou Shuanglin Chemical Reagent Co., Ltd. Ethanol (≥99.7%) was provided by Shanghai Titan Scientific Co., Ltd. Sulfuric acid (H2SO4, 95%–98%) and sodium hydroxide were purchased from Xilong Chemical Co., Ltd. Aniline (ANI, ≥99.5%) was obtained from J & K. Transparent indium tin oxide (ITO) glasses (dimensions of 0.9 cm × 4 cm and sheet resistance Rs ≤ 10 Ω) were purchased from Guluo Glass Technology Co., Ltd and then ultrasonically washed in distilled water, ethanol, toluene and acetone solutions, respectively.CuPc nanowires were prepared on the ITO substrates by following a previously reported electrodeposition method.29 Copper phthalocyanine at a concentration of 2 × 10⁻⁵ M was combined with 40 mL of chloroform, and then with 1.5 mL of TFA. A conductive ITO substrate was used as a cathode, and a platinum (Pt) plate was used as an anode. In the copper phthalocyanine solution, electrophoretic deposition was performed at −8 V, and the deposition amount was −0.002 C. The electrodeposited material was rinsed with methylene chloride and then dried in an oven at 60 °C for 2 h and the resulting electrode was labelled as a CuPc electrode.
A PANI thin layer was deposited on the ITO substrate by following the electropolymerization method. The monomer solution was a mixed aqueous solution containing 25 mM aniline and 50 mM sulfuric acid. The electropolymerization was carried out in a three-electrode cell on an ITO substrate as the working electrode, Ag/AgCl as the reference electrode, and Pt sheet as the counter electrode. The PANI film was deposited by carrying out bulk electrolysis (BE) with coulometry at a constant potential of 0.8 V with an electropolymerization charge of 0.06 C. (The thickness of the deposited PANI film was about 150 nm.) After electropolymerization, the samples were washed with deionized water and dried in air. And then, the CuPc-PANI film with the above CuPc nanowires on the ITO substrate was deposited by carrying out BE with coulometry at a constant potential of 0.8 V with an electropolymerization charge of 0.06 C. (The thickness of the deposited CuPc-PANI film was about 200 nm.)
2.2 Characterization
The crystal structures and morphologies of the as-prepared samples were characterized by using an X'Pert Pro X-ray diffractometer (XRD) equipped with a Cu-Kα radiation source (λ = 1.5418 Å), an S-4800 scanning electron microscope (SEM), and a Hitachi HT7700 transmission electron microscope (TEM). Fourier-transform infrared reflection (FTIR) spectra were acquired using a Nicolet 6700 spectrometer (Thermo Fisher Nicolet, USA). The thicknesses of the composite and polymer films were determined by using a DEKTAK-XK step profiler. Cyclic voltammetry (CV), galvanostatic charge/discharge and electrochemical impedance spectroscopy (EIS) were carried out using a CHI660E electrochemical workstation in a three-electrode system containing an aqueous solution of 1 M H2SO4 as the electrolyte, Ag/AgCl as the reference electrode, and a Pt sheet as the counter electrode. Ultraviolet-visible (UV-Vis) absorption spectra were recorded using a UV-1800 UV-Vis spectrometer.3. Results and discussion
FTIR spectra of CuPc, pure PANI, and the CuPc-PANI composite are shown in Fig. 1. Here, it can be seen that CuPc shows intense absorption bands at 1612, 1508, 1467, 1422, 1336 and 1289 cm−1, which are derived from the stretching vibration of the planar C–C or C–N bonds of the phthalocyanine macrocycle. It also yielded bands at around 1167, 1123 and 1094 cm−1, corresponding to the in-plane bending vibration of the benzene ring C–H bonds, and bands at 755 and 725 cm−1, attributed to the out-of-plane bending vibration of the benzene ring C–H bonds. And the characteristic band at 901 cm−1 caused by the vibration of copper ions and nitrogen atoms on the surrounding four pyrrole rings was also observed; this band is one of the most important features for identifying CuPc.31 The presence of these characteristic bands indicates the successful preparation of the CuPc film. The FTIR spectrum of the PANI film is also shown in Fig. 1. Here, the PANI film shows absorption bands at around 1584 and 1487 cm−1, corresponding to the characteristic absorption of the anthracene and benzene rings in the PANI molecular chain. It also yielded a band at 1312 cm−1 from the C–N stretching vibration of phenylhydrazine, at around 1141 cm−1 from C–N in the benzene ring, and at 829 cm−1 due to the C–C bending vibration in the benzene ring.24 Fig. 1 also shows the spectrum of CuPc-PANI. This nanocomposite film yielded most of the characteristic bands of PANI and CuPc. For instance, the bands observed at 1484 and 1567 cm−1 are characteristic of the anthracene and benzene rings in the PANI, that at 1307 cm−1 is due to the C–N vibration of the PANI, those at 1123 and 1093 cm−1 come from the in-plane bending vibration of the C–H bond of the aromatic ring structure of CuPc, that at 1684 cm−1 is caused by the stretching vibrations of C![[double bond, length as m-dash]](https://www.rsc.org/images/entities/char_e001.gif) N and CO in the molecular structure of CuPc, and that at 885 cm−1 is caused by the vibration of the copper and nitrogen atoms in the pyrrole ring. The similarity of the three curves indicates that the PANI film was successfully prepared on the CuPc-coated ITO substrate.
N and CO in the molecular structure of CuPc, and that at 885 cm−1 is caused by the vibration of the copper and nitrogen atoms in the pyrrole ring. The similarity of the three curves indicates that the PANI film was successfully prepared on the CuPc-coated ITO substrate.
 | ||
| Fig. 1 FTIR spectra of the CuPc film, PANI film, and CuPc-PANI composite film. | ||
The XRD patterns of the CuPc, PANI and CuPc-PANI composite films, each on a conductive ITO substrate, are shown in Fig. 2. After eliminating the intrinsic diffraction peaks of ITO, a sharp diffraction peak appeared at 2θ = 6.74° and the corresponding interplanar spacing was measured to be 13.1 Å. The intrinsic diffraction peak at 2θ = 6.64° confirms that the deposited CuPc film is an α-type crystal. The XRD pattern of the CuPc-PANI/ITO composite film is similar to that of the CuPc/ITO film, with this similarity due to the amorphous nature of the PANI film. But the composite film shows new diffraction peaks at 2θ = 18.84° and 23.02°. These two peaks derived from the β-CuPc crystal form,32 and their appearance suggests to us that a small amount of α-CuPc crystals was converted into β-CuPc crystals due to a solvation effect, and in this way mixed crystals of CuPc were finally obtained.
 | ||
| Fig. 2 XRD patterns of ITO glass, CuPc/ITO, PANI/ITO and CuPc-PANI/ITO. | ||
The surface morphologies of the CuPc, PANI and CuPc-PANI films were investigated by carrying out SEM and TEM analyses, as shown in Fig. 3. The ITO substrates prepared with CuPc and PANI are observed to be covered with a layer of CuPc nanowires (Fig. 3a and c) and a layer of PANI nanoparticles (Fig. S1†), respectively. The CuPc nanowires show lengths of 1–2 μm and diameters of about 20–100 nm. Moreover, the morphology and distribution of the CuPc nanowires are observed to be dendritic. Smaller, shorter nanowires appear to have gradually coalesced to form thicker, longer micron-sized lines. The average diameters of the PANI nanoparticles range from 20 to 60 nm. Fig. 3b and d show a layer of PANI nanoparticles grown on a CuPc substrate. Inspection of these images indicates that the PANI particles remained evenly distributed after being compounded with CuPc. The outline of the CuPc nanowires under the PANI membrane can be roughly seen from the surface of the composite film.
 | ||
| Fig. 3 (a–d) SEM images of (a and c) CuPc and (b and d) the CuPc-PANI composite film at various magnifications. (e and f) TEM images of (e) CuPc and (f) the CuPc-PANI composite film. | ||
This observation demonstrates that the CuPc-PANI composite film was formed in situ. TEM was also used to analyze the structural characteristics of the CuPc nanowires and CuPc-PANI composite film. Here, as shown in Fig. 3e, the thin CuPc nanowires are observed to be aggregated together, and their morphologies and dimensions are consistent with the results of the corresponding SEM images. After electrochemical polymerization of PANI, the presence of CuPc nanowires in CuPc-PANI composites was also observed, as shown in the TEM image (Fig. 3f) of a small piece of thin film peeling off during the ultrasonic preparation of the composite sample. Several nanowires can be clearly seen jutting out from the thin film. The morphology and dimensions of these nanowires are consistent with the morphology and dimensions of the CuPc nanowires. This observation also confirms the successful preparation of the CuPc-PANI composite film.
Fig. 4 shows the UV-Visible absorption spectra of the PANI and CuPc-PANI composite films acquired under various applied voltages ranging from −0.2 to 0.7 V. As the applied voltage was increased from −0.2 to 0.2 V, the absorption peak at 410 nm increased, but then decreased as the voltage was further increased from 0.2 to 0.7 V. This result can be explained by the formation of a bipolar species at higher voltage, which has been shown to lead to a reduction in the population of polarons.24 In the −0.2 to 0.7 V range, the characteristic absorbance band close to 730 nm and related to the π–π* transition in the quinoid ring of PANI can be observed. At low voltages (−0.2 to 0 V), an absorption band was also be observed at about 860 nm, which made the PANI film appear pale yellow and the CuPc-PANI composite film pale blue (related to the light blue appearance of the CuPc film) when the PANI and CuPc-PANI films were in the reduced state. It is worth noting that changing the voltage produced similar changes in the UV-Vis absorption spectra of the CuPc-PANI composite film and PANI film, indicating that combining CuPc with PANI did not significantly change the UV absorption properties of PANI. Therefore, the composite film still retained the original electrochromic properties of PANI.
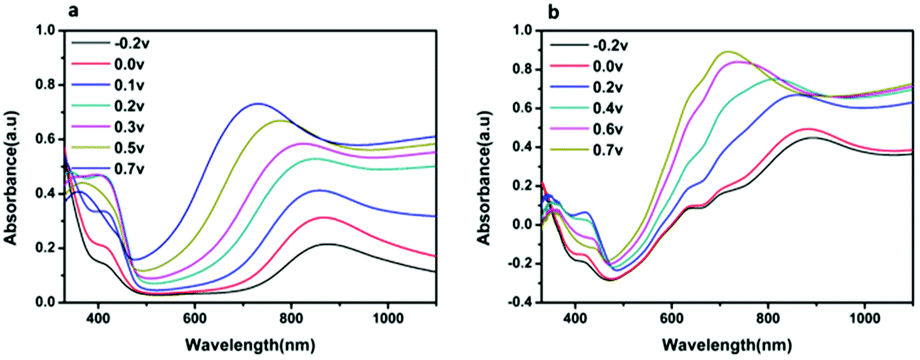 | ||
| Fig. 4 UV-Vis absorption spectra of (a) pure PANI and (b) the CuPc-PANI composite film, each acquired at various voltages (−0.2 to 0.7 V) in a 1 M H2SO4 solution. | ||
Fig. 5a shows the recorded CV curves of PANI, CuPc and CuPc-PANI films in an aqueous solution of 1 M H2SO4 from −0.2 to 0.7 V at a scanning rate of 100 mV s−1. The CV curves of the PANI and CuPc-PANI films were observed to substantially coincide, each showing an oxidation peak at 0.3 V and reduction peak at about 0.0 V. Moreover, the CuPc-PANI composite film was concluded to have retained good electrochemical activity. The inset depicts an enlarged view of the CV curve for the CuPc film. Inspection of this curve showed two weak oxidation peaks, at 0.5 and 0.67 V, and the corresponding reduction peaks at 0.5 and 0.69 V, with these results due to the weak electrochromic properties of CuPc, i.e., it not changing color between −0.2 and 0.7 V. In contrast, the PANI film in the CV test showed a color change from pale yellow to yellowish green to blue as the voltage was increased from −0.2 V to 0.7 V. Photographic images of PANI and CuPc-PANI films in discolored (−0.2 V) and colored (0.7 V) states are shown in Fig. 5b. At −0.2 V, the PANI was reduced and appeared transparent, while the CuPc-PANI film appeared as weak blue. This result can be mainly attributed to the light blue of the CuPc film at this voltage. When the applied voltage was increased to 0.7 V, both films showed blue color. As shown in Fig. 5b, the uniformity of the CuPc-PANI film is obviously similar to that of the PANI film, indicating that the introduction of the CuPc nanostructure did not have much of a negative effect on the formation of the PANI film.
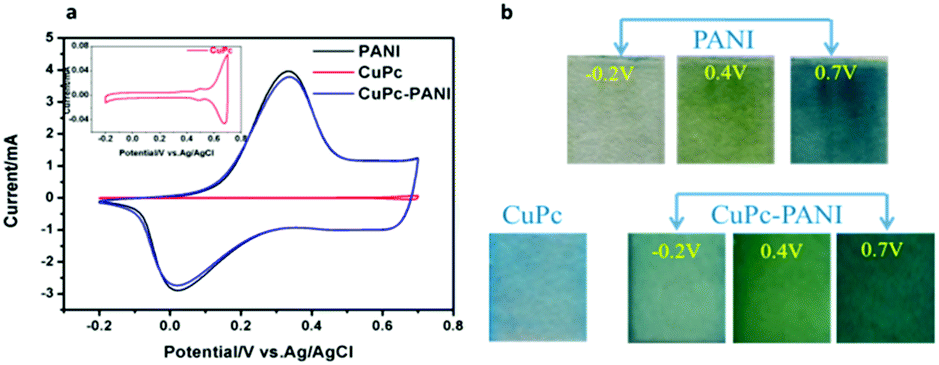 | ||
| Fig. 5 (a) Cyclic voltammetry curves of pure PANI and CuPc-PANI composite films recorded in a 1 M H2SO4 aqueous solution at a scan rate of 100 mV s −1. (b) Photographic images of the CuPc film and of the pure PANI and CuPc-PANI films at various applied voltages. | ||
Electrochemical stability levels of the pure PANI film and CuPc-PANI nanocomposite film were determined by carrying out CV scanning for 500 cycles between −0.2 V and 0.7 V in a 1 M H2SO4 aqueous solution (as shown in Fig. 6). After 500 cycles, the CV curves of both the PANI film and CuPc-PANI nanocomposite film showed decreases in electrochemical stability. The electroactivity of the PANI film decreased by 51.98%, while that of the CuPc-PANI nanocomposite film decreased by only 31.29%. The result suggested that the electrochemical stability of the composite film was obviously enhanced as a result of the introduction of the CuPc nanowires. In general, the performance degradation of a conductive polymer is inevitable in the process of repeated doping/dedoping. Poor adhesion of the conductive polymer to the substrate is an important cause of low electrode performance in long-term operation. The conductive ITO substrate is an inorganic material with a smooth surface and the conductive polymer is an organic material. There are some differences in the properties of the two materials, such as intermolecular and intramolecular forces, i.e., physical and chemical properties. Therefore, the interfacial adhesion between the two compositions is not very good.33 In the case of repeated doping and dedoping, the substrate–polymer joint is gradually corroded, which leads to a worsening of electrochromic properties. Herein, the introduction of CuPc nanostructures between the PANI film and the ITO substrate provided multi-angle and non-planar interfacial contacts and significantly increased the effective area between the PANI and CuPc-coated electrodes. Thus, such a composite structure with enhanced interfacial adhesion can increase the long-term electrochemical stability of electrochromic materials and devices.34
 | ||
| Fig. 6 The 1st cycle (dark line) and 500th cycle (red line) CV curves of (a) the pure PANI film and (b) CuPc-PANI composite film as a function of repeated scans in 1 M H2SO4 between −0.2 and 0.7 V. Scan rate: 100 mV s −1. | ||
The electrochromic switching behaviours of the PANI film and CuPc-PANI composite film were monitored at the wavelength of maximum absorption in order to characterize their optical contrasts and response times. Fig. 7 displays the optical contrast curves of the PANI film and CuPc-PANI composite film at 730 nm in an aqueous solution of 1 M H2SO4 between −0.2 V and 0.7 V with a residence time of 10 s. The optical contrast of the PANI film was 56%, and that of the CuPc-PANI film was 58%. The introduction of CuPc nanowires did not significantly improve the optical contrast of PANI. When PANI was bleached to pale yellow, the color of the composite film remained light blue due to the overlay of the CuPc layer.
 | ||
| Fig. 7 Kinetic optical transmittance curves at 730 nm of (a) pure PANI and (b) the CuPc-PANI composite film, each subjected to switching between −0.2 and 0.7 V for 10 s at each step in an aqueous solution of 1 M H2SO4. | ||
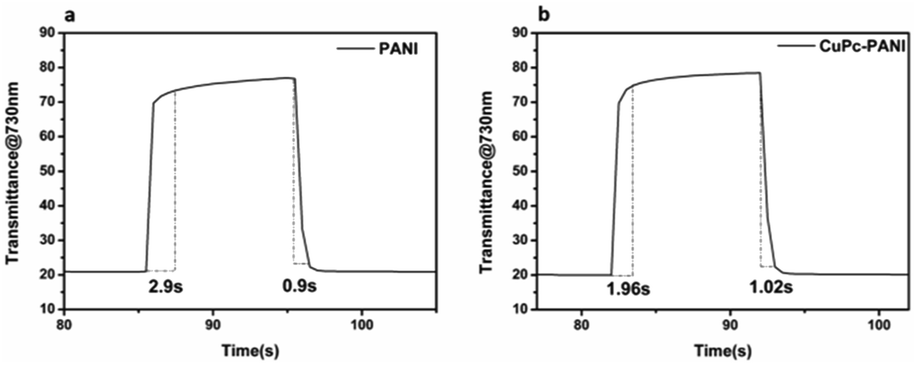
Response time is an important measure of the performance of an electrochromic material and it is defined as the time it takes for a material to reach 95% of its full change in absorbance after switching of the voltage. Fig. 8 shows the response time of the PANI film and CuPc-PANI composite film at 730 nm. The PANI film displayed a discoloring time of 2.9 s and a coloring time of 0.9 s. For comparison, the CuPc-PANI displayed a discoloring time of 1.96 s and a coloring time of 1.02 s. In other words, the results showed a shorter discoloring time for the CuPc-PANI nanocomposite film than for the PANI film. This difference was speculated to have been due to the introduction of CuPc nanowires having improved the surface morphology of the PANI film, specifically having increased the contact area between PANI and electrolyte solution, which would have facilitated the doping/dedoping of ions and their diffusion in the polymer film, thus improving the response time. The electrochromic performance of the CuPc-PANI composite film in the current work was also better than that of PANI-base composite films reported in some of the literature (Table S1†). In addition, considering that the thickness and areal dimensions of the CuPc film has been shown to change with a change of electrodeposition charge, the effect of the magnitude of the electric charge of CuPc on the electrochromic properties of the composite film were studied (as shown in Table S2 and Fig S2†). The optimized data were used for the experiments described in this paper.
 | ||
| Fig. 8 Response times at 730 nm of (a) pure PANI and (b) the CuPc-PANI composite film. | ||
Fig. 9 shows a possible mechanism for the diffusion of the counterions in the PANI film and the CuPc-PANI composite film. According to this proposed mechanism, when a voltage is applied, the counterions in the electrolyte would enter the PANI film and then diffuse using different paths in the film. The slow response speed of the PANI film was attributed to the long diffusion distance and slow diffusion of the counterions in the film. The introduction of CuPc nanowires in the PANI film was modeled to improve the diffusion of counterions in the PANIs. An application of voltage would cause the surface of CuPc on the ITO substrate to become positively charged. Entry of the counterions of the electrolyte into the PANI film would result in a shortening of the diffusion distance, and an increase in the density of available contact sites, which would in turn speed up the diffusion of counterions and improve the response speed of the PANI film.
 | ||
| Fig. 9 The behaviors of counterion transport in (a) the PANI film and (b) CuPc-PANI composite film. | ||
Nyquist plots are often used to investigate the charge transfer impedance and ion diffusion process of electrochromic materials. The Nyquist plots of the two films (Fig. 10) each show a semicircle in the high-frequency region and an inclined line in the low-frequency region. The high-frequency semicircle corresponded to the charge transfer impedance at the electrode/electrolyte interface, and the inclined line in the low-frequency region was assigned to the ion diffusion process within the electrode. It is well known that a larger semicircle means a higher charge transfer resistance, and a steeper slope means a lower ion diffusion rate.19 Our results demonstrate faster ion diffusion and greater charge transfer resistance for the CuPc-PANI composite film than for the PANI film. As an organic semiconductor material with photoconductivity properties, the conductivity of CuPc was observed to be not as high as that of ITO, which led to the large charge transfer impedance of the composite film. However, the introduction of the CuPc nanostructure increased the contact area between polyaniline and electrolyte, which was conducive to the doping/dedoping of ions and ion transport, and improved the rate of diffusion of the ions.
 | ||
| Fig. 10 Nyquist plots of PANI and the CuPc-PANI composite film. EIS measurements were conducted in the frequency range 0.1 Hz to 100 kHz in an aqueous solution of 1 M H2SO4. The right panel shows a larger version of the blue box of the left panel. | ||
Interestingly, in addition to the excellent electrochromic properties of the CuPc-PANI composite film, we also found it displaying supercapacitor properties. The CV curves of the CuPc-PANI composite film acquired at different scan rates (Fig. S3†) exhibited each a nearly rectangular shape, which demonstrated that the composite film displayed pseudocapacitance characteristics.35,36 The supercapacitive performance was investigated by evaluating the charge–discharge behaviour of the CuPc-PANI composite film in an aqueous solution of 1 M H2SO4 at a series of applied currents using a voltage window from −0.2 to 0.7 V. The area of the CuPc-PANI composite film that was measured was 2.34 cm2. The areal capacitance (C, mF cm−2) of the CuPc-PANI composite film was calculated from discharge curves using the equation C = (IΔt/SΔV), where I is the discharge current, Δt is the discharge time, ΔV is the potential window, and S is the effective area of electrode. As shown in Fig. 11a, areal capacitances of the CuPc-PANI composite film were measured at various currents to be in the vicinity of ∼5.4 mF cm−2 This capacitance value was smaller than that of the W18O49/PANI composite reported by the Zhao group (10 mF cm−2).37 The vertical array of W18O49 nanowires and the thick PANI film may have been the main reasons for the better capacitance performance. The charge–discharge curves of the CuPc-PANI composite showed a non-ideal triangular shape due to the redox process, indicating that the composite film displayed the typical pseudocapacitance characteristics and fast charge–discharge ability.37 Fig. 11b shows the areal specific capacitance values of the CuPc-PANI composite film at various current densities. It is common for the areal capacitance to decrease with an increase in current density. This phenomenon can explain that at a higher current density, the slow transfer of doping ions produces dynamic resistance, which affects the charge transfer process on the electrode/electrolyte interface, so that some polymer chains cannot fully participate in the redox reaction.37,38
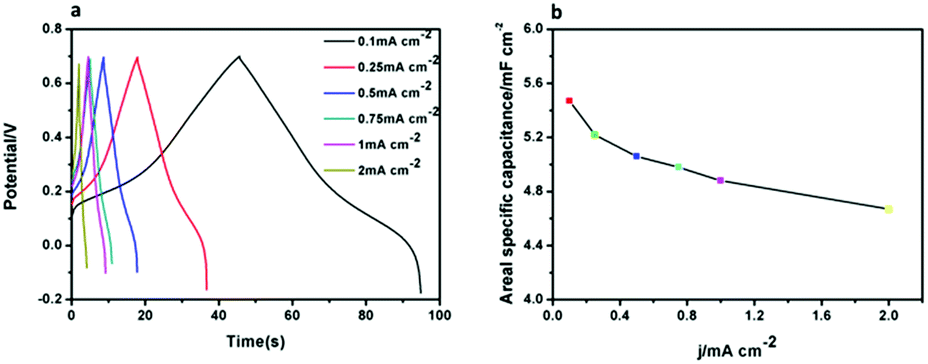 | ||
| Fig. 11 (a) Galvanostatic charge–discharge curves of the CuPc-PANI composite film. (b) Areal specific capacitance of the CuPc-PANI composite film as a function of current density. | ||
4. Conclusions
A novel CuPc-PANI composite was prepared in situ by following the electrochemical method. The composite film showed better electrochromic properties such as higher optical contrast, faster response speed and better cycle stability, than did the PANI film. The improvement of electrochromic performance was mainly attributed to the introduction of CuPc nanostructures having increased the contact area between the conductive polymer and the electrolyte, in turn resulting in facilitated ion diffusion and increased surface area for charge transfer. Moreover, the composite film also showed obvious supercapacitor properties, specifically showing an areal capacitance of ∼5.4 mF cm−2 at various currents. This result suggested that the composites could be used not only in the electrochromic field, but also in energy storage.Conflicts of interest
There are no conflicts to declare.Acknowledgements
The authors are grateful for support from the National Natural Science Foundation of China (51573165, 51673174, 51603185, 51703199) and the Natural Science Foundation of Zhejiang Province (LZ17E030001, LY19E030006, LQ17F010004). They are especially thankful for the discussion of pseudocapacitance data with Prof. Chang Su of the College of Chemical Engineering at Shenyang University of Chemical Technology, and the collection of TEM data by Qian Yang of the Research Center of Analysis and Measurement at Zhejiang University of Technology.References
- A. A. Argun, P. H. Aubert, B. C. Tompson, I. Schwendeman, C. L. Gaupp, J. Hwang, N. J. Pinto, D. B. Tanner, A. G. MacDiarmid and J. R. Reynolds, Chem. Mater., 2004, 16(23), 4401–4412 CrossRef CAS.
- M. Sezgin, O. Ozay, S. Koyuncu, H. Ozay and F. Baycan Koyuncu, Chem. Eng. J., 2015, 274, 282–289 CrossRef CAS.
- S. L. Ming, S. J. Zhen, K. W. Lin, L. Zhao, J. K. Xu and B. Y. Lu, ACS Appl. Mater. Interfaces, 2015, 7(21), 11089–11098 CrossRef CAS.
- B. Y. Lu, S. J. Zhen, S. M. Zhang, J. K. Xu and G. Q. Zhao, Polym. Chem., 2014, 5(17), 4896–4908 RSC.
- J. Jensen, M. Hosel, A. L. Dyer and F. C. Krebs, Adv. Funct. Mater., 2015, 25(14), 2073–2090 CrossRef CAS.
- K. Wang, T. Zhang, Y. H. Hu, W. G. Yang and Y. Shi, Electrochim. Acta, 2014, 130, 46–51 CrossRef CAS.
- G. Atakan and G. Gunbas, RSC Adv., 2016, 6(30), 25620–25623 RSC.
- S. Zhao, W. D. Huang, Z. S. Guan, B. Jin and D. B. Xiao, Electrochim. Acta, 2019, 298, 533–540 CrossRef CAS.
- B. Hu, X. J. Lv, J. W. Sun, G. F. Bian, M. Ouyang, Z. Y. Fu, P. J. Wang and C. Zhang, Org. Electron., 2013, 14(6), 1521–1530 CrossRef CAS.
- P. M. Beaujuge, S. Ellinger and J. R. Reynolds, Nat. Mater., 2008, 7(10), 795–799 CrossRef CAS.
- A. J. C. Silva, S. M. F. Ferreira, D. D. Santos, M. Navarro, J. Tonholo and A. S. Ribeiro, Sol. Energy Mater. Sol. Cells, 2012, 103, 108–113 CrossRef CAS.
- L. L. Ji, Y. Y. Dai, S. M. Yan, X. J. Lv, C. Su, L. H. Xu, Y. K. Lv, M. Ouyang, Z. F. Chen and C. Zhang, Sci. Rep., 2016, 6, 0068 Search PubMed.
- Y. J. Tao, K. Zhang, Z. Y. Zhang, H. F. Cheng, C. L. Jiao and Y. L. Zhao, Chem. Eng. J., 2016, 293, 34–43 CrossRef CAS.
- Y. Y. Dai, W. J. Li, X. X. Qu, J. Liu, S. M. Yan, M. Ouyang, X. J. Lv and C. Zhang, Electrochim. Acta, 2017, 229, 271–280 CrossRef CAS.
- Y. J. Dong, F. F. Luo, L. Chen, F. Y. Yuan, Y. J. Hou, W. J. Li, S. M. Yan, Y. Y. Dai, M. Ouyang and C. Zhang, Phys. Chem. Chem. Phys., 2018, 20, 12923–12928 RSC.
- J. L. Lu, W. S. Liu, H. Ling, J. H. Kong, G. Q. Ding, D. Zhou and X. H. Lu, RSC Adv., 2012, 2, 10537–10543 RSC.
- J. H. Zhu, S. Y. Wei, M. Alexander, T. D. Dang, T. C. Ho and Z. H. Guo, Adv. Funct. Mater., 2010, 20(18), 3076–3084 CrossRef CAS.
- Z. Q. Tong, S. K. Liu, X. G. Li, J. P. Zhao and Y. Li, Nanoscale Horiz., 2018, 3, 261–292 RSC.
- G. F. Cai, J. P. Tu, D. Zhou, J. H. Zhang, Q. Q. Xiong, X. Y. Zhao, X. L. Wang and C. D. Gu, J. Phys. Chem. C, 2013, 117, 15967–15975 CrossRef CAS.
- X. J. Lv, J. W. Sun, B. Hu, M. Ouyang, Z. Y. Fu, P. J. Wang, G. F. Bian and C. Zhang, Nanotechnology, 2013, 24(26), 265705 CrossRef CAS.
- X. H. Xia, D. L. Chao, X. Y. Qi, Q. Q. Xiong, Y. Q. Zhang, J. P. Tu, H. Zhang and H. J. Fan, Nano Lett., 2013, 13(9), 4562–4568 CrossRef CAS.
- M. Kateb, S. Safarian, M. Kolahdouz, M. Fathipour and V. Ahamdi, Sol. Energy Mater. Sol. Cells, 2016, 145, 200–205 CrossRef CAS.
- H. Randriamahazaka, V. Noel, S. Guillerez and C. Cgevrot, J. Electroanal. Chem., 2005, 585(2), 157–166 CrossRef CAS.
- S. H. Zhang, G. Sun, Y. F. He, R. F. Fu, Y. C. Gu and S. Chen, ACS Appl. Mater. Interfaces, 2017, 9, 16426–16434 CrossRef CAS.
- F. Hu, J. L. Xu, S. H. Zhang, J. Jiang, B. Yan, Y. C. Gu, M. J. Jiang, S. J. Lin and S. Chen, J. Mater. Chem. C, 2018, 6(21), 5707–5715 RSC.
- C. L. Lin and L. J. Liao, Sol. Energy Mater. Sol. Cells, 2015, 145, 54–60 CrossRef.
- F. M. Liu, J. Sun, S. Xiao, W. L. Huang, S. H. Tao, Y. Zhang, Y. L. Gao and J. L. Yang, Nanotechnology, 2015, 26(22), 225601 CrossRef.
- S. Nagel, M. Lener, C. Keil, R. Gerdes, L. Lapok, S. M. Gorun and D. Schlettwein, J. Phys. Chem. C, 2011, 115(17), 8759–8767 CrossRef CAS.
- M. Ouyang, R. Bai, L. Chen, L. G. Yang, M. Wang and H. Z. Chen, J. Phys. Chem. C, 2008, 112(30), 11250–11256 CrossRef CAS.
- M. Ouyang, R. Bai, L. G. Yang, Q. Chen, Y. G. Han, M. Wang, Y. Yang and H. Z. Chen, J. Phys. Chem. C, 2008, 112(7), 2343–2348 CrossRef CAS.
- Z. C. Wang, R. B. Wei and X. B. Liu, J. Mater. Sci., 2016, 51, 4682–4690 CrossRef CAS.
- B. Li, C. Bao, B. X. Shi, K. Tomonori and H. Mitsuo, J. Infrared, Millimeter, Terahertz Waves, 2002, 21(4), 257–260 CAS.
- L. Zhao, L. Zhao, Y. X. Xu, T. F. Qiu, L. J. Zhi and G. Q. Shi, Electrochim. Acta, 2009, 55(2), 491–497 CrossRef CAS.
- X. J. Lv, B. Hu, J. W. Sun, M. Ouyang, C. H. Yu, Z. Y. Fu and C. Zhang, J. Electrochem. Soc., 2013, 160(2), H87–H92 CrossRef CAS.
- Y. Zhong, Z. S. Chai, Z. M. Liang, P. Sun, W. G. Xie, C. X. Zhao and W. J. Mai, ACS Appl. Mater. Interfaces, 2017, 9(39), 34085–34092 CrossRef CAS.
- K. J. Sun, H. Peng, J. J. Mu, G. F. Ma, G. H. Zhao and Z. Q. Lei, Ionics, 2015, 21(8), 2309–2317 CrossRef CAS.
- Y. Y. Tian, S. Cong, W. M. Su, H. Y. Chen, Q. W. Li, F. X. Geng and Z. G. Zhao, Nano Lett., 2014, 14(4), 2150–2156 CrossRef CAS.
- Q. F. Guo, J. J. Li, B. Zhang, G. M. Nie and D. B. Wang, ACS Appl. Mater. Interfaces, 2019, 11, 6491–6501 CrossRef CAS PubMed.
Footnote |
| † Electronic supplementary information (ESI) available. See DOI: 10.1039/c9ra06540g |
| This journal is © The Royal Society of Chemistry 2019 |