 Open Access Article
Effect of ZnO on (ferroelectric) fatigue retention and thermal stability of ferroelectric properties in lead free (K0.5Na0.5)(Nb0.7Ta0.3)O3 ceramics†
Vineetha P *,
Roshan Jose
 and
K. Venkata Saravanan
Department of Physics, School of Basic and Applied Sciences, Central University of Tamil Nadu, Thiruvarur-610005, India. E-mail: vineethasdi@gmail.com; Tel: +91-9387124294
First published on 29th October 2019
Abstract
This work investigates and reports the effect of ZnO addition on the ferroelectric properties of (K0.5Na0.5)(Nb0.7Ta0.3)O3 (KNNT) ceramics prepared by a solid state reaction method. Though literature is abundant on the study of the effect of ZnO on the sinterability, microstructure and electrical properties of KNN based materials, the effect of ZnO on their ferroelectric properties has seldom been studied in detail, especially in KNNT. In the current study, 2, 4 and 6 wt% of ZnO was added to KNNT ceramics. The XRD results revealed ZnO addition has no effect on the crystal symmetry of KNNT. However, a ZnO secondary phase was found in KNNT ceramics with 4 and 6 wt% ZnO doping. An increase in grain size was observed with increases in the concentration of ZnO, indicating a direct dependence of grain size on the concentration of ZnO in the KNNT matrix. From ferroelectric studies it was observed that a lower electric field was sufficient to get maximum polarization for ZnO doped KNNT samples compared to that of pure KNNT ceramics. A high remnant polarization (Pr = 14.0 μC cm−2) and lower coercive field (Ec = 5.6 kV cm−1) was obtained for 2 wt% ZnO doped KNNT. These samples showed the least fatigue (0.8%) after 109 cycles in comparison to pure (5%), 4 wt% ZnO doped (24.9%) and 6 wt% ZnO doped (30%) KNNT ceramics. The diminution in Ps, Pr, and Ec was only 26.0%, 26.2% and 18.5%, respectively, with an increase in measurement temperature, which indicates improved thermal stability in 2 wt% ZnO doped KNNT. From the present study the optimum concentration of ZnO in KNNT is identify to be 2.0 wt% and their improved properties in comparison to the pure KNNT ceramics are discussed in detail.
1 Introduction
The main characteristic of a ferroelectric material is the existence of spontaneous polarization and its reversal in an externally applied alternating electric field.1 The polarization that subsists in the material even after the removal of the electric field (remnant polarization) directs the material towards use in a variety of applications. Ferroelectric fatigue grabs attention as soon as a ferroelectric material finds an application where it has to be run through a cyclic electric field. The mode (unipolar/bipolar) as well as the strength of electric field that has to be applied in a device depends particularly on the specific application. In order to resist stress that would be developed by reorientation of dipoles, actuators have to be run in unipolar mode whereas in memory applications the device has to be operated in an alternating electric field.2 In any application the enduring performance of the component is an essential requirement and in the case of a ferroelectric material the main drawback is fatigue. Fatigue is the reduction in remnant polarization under cyclic polarization reversals. Researchers are more interested bipolar fatigue studies and this is probably due to the potential applications of ferroelectric materials in nonvolatile memory devices, where each cell is driven by bipolar pulses.3 Defects that come from aliovalent doping or the impurities from the raw materials are the source of fatigue.4,5 An internal electric field that has been generated by the charged defects will counteract to the external applied electric field and which results in reduced macroscopic polarization. In a donor doped (ions are substituted by ions of higher valence) material negatively charged defects and in an acceptor doped (ions are substituted by ions of lower valence) material positively charged defects like oxygen vacancies will be created to maintain the overall charge neutrality.6 Thus acceptor doping will leads to an increase in oxygen vacancy. The addition of ZnO has shown donor behavior in KNN based material.7 However it is also possible that the Zn2+ (0.74 Å) may replace the Nb5+ (0.64 Å) creating oxygen vacancies and leaves the material with fatigue.8 Moreover a dual character of ZnO, acceptor behavior at 0.6 mol% of ZnO and donor behavior when ZnO was added to the initial mixture was also been reported.9Lead zirconium titanate commonly known as PZT is used in most of the devices owing to its prominent ferro and piezoelectric properties. But lead based materials which are detrimental to both human and environment should be replaced with lead free counter parts. Recently KNN based lead free materials have got much attention due to its properties comparable to PZT. Even then the sinterability of KNN based materials were a concerning matter. The volatilization of alkaline earth elements at high temperature makes the sample less dense and defective.10 Studies have been done to improve the density of KNN based materials by adding sintering aids such as CuO, MnO and ZnO.11–14 Although there were many reports in which ZnO is used as a sintering aid which improves the densification of samples along with the enhancement of piezoelectricity,15 to best of our knowledge no one has reported the fatigue endurance effect of ZnO. It has been reported that (K0.5Na0.5)(Nb1−xTax)O3 composition has shown good piezoelectric property (205 pC N−1) for x = 0.3.16 But the reported value of remnant polarization for this composition was low compared to other Ta composition.17 In general, the piezoelectric coupling factor (kp) is proportional to the remnant polarization (Pr).18 So a better ferroelectric property is expected to enhance the piezoelectric property too. This study was carried out primarily to investigate the effect of ZnO on ferroelectric properties of (K0.5Na0.5)(Nb0.7Ta0.3)O3. We expect that the replacement of A site elements with Zn will trim down the electric fatigue via reducing defects and in addition to that the role of ZnO as a sintering aid may also enhance the ferroelectric properties.
2 Experimental
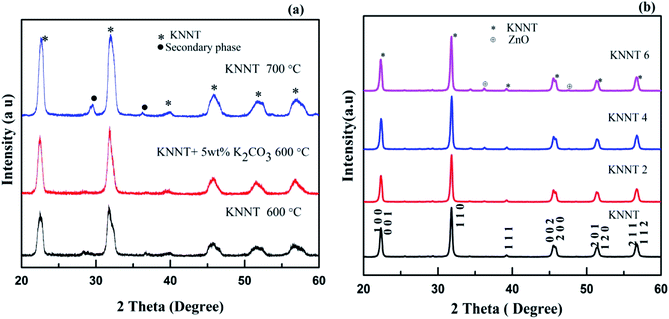
All the samples were prepared by solid state reaction method from high pure carbonate and oxide precursors. Stoichiometric amount of potassium carbonate (K2CO3, 99%, Merck), sodium carbonate (Na2CO3, 99%, Merck), niobium (V) oxide (Nb2O5, 99.9%, Aldrich), and tantalum (V) oxide (Ta2O5, 99%, Aldrich) were weighed and homogenously mixed for 24 h in acetone medium using a planetary ball mill. Then the homogenously mixture powders were dried in an oven and calcined. The calcined powers were attrition milled for about 2 h. In order to obtain phase pure KNNT samples, 3 sets of samples were prepared. The first set of samples was calcined at 600 °C for 5 h. The XRD results, as shown in Fig. 1a indicate the presence of secondary phase. Hence, the calcination temperature was raised to 700 °C for one sample set and at the same time to another sample set, 5 wt% K2CO3 was added in excess, to compensate for the loss of potassium, if any, at high temperatures. This sample set was calcined at 600 °C for 5 hours. As evident from the XRD pattern (Fig. 1a), the samples calcined at 700 °C also resulted in secondary phase formation. Phase pure sample was obtained for samples with 5 wt% K2CO3 added in excess. This result points out that the secondary phase is due to the volatilization of potassium. The samples prepared under this condition were used for further studies.In order to study the effect of ZnO addition on the properties of KNNT ceramics, 0 wt%, 2 wt%, 4 wt% and 6 wt% of ZnO was added to the calcined KNNT powder, hereafter called KNNT, KNNT2, KNNT4, and KNNT6, respectively. The ZnO added KNNT samples were homogeneously mixed using an agate motor and pestle for 2 h and were uniaxialy pressed into pellets of 8 mm diameter and ∼1 mm thickness. Sintering (in air) of the pressed pellets was carried out at 1100 °C for 2 h in a muffle furnace for all the compositions. The addition of ZnO resulted in the formation of stable KNNT phase since none of ZnO-doped KNNT ceramics showed deliquescence when they were exposed to water for a long period of time.
The density of all the sintered samples was measured by Archimedes method. The crystal structure and phase assemblage was evaluated by X-ray diffraction technique (XRD, Rigaku Miniflex 600, Cu-Kα radiation) in the 2θ range from 20° to 60° with a step size of 0.02°. Scanning electron microscope (SEM, TESCAN-VEGA3) operating at an acceleration voltage of 20 kV was used to determine the effect ZnO addition on the surface morphology of KNNT ceramics. Silver paste was applied on the two flat surfaces of the disc-shaped specimens and was fired at 100 °C for 10 min, which acts as the electrodes to carryout electrical characterization. The ferroelectric properties such as the P–E hysteresis loop, fatigue, temperature dependence (room temperature −175 °C) of remnant polarization (Pr) were measured using a ferroelectric test system (Marine India PE Loop tracer).
3 Results and discussions
3.1 X-ray diffraction (XRD)
The XRD patterns of KNNT, KNNT powder calcined at 700 °C for 5 h and 5 wt% potassium added KNNT calcined at 600 °C for 5 h are shown in Fig. 1a. Presence secondary phase was observed in KNNT powder calcined at 600 °C and 700 °C for 5 h. When an additional amount of potassium was added, phase pure samples were obtained. This result points out that the secondary phase was due to the volatilization of potassium. The XRD pattern of KNNT0, KNNT2, KNNT4 and KNNT6 ceramic samples sintered at 1100 °C for 2 h is shown in Fig. 1b. It is clear that all the samples exhibit perovskite monoclinic structure (JCPDS 77-0038). At lower concentrations of ZnO i.e., up to 2 wt%, the intensity of ZnO peaks are very small, however, when the concentration of ZnO exceeded 2 wt%, the diffraction peaks corresponding to ZnO become more intense indicating that the solubility of ZnO is limited in the KNNT matrix and the excess ZnO is unable to diffuse into the KNNT matrix. Similar observations have been reported in ZnO doped KNN ceramics elsewhere.19 Rietveld refinement of diffraction data was done using Full Prof software and lattice parameters obtained are tabulated in Table 1. Six coefficient polynomial functions were used for background correction, Pseudo-Voiget function was used to model the peak profile and ‘Profile Matching with constant scale factor’ structural model was used for the refinement. The results are in good agreement with the literatures.20–22 The Rietveld fit along with the reliability factors Rp, Rwp, χ2 etc. for all samples are provided in ESI.†| Sample name | a (Å) | b (Å) | c (Å) | β (°) | V (Å3) |
|---|---|---|---|---|---|
| KNNT0 | 3.9972 | 3.9567 | 3.97944 | 90.334 | 62.937 |
| KNNT2 | 3.9929 | 3.9538 | 3.9761 | 90.34 | 62.770 |
| KNNT4 | 3.9879 | 3.9534 | 3.9736 | 90.30 | 62.645 |
| KNNT6 | 3.9897 | 3.9556 | 3.9765 | 90.28 | 62.755 |
3.2 SEM analysis
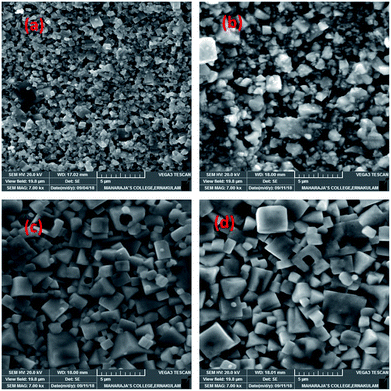
SEM investigation was carried out to understand the influence of ZnO addition on the microstructural development, grain growth and densification of KNNT ceramics. Fig. 2a, shows the SEM image of the fracture surface of undoped KNNT ceramics. A porous microstructure is observed with an average grain size of approximately 0.31 μm. Fig. 2b–d shows the SEM micrograph of ZnO-added KNNT ceramics. All the doped samples show relatively dense microstructure. When 4 wt% or more ZnO was added, a homogeneous and dense microstructure is observed, indicating that ZnO-doping has a significant effect on the surface morphology of KNNT ceramics. It is observed that ZnO doping in KNNT results in more regular grains with increased grain size.The average grain size and density of pure and ZnO added KNNT ceramic is given in Table 2. The density of KNNT2 ceramics was found to be higher than pure KNNT. However, the density decreased for higher concentrations of ZnO. The average grain sizes of KNNT ceramics were found to increase with ZnO modifications. This confirms that ZnO addition promotes grain growth, since ZnO is a well-known sintering aid.23
| Sample name | Grain size (μm) | Density (g cm−3) |
|---|---|---|
| KNNT0 | 0.31 | 4.01 |
| KNNT2 | 0.72 | 4.90 |
| KNNT4 | 1.16 | 4.78 |
| KNNT6 | 1.30 | 4.69 |
During sintering process, the dominant mechanism for grain growth is diffusion and hence in the present case, we expect ZnO to exist in two forms resulting in two different distribution mechanisms; at lower concentration of ZnO, increase in density may be attributed to the diffusion of the ZnO in to the KNNT host matrix forming a homogeneous mixture. Whereas, in the other hand, for higher concentrations, ZnO diffuses along the grain boundaries of KNNT, thereby enhancing the mass transport leading to increased grain boundary diffusion, expediting grain growth rates of the KNNT ceramics.7,24 The excess ZnO along the grain boundary that are not diffused in to the KNNT matrix forms the secondary phase in KNNT ceramics with ZnO content of 4 and 6 wt%. The decrease in density for KNNT ceramics with ZnO content of 4 and 6 wt% can also be attributed to the presence of secondary phase.
3.3 Ferroelectric studies
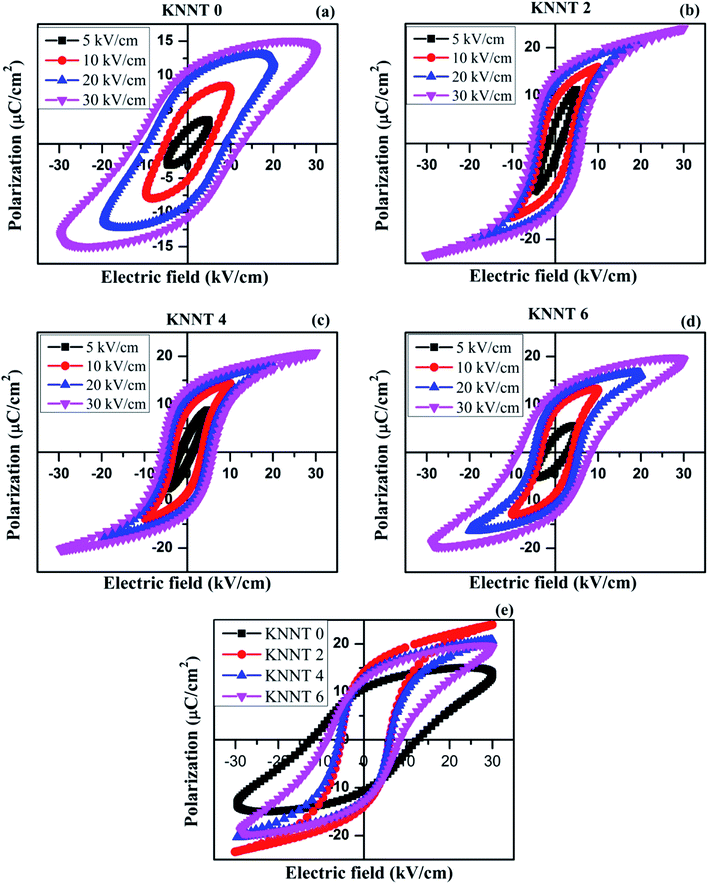
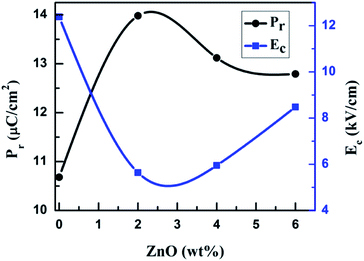
Fig. 3a–d shows the polarization versus electrical field (P–E) hysteresis loops of sintered, undoped and ZnO doped KNNT ceramics measured by varying the electric field up to 30 kV cm−1, at a frequency of 50 Hz and at ambient conditions. An increase in remnant polarization (Pr) with increase in electric field was observed for all the samples, confirming the ferroelectric nature of ZnO doped KNNT ceramics. Fig. 3e presents the P–E curves of all the KNNT ceramics measured at 30 kV cm−1. The saturation polarization (Ps, a nearly constant polarization value as E increases), remnant polarization (Pr, P at E = 0) and coercive field (Ec, E at P = 0) values for all the studied samples are listed in Table 3. The variation in remnant polarization Pr, and the coercive field Ec with ZnO concentration is shown in Fig. 4.| Sample name | Ps (μC cm−2) | Pr (μC cm−2) | Ec (kV cm−1) |
|---|---|---|---|
| KNNT0 | 13.6 | 10.7 | 12.4 |
| KNNT2 | 24.0 | 14.0 | 5.6 |
| KNNT4 | 20.5 | 13.1 | 6.0 |
| KNNT6 | 19.2 | 12.8 | 8.5 |
As observed in Fig. 4 and 3e, the undoped KNNT exhibits a leaky P–E loop with Pr of 10.7 μC cm−2 and Ec of 12.4 kV cm−1. Similar kind of leaky loops have been reported in the case of doped and undoped KNN25,26 The leaky loop is believed to be due to charge defects, that is, cation and/or oxygen vacancies that exhibit as space charges.23,27 The space charge effect inhibits the polarization switching under a high applied field amplitude, resulting in a lower Pr and higher Ec values in undoped KNNT ceramics. The values of Ps and Pr increase with increasing ZnO contents and achieve the maximum values 24.0 μC cm−2 and 14.0 μC cm−2, respectively, at 2 wt% of ZnO. With further increasing ZnO content, the decrease in the values of Ps and Pr is observed. On the other hand, the Ec value exhibits a decrease for 2 wt% of ZnO (Ec = 5.6 kV cm−1), and then increases for ZnO content >2 wt%. Hence, the optimum ferroelectric properties are found at 2 wt% of ZnO added KNNT ceramics which exhibited a well saturated, low leakage hysteresis loop. It is clear that the ferroelectric property of KNNT ceramics gets enhanced with ZnO addition. The enhanced properties for KNNT2 ceramics could be attributed to the role of ZnO, that enters the KNNT matrix forming a homogeneous mixture, thereby compensating for any charge defects, resulting in reduction of conductivity in the doped ceramics as compared to undoped KNNT.28,29
With further increase in ZnO content (4 and 6 wt%), the relative amount of KNNT to ZnO is reduced, resulting in the loss of P–E loop shape and ferroelectric property. The ferroelectic property can adversely be affected by ZnO that does not enter the KNNT matrix but forms a secondary phase, as evident from the XRD and SEM results. As the KNNT to ZnO ratio is reduced the volume of KNNT having ferroelectricity favoring non-centrosymmetric, monoclinic structure, with Pm space group is reduced relative to the volume of hexagonal phase of ZnO with centrosymmetric P63mc space group. A centrosymmetric structure does not favor ferroelectricity due to zero or negligible electric dipole moment. Therefore, it is reasonable to conclude that the decrease of ferroelectricity in higher concentration of ZnO is due to the segregation of secondary phase of ZnO along the grain boundary which is confirmed from the SEM-EDX data. The EDX data of KNNT6 sample is given in ESI.† It is also worth mentioning that the ZnO has higher conductivity,30 which can reduce the resistivity of KNNT ceramics resulting in poor ferroelectric property. The P–E studies complement the XRD and SEM results.
3.4 Fatigue retention
The polarization fatigue in ferroelectric materials is defined as the loss of switchable polarization with respect to cyclic electric field31–33 and it depends on various parameters including, experimental conditions such as measurement temperature, frequency, amplitude, applied electric field profile etc., material modifications such as crystal structure, microstructure, anisotropy, doping and other parameters such as leakage current, electrode type, interface layer and interface quality. However, the exact effect of the above parameters on the fatigue properties is still under debate.6 Fig. 5 shows the fatigue endurance characteristics i.e., the dependence of Pr on the number of cycles (up to 109) of bipolar triangular switching pulses of the undoped and ZnO doped KNNT ceramic samples. The relative ferroelectric fatigue of the undoped KNNT ceramics were 5% which decreased to 0.8% for 2 wt% doped ZnO samples. It is to be noted that domain switching is controlled by the competition between domain pinning and depinning process34 and fatigue is a result of charge injection and space charge accumulation that pins domain walls or impedes the nucleation and reversion of domain to permit switching. In the case of KNN based ceramics, cation vacancies are generally formed due to the evaporation of potassium or sodium while high temperature sintering and in order to maintain the charge oxygen vacancies are created.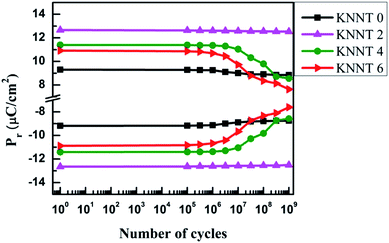 | ||
| Fig. 5 Dependence of Pr on the number of switching cycles for undoped and ZnO doped KNNT ceramic samples. | ||
The diffusion of oxygen vacancies present in KNNT due to volatilization of alkali metals35,36 and their aggregation lead to domain wall pinning and consequently resulting in 5% fatigue (after 109 cycles). The fatigue is overcome to a large extent in the case of KNNT2 because the Zn2+ that enters KNNT matrix acts like a donor dopant and thus there is reduced oxygen vacancies concentration.37,38 Further increase in ZnO concentration yielded 24.9% fatigue in KNNT4 and 30% in KNNT6. The possible reason for such high fatigue is due to the presence of secondary, ZnO phase. Similar result has been reported in CuO doped (Bi1/2Na1/2TiO3)–(BaTiO3) ceramics.39 The secondary phase present may lead to various local regions with different polarization/larger leakage currents which counteract the total polarization.
3.5 Thermal stability of ferroelectric property
In order to study the thermal stability of polarization behavior, temperature dependence of ferroelectric measurements was performed from room temperature (RT) to 175 °C on the pure KNNT and ZnO doped KNNT. Since, the macroscopic net polarization completely vanishes above the phase transition temperature (TC), the highest temperature chosen here is far below TC. The temperature dependent P(E) hysteresis loops of all the KNNT ceramics are shown in Fig. 6a–d, and the evolution of Ps, Pr, and Ec under various temperatures are plotted in Fig. 7e and f. Except for KNNT0, all other ZnO doped KNNT samples show saturated loops at room temperature. The leaky loop in KNNT0 ceramics can be as a result of charge defects arising due to cation and/or oxygen vacancies, as discussed in the earlier section. With increase in measurement temperature it is observed that the Ec increased from 8.9 kV cm−1 to 9.6 kV cm−1 by an amount of 7.3%, while the Pr and Ps values reduced by 32.5% and 11.6%, respectively. On addition on ZnO, a substantial change in the thermal stability of KNNT ceramics can be observed, where excluding KNNT6, we can observe on all other sample that with increasing temperature, the P(E) loops trend to become thin, accompanied by the reduced Ps, Pr and Ec. KNNT6 samples show an increase in Pr by 18% and a colossal increase in Ec of about 150%. On the other hand, KNNT4 samples show unprecedented decrease in Pr and Ps of 74% and 54.4%. Such high increase in Ec or decrease in Pr and Ps in KNNT6 and KNNT4 may be due to the presence of ZnO as secondary phase, which would hinder their use in practical applications. The saturated polarization loop of ZnO doped KNNT samples measured at room temperature can be attributed to the higher grain size of ceramic samples. The reorientations of polarizations get enhanced when the nonpolar grain boundary regions decreases with increase in grain size, which results in saturated P–E loop.40 However, as the measurement temperature increases, the ZnO phase which manifests itself in the form of secondary phase at higher concentrations is believed to generate charge defects. These defects inhibit the polarization switching at higher temperature, resulting in a decrease in Pr and/or increase in Ec of the ceramics.41 On the other hand the KNNT2 ceramic samples showed a rather different, improved thermal stability. The value of Pr decreases slightly from 12.5 to 9.2 μC cm−2 by a relatively small amount of 26.2%, and the Ec from 4.6 to 3.8 kV cm−1 by 18.5%. Compared to pure, KNNT0 and other relatively higher concentration of ZnO doped KNNT (KNNT4 and KNNT6), the KNNT2 samples have significantly well-sustained polarizations at elevated measurement temperatures.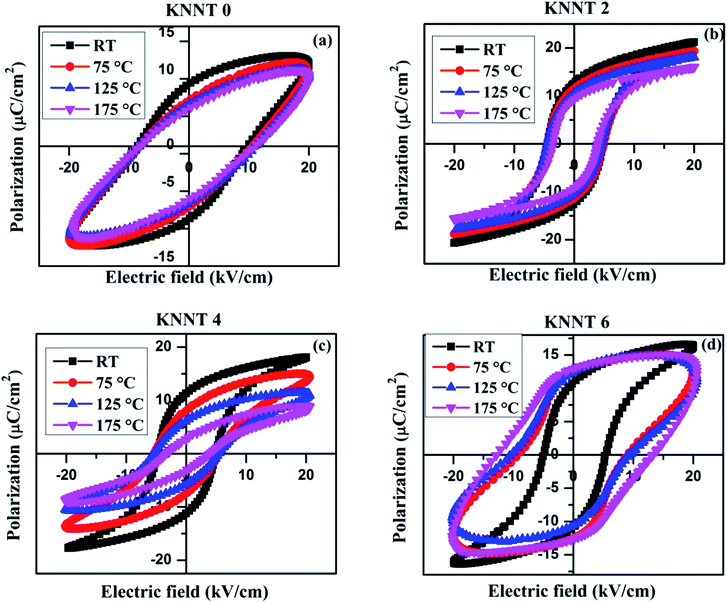 | ||
| Fig. 6 PE hysteresis loops of (a) KNNT0 (b) KNNT2 (c) KNNT4 and (d) KNNT6 samples at various temperatures. | ||
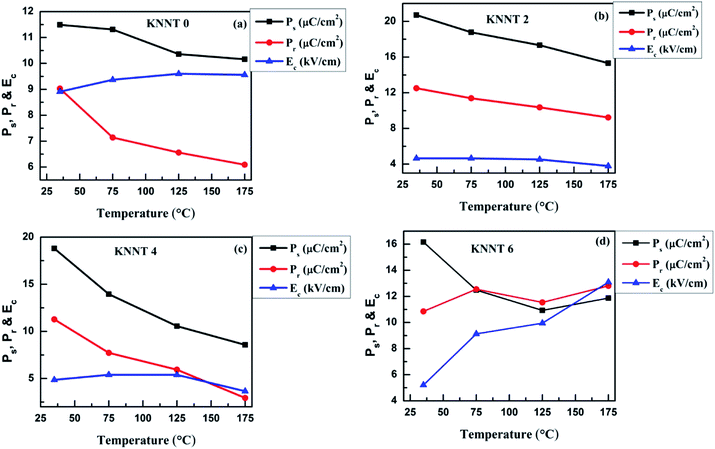 | ||
| Fig. 7 Diminution in Ps, Pr and Ec with temperature for (a) KNNT (b) KNNT2 (c) KNNT4 and (d) KNNT6 samples at various temperatures. | ||
It is clear that the enhanced ferroelectric and thermal stability properties of KNNT2 are due to the composite structure, where the Zn ions diffuse into the KNNT matrix compensating for the cation vacancy and thus forming a solid-solution. Similar behavior have been also observed in the BNT42 and KNN43 based ceramics.
4 Conclusions
The role of ZnO on ferroelectric fatigue and thermal stability of ferroelectric property of lead-free (K0.5Na0.5)(Nb0.7Ta0.3)O3 ceramics prepared by conventional solid state reaction method has been systematically studied and reported. Phase pure KNNT compositions were obtained when an excess amount (5 wt%) of K2CO3 was added during the calcination stage. Even though all the compositions were free of secondary phases after calcination, presences of trace amounts of secondary phases were observed after sintering at high temperature for KNNT samples with 4 and 6 wt% of ZnO. XRD analysis revealed that solubility of Zn is limited and is less than 2 wt% of ZnO in the KNNT matrix. Improved grain size was observed with increase in ZnO content. The KNNT sample with 2 wt% ZnO exhibits enhanced ferroelectric fatigue retention (109 cycles) properties. The Pr value was 12.6 μC cm−2 for 2 wt% ZnO added KNNT which only marginally reduced to 12.5 after 109 cycles. In other words, the ferroelectric fatigue of only 0.8% for 2 wt% ZnO added ceramics which were much less compared to 5% and 30% fatigue for undoped KNNT and 6 wt% ZnO added KNNT samples prepared and measured under identical conditions. Furthermore, the thermal stability of the ferroelectric property has also been strengthened for optimum concentration of ZnO, as can be evidenced from the temperature-dependent P–E measurements. The results suggest that the optimum ZnO content is 2 wt% in KNNT matrix which enhances the ferroelectric properties making it a potential candidate for application in highly reliable electronic devices.Conflicts of interest
There are no conflicts to declare.Acknowledgements
The authors acknowledge Department of Physics, Nirmalagiri College, Kannur for providing XRD characterization facilities and Maharajas College, Ernakulam and Avinashilingam University, Coimbatore for SEM facility. VSK acknowledges the facilities provided by CUTN, UGC for the start-up grant and DST-SERB for the Early Career Research grant (ECR/2015/000273). VP and RJ acknowledge the facilities and financial support offered by CUTN.Notes and references
- R. E. Cohen, Nature, 1992, 358, 136–138 CrossRef CAS.
- Y. A. Genenko, et al., Mater. Sci. Eng., B, 2015, 192, 52 CrossRef CAS.
- X. J. Lou and J. Wang, J. Appl. Phys., 2010, 108, 034104 CrossRef.
- Q. Zhang and R. W. Whatmore, Mater. Sci. Eng., B, 2004, 109, 136 CrossRef.
- J. S. Kang and Y. H. Joung, J. Mater. Sci., 2007, 42, 7899 CrossRef.
- T. Sreesattabud, B. J. Gibbons, A. Watcharapasorn and S. Jiansirisomboon, Ceram. Int., 2013, 39(1), S521–S524 CrossRef CAS.
- F. Rubio-Marcos, J. J. Romero, M. G. Navarro-Rojero and J. F. Fernandez, J. Eur. Ceram. Soc., 2009, 29, 3045–3052 CrossRef CAS.
- R. Hayati and A. Barzegar, Mater. Sci. Eng., B, 2010, 172, 121 CrossRef CAS.
- H. T. Li, et al., Curr. Appl. Phys., 2011, 11, S184 CrossRef.
- J. Wu, D. Xiao and J. Zhu, Chem. Rev., 2015, 115, 2559 CrossRef CAS.
- Y. Zhao, et al., J. Am. Ceram. Soc., 2011, 94, 656 CrossRef CAS.
- H. Takao, et al., J. Am. Ceram. Soc., 2006, 89, 1951 CrossRef CAS.
- Q. Yin, et al., J. Alloys Compd., 2010, 491, 340 CrossRef CAS.
- S.-H. Psrk, et al., Jpn. J. Appl. Phys., 2004, 43, L1072 CrossRef.
- S. L. Yang, et al., J. Am. Ceram. Soc., 2012, 95, 2110 CrossRef CAS.
- Y. G. Lv, et al., Mater. Res. Bull., 2009, 44, 284 CrossRef CAS.
- D. Lin, K. W. Kwok and H. L. W. Chan, Appl. Phys. A: Mater. Sci. Process., 2008, 91, 167 CrossRef CAS.
- M. Matsubara, et al., J. Am. Ceram. Soc., 2005, 88, 1190 CrossRef CAS.
- S.-H. Park, et al., Jpn. J. Appl. Phys., 2004, 43, L1072 CrossRef CAS.
- J. Tellier, B. Malic, B. Dkhil, D. Jenko, J. Cilensek and M. Kosec, Solid State Sci., 2009, 11(2), 320–324 CrossRef CAS.
- M. A. Rafiq, M. E. V. Costa and P. M. Vilarinho, Sci. Adv. Mater., 2014, 6(3), 426–433 CrossRef CAS.
- A. Kamal, M. A. Rafiq, M. N. Rafiq, M. Usman, M. Waqar and M. S. Anwar, Appl. Phys. A, 2016, 122, 1037 CrossRef.
- R. Z. Zuo, J. Rodel, R. Z. Chen and L. T. Li, J. Am. Ceram. Soc., 2006, 89(6), 2010–2015 CrossRef CAS.
- M. Promsawat, A. Watcharapasorn and S. Jiansirisomboon, Nanoscale Res. Lett., 2012, 7, 65 CrossRef.
- H. E. Mgbemere, M. Hinterstein and G. A. Schneider, J. Eur. Ceram. Soc., 2012, 32(16), 4341 CrossRef CAS.
- R. Rani, S. Sharma, R. Rai and A. L. Kholkin, Mater. Res. Bull., 2012, 47(2), 381 CrossRef CAS.
- Y. Shimojo, R. P. Wang, T. Sekiya and K. Matsuzaki, J. Korean Phys. Soc., 2005, 46(1), 48 CAS.
- L. A. Ramajo, et al., Mater. Res., 2014, 17, 728 CrossRef CAS.
- K. Imai, et al., J. Cryst. Growth, 1997, 177, 79 CrossRef CAS.
- A. Sawalha, M. Abu-Abdeen and A. Sedky, Phys. B, 2009, 404, 1316–1320 CrossRef CAS.
- J. F. Scott, Ferroelectric Memories, Springer, New York, 2000 Search PubMed.
- A. K. Tagantsev, I. Stolichnov, E. L. Colla and N. Setter, J. Appl. Phys., 2001, 90, 1387–1402 CrossRef CAS.
- X. J. Lou, J. Appl. Phys., 2009, 105, 024101 CrossRef.
- Z. X. Cheng, X. L. Wang and S. X. Dou, Appl. Phys. Lett., 2007, 90(1–3), 222902 CrossRef.
- L. Liu, H. Fan, L. Fang, X. Chen, H. Dammak and M. Pham Thi, Mater. Chem. Phys., 2009, 117, 138–141 CrossRef CAS.
- B. Tah, S. Goswami, T. Dasgupta, J. Bera, P. Sinha, D. Kundu, S. Sen and A. Sen, Ferroelectrics, 2015, 481, 119–125 CrossRef CAS.
- F. Scott, J. Phys. Chem. Solids, 1996, 57, 1439–1443 CrossRef.
- L. Jin, F. Li and S. Zhang, J. Am. Ceram. Soc., 2014, 97(1), 1–27 CrossRef CAS.
- M. Ehmke, J. Glaum, W. Jo, T. Granzow and J. RödelEhmke, et al., J. Am. Ceram. Soc., 2011, 94, 2473 CrossRef CAS.
- G. H. Haertling, J. Am. Ceram. Soc., 1999, 82, 797–818 CrossRef CAS.
- K. Okazaki and K. Nagata, J. Am. Ceram. Soc., 1973, 56, 82–86 CrossRef CAS.
- J. Zhang, Z. Pan, F. F. Guo, W. C. Liu, H. P. Ning, Y. B. Chen, M. H. Lu, B. Yang, J. Chen, S. T. Zhang, X. R. Xing, J. Rödel, W. Cao and Y. F. Chen, Nat. Commun., 2015, 6, 6615 CrossRef CAS.
- Z. Pan, J. Chen, L. Fan, J. Zhang, S. Zhang, Y. Huang, L. Liu, L. Fang and X. Xing, J. Am. Ceram. Soc., 2015, 98(12), 3935–3941 CrossRef CAS.
Footnote |
| † Electronic supplementary information (ESI) available. See DOI: 10.1039/c9ra06526a |
| This journal is © The Royal Society of Chemistry 2019 |

