DOI:
10.1039/C9RA06501F
(Paper)
RSC Adv., 2019,
9, 31447-31459
An ultrasound-assisted approach to bio-derived nanoporous carbons: disclosing a linear relationship between effective micropores and capacitance†
Received
19th August 2019
, Accepted 25th September 2019
First published on 3rd October 2019
Abstract
Ultrasound irradiation is a technique that can induce acoustic cavitation in liquids, leading to a highly interactive mixture of reactants. In pursuit of high-performance and cost-effective supercapacitor electrodes, pore size distributions of carbonaceous materials should be carefully designed. Herein, fruit skins (mango, pitaya and watermelon) are employed as carbon precursors to prepare nanoporous carbons by the ultrasound-assisted method. Large BET specific surface areas of the as-prepared carbons (2700–3000 m2 g−1) are reproducible with pore diameters being concentrated at about 0.8 nm. Among a suite of the bio-derived nanoporous carbons, one reaches a maximum specific capacitance of up to 493 F g−1 (at 0.5 A g−1 in 6 M KOH) in the three-electrode system and achieves high energy densities of 27.5 W h kg−1 (at 180 W kg−1 in 1 M Na2SO4) and 10.9 W h kg−1 (at 100 W kg−1 in 6 M KOH) in the two-electrode system. After 5000 continuous charge/discharge cycles, the capacitances maintain 108% in 1 M Na2SO4 and 98% in 6 M KOH, exhibiting long working stability. Moreover, such high capacitive performance can be attributed to the optimization of surface areas and pore volumes of the effective micropores (referred to as 0.7–2 nm sized pores). Notably, specific capacitances have been found linearly correlated with surface areas and pore volumes of the effective micropores rather than those of any other sized pore (i.e., <0.7, 2–50 and 0.5–50 nm). Consequently, the fit of electrolyte ions into micropore frameworks should be an important consideration for the rational design of nanopore structures in terms of supercapacitor electrodes.
Introduction
As an efficient energy storage device, supercapacitor has attracted broad attention due to its high power density, long cycling stability and fast charge/discharge capability.1 However, limited energy density in an aqueous electrolyte features the major disadvantage of supercapacitors.2–4 One crucial element of a supercapacitor is the property and performance of electrode materials, which, in general, significantly determine its overall capacitive behaviours. Porous carbons (PCs) lend themselves well to acting as supercapacitor electrodes, thanks to adjustable pore textural features, relatively low cost and less contamination of the environment.5 In the past decade, syntheses of PCs have been intensely investigated using richly varied carbon sources.6–9 Many studies have proved that biomass as a natural and sustainable matter is a promising precursor for green preparation of PCs.10–12 Commonly, there are several ways to create pore structures for pristine carbon: templates, and physical and chemical activation.13 Hard templates, such as SBA-15, MCM-41 and MCM-48, are typically used in the template method.14 Residual templates are usually removed by leaching or pyrolyzing mixtures of carbon precursors and template agents. Nevertheless, inevitable use of hazardous reagents often leads to environmental concerns. Physical activation is referred to as pyrolysis performed at high temperature under an atmosphere of specific gases, as exemplified by air, CO2 and water vapour.15 One of the advantages of physical activation lies in the ability to precisely regulate the porosity of materials, yet physical activation often exhibits poor pore-forming effectiveness, small specific surface area and long duration of production.15 As for chemical activation, various alkalis or acids were systematically studied, including KOH,16 ZnCl2,17 and H3PO4.18 Among plenty of chemical activating agents, KHCO3 is a mild and safe compound, unlike corrosive reagents such as KOH and ZnCl2. The micropore-forming capability of KHCO3 has been first proposed by Wang and co-workers;19,20 still, KHCO3 is very much in the minority as the chemical activators.
Overall, there exist a certain amount of heteroatoms (e.g. oxygen and nitrogen) in crude biomass.21 As is well known, the presence of heteroatoms in carbon materials can improve the surface wettability and generate pseudocapacitance.22,23 Nitrogen atoms in nitrogen-doped porous carbons (NPCs) can not only originate from biomass itself but also be extrinsically introduced by using different doping agents (e.g. urea,24 melamine,25 and ammonia gas26) and distinct doping approaches (e.g. hydrothermal treatment,27 ball-milling process,28 and pyrolysis29). However, nitrogen doping processes in reported literature are often tedious, involving harmful reagents like HNO3 and nitrogen-containing polymers,30 which may even exert negative influence on porosity of PCs.16 Ultrasonic homogenizers have been widely used in chemistry and biology researches. From Suslick's perspective on sonochemistry, ultrasound can induce acoustic cavitation in liquids, in which the formation, growth and implosive collapse of bubbles lead to a highly interactive mixture of reactants.31 Sonochemical processing can not only simplify the treatment of crude biomass but also provide a cost-effective and eco-friendly approach to synthesis of NPCs.32 Notwithstanding the above advantages, few works have hitherto dealt with ultrasound-assisted nitrogen doping.
In this study, NPCs were synthesized using mango skin (MS) as the carbon precursor, by a novel ultrasonic treatment with the nitrogen source melamine, followed by low-temperature pyrolysis and subsequent KHCO3 activation. By means of rational design, appropriate pore size distributions of the MS-derived NPCs have been achieved, thus contributing substantially to fine capacitive performance. Because electrochemical capabilities of bio-derived carbons are heavily determined by the difference in crude biomass employed,20,33,34 pitaya skin (PS) and watermelon skin (WS) are also utilized to prepare NPCs by the same synthetic method. High-performance capacitances of the obtained materials derived from PS and WS have further verified the universality of this approach. To the best of our knowledge, this is the first report on using mango and pitaya skins as the carbon precursors to make supercapacitor electrodes. More importantly, a linear correlation between the effective micropore (referred to as the 0.7–2 nm sized pore) and specific capacitance of carbonaceous material has been explored for the good of optimizing the power and energy of supercapacitors.
Experimental
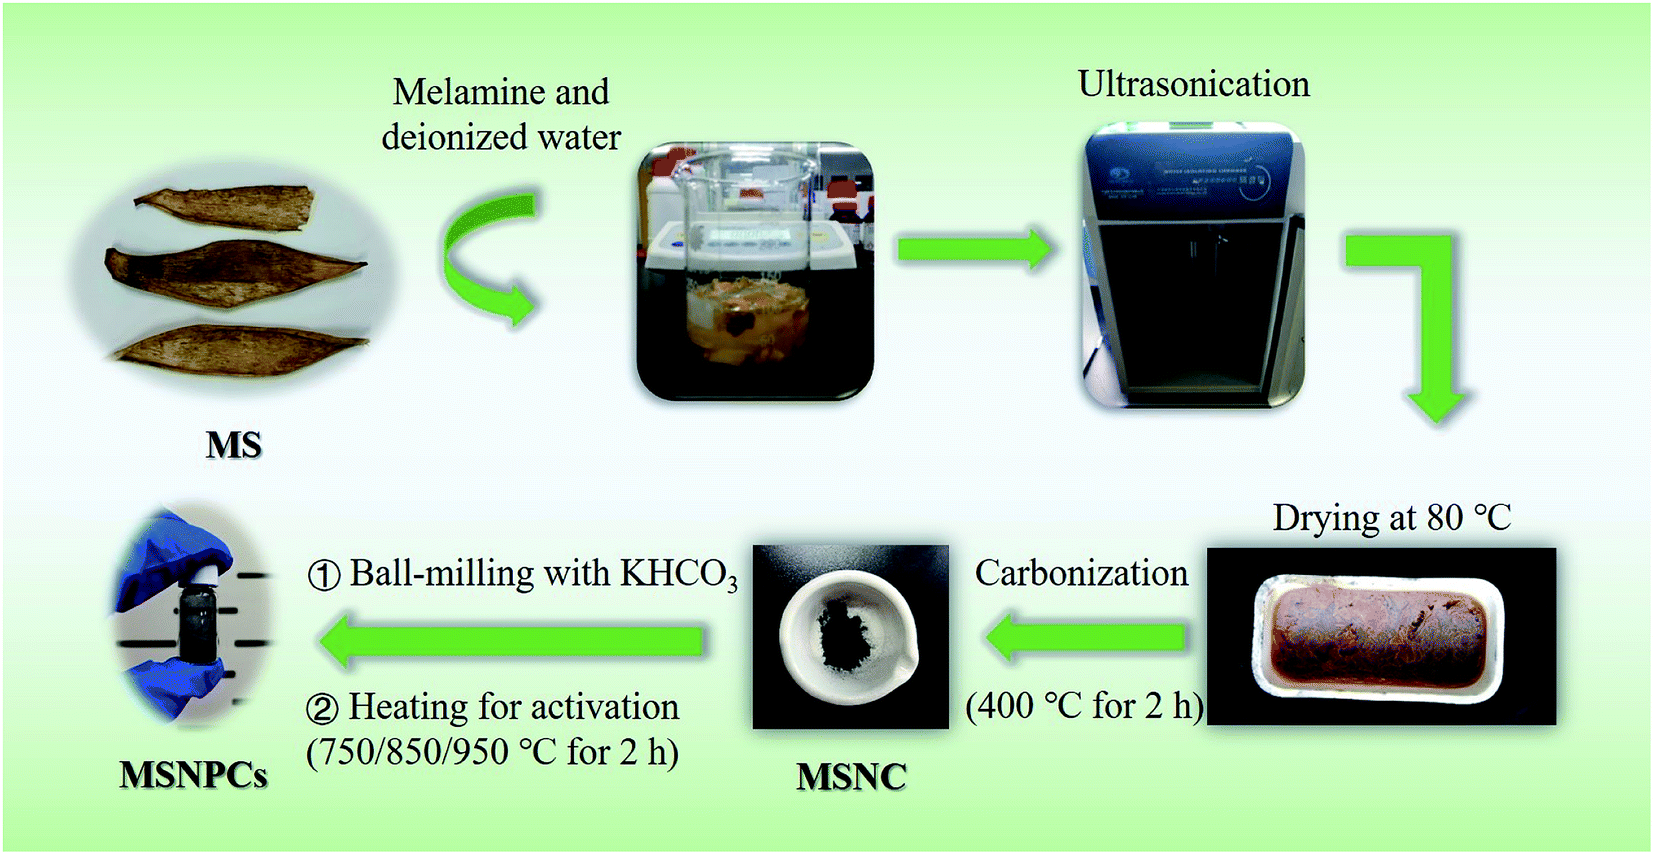
Syntheses of nitrogen-doped carbons derived from MS
MS was peeled from fresh mangoes purchased in a local market. After being washed with deionized water, MS was dried at 80 °C for 8 h and then crushed into small pieces. Typically, 3 g of the pretreated MS, 1 g of melamine and a certain amount of deionized water were added into a beaker. The mixture was irradiated with an ultrasonic probe under a power of 300 W for 15 min (2 s working interval). By means of the cavitation effect, ultrasonic irradiation is able to facilitate the integration and interaction of nitrogen sources and crude biomass during the preparation of a well-homogenized bimodal carbon/nitrogen precursor. The obtained paste-like mixture was transferred into a corundum crucible and then dried at 80 °C for 8 h in an oven. Subsequently, the dried paste in the crucible was carbonized at 400 °C for 2 h with a heating ramp rate of 2 °C min−1 under a continuously flowing nitrogen gas. The as-prepared nitrogen-containing carbon precursor is denoted by MSNC. As a control sample, the MS-derived nitrogen-containing carbon precursor made by magnetic stirring for 15 min instead of the above-mentioned ultrasonic processing is denoted by MSNC*.
Syntheses of NPCs derived from MS
In order to create abundant nanopores, 1 g of MSNC and 5 g of potassium bicarbonate were thoroughly mixed using a ball-milling machine with a rotation rate of 300 rpm for 30 min. After being transferred into a corundum crucible, the obtained mixture was then heated at 850 °C for 2 h with a ramp rate of 5 °C min−1. The product was washed using 1 M HCl for 2 h and then rinsed with deionized water until the filtrate became neutral. The final product was subsequently dried at 80 °C overnight and denoted by MSNPC-850. To examine the optimum activation effect, experiments at different heating temperatures (750 and 950 °C for 2 h) were also conducted, the respective products being denoted by MSNPC-750 and MSNPC-950. The NPCs derived from MS (i.e., MSNPC-850, MSNPC-750 and MSNPC-950) are designated as MSNPCs in some occasions. A schematic illustration of the preparation of MSNPCs was displayed in Scheme 1. To compare MSNPC-850 with the material made without the ultrasonic processing, MSNC* was used as the nitrogen-containing carbon precursor and the final product is denoted by MSNPC-850*. To compare MSNPCs to the material made without the nitrogen doping process, a given mass of MS was directly pyrolyzed at 400 °C for 2 h, obtaining the MS biochar, 1 g of which was then mixed with 5 g KHCO3 by the ball-milling process, followed by being activated at 850 °C for 2 h. The product was acid-treated using 1 M HCl and constantly rinsed with deionized water until the filtrate became neutral. The final product is denoted by MSPC-850.
 |
| | Scheme 1 Schematic illustration of the preparation of MSNPCs. | |
Syntheses of NPCs derived from PS and WS
To verify the universality of this synthetic method, PS and WS were peeled from fresh pitaya and watermelon respectively, followed by being dried at 80 °C. The NPCs derived from PS and WS have the same synthetic procedures as MSNPC-850. Typically, the first step was concerned with the preparation of bimodal carbon/nitrogen precursors using an ultrasound homogenizer followed by being carbonized at 400 °C for 2 h. After undergoing ball-milling processing with KHCO3, the obtained mixture was subsequently activated at 850 °C for 2 h. The black products were washed with 1 M HCl and rinsed with deionized water until the filtrate became neutral, followed by being dried at 80 °C. The final products derived from PS and WS are denoted by PSNPC-850 and WSNPC-850, respectively.
Characterizations
Pore textural properties were acquired using a Quantachrome Autosorb iQ by the N2 isothermal adsorption–desorption method at 77 K. Brunauer–Emmett–Teller (BET) specific surface areas were obtained from the multi-point BET-plot calculation provided by the ASiQwin software (version 5.2). Pore size distribution curves, together with pore volumes and surface areas of pores with size between 0.5–50 nm, were calculated by the quenched solid density functional theory (DFT) method. Energy disperse spectroscopy (EDS) analyses were obtained from an FEI Quanta 250 microscope. Transmission electron microscope (TEM) images were recorded on an FEI Tecnai G2 F20 field-emission microscope. X-ray diffraction (XRD) patterns were collected on a Bruker D8 ADVANCE diffractometer equipped with a CuKα radiation source (λ = 1.54178 Å). Raman spectroscopy analyses were acquired on a Bruker Senterra confocal Raman spectrometer (laser excitation wavelength: 532 nm). X-ray photoelectron spectroscopy (XPS) results were recorded on a Thermo Fisher ESCALAB 250Xi spectroscope excited by AlKα radiation (1486.6 eV).
Electrochemical measurements
Electrochemical tests were measured with an electrochemical workstation (IviumStat.h). In the three-electrode system, a platinum foil was used as a counter electrode and a Ag/AgCl electrode was used as a reference electrode. To prepare a working electrode, an as-made material, conductive graphite and 5 wt% Nafion were mixed with a weight ratio of 75![[thin space (1/6-em)]](https://www.rsc.org/images/entities/char_2009.gif) :20:5 in a centrifuge tube, followed by being homogenized in ethanol for 30 min and then dipped on a nickel foam. After being dried at 80 °C for 2 h, the nickel foam was pressed at 15 MPa and subsequently transferred in a vacuum oven for drying at 80 °C overnight. Mass of loaded active material of each electrode was about 2 mg. Cyclic voltammetry (CV) with scan rates varying from 5 to 100 mV s−1, galvanostatic charge/discharge (GCD) measurements with charging and discharging rates changing from 0.5 to 20 A g−1, and electrochemical impedance spectroscopy (EIS) with a sinusoidal amplitude of 5 mV over the frequency range from 10−2 to 105 Hz were undertaken at 25 °C kept by a circulating water bath.
:20:5 in a centrifuge tube, followed by being homogenized in ethanol for 30 min and then dipped on a nickel foam. After being dried at 80 °C for 2 h, the nickel foam was pressed at 15 MPa and subsequently transferred in a vacuum oven for drying at 80 °C overnight. Mass of loaded active material of each electrode was about 2 mg. Cyclic voltammetry (CV) with scan rates varying from 5 to 100 mV s−1, galvanostatic charge/discharge (GCD) measurements with charging and discharging rates changing from 0.5 to 20 A g−1, and electrochemical impedance spectroscopy (EIS) with a sinusoidal amplitude of 5 mV over the frequency range from 10−2 to 105 Hz were undertaken at 25 °C kept by a circulating water bath.
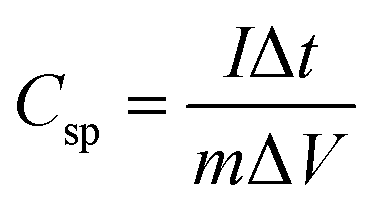
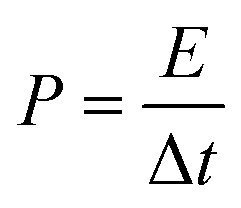
Specific capacitance of an electrode material was evaluated by the following equation:
| |  | (1) |
where
Csp is specific capacitance,
I is discharging current,
m is mass of active material, and Δ
t is discharging time in potential window of Δ
V.
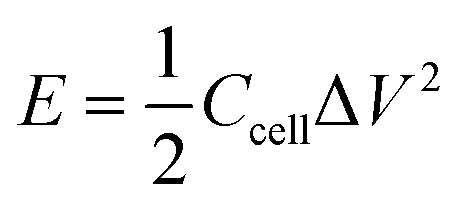
For the two-electrode system, energy density was calculated by the following equation:
| |  | (2) |
where Δ
V is voltage window, and
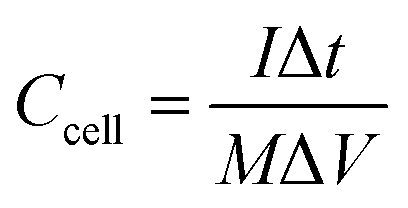
Ccell is cell specific capacitance, which is calculated by the following equation:
| |  | (3) |
where
I is discharging current,
M is total mass of active materials of a supercapacitor, and Δ
t is discharging time in a voltage window of Δ
V.
Power density was calculated by the following equation:
| |  | (4) |
Results and discussion
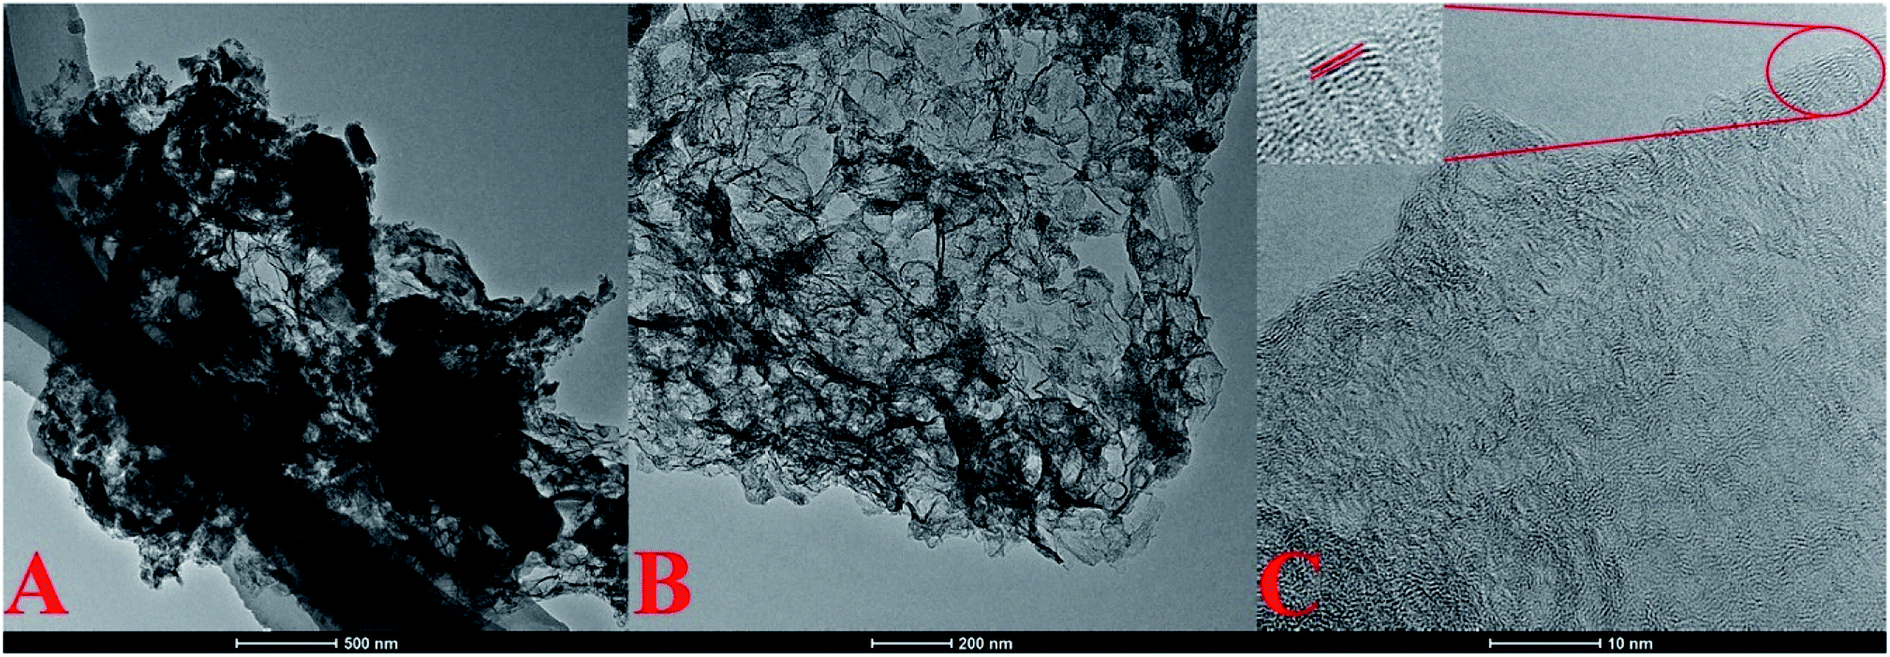
Fig. 1A and B show the TEM images of MSNPC-850 with different magnifications, exhibiting a gauze-like morphology with a fluffy, wrinkled nanostructure, potentially increasing the roughness and specific surface area of the material. Such merit could be attributed to the moderate activating force of KHCO3, as mentioned below. Fig. 1C shows the high-resolution TEM image of MSNPC-850. Amorphousness and nanopores feature prominently in MSNPC-850, associated with a limited degree of crystallization (Fig. 1C inset). The interplanar spacing of lattice fringes was measured to be 0.356 nm, assignable to the (002) plane of graphite.35
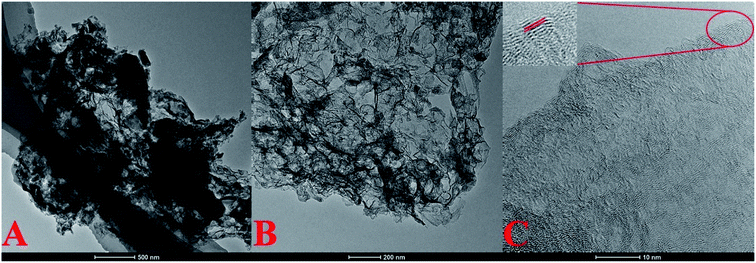 |
| | Fig. 1 (A and B) TEM images with different magnifications, (C) high-resolution TEM image (inset: the magnified region showing clear lattice fringes) of MSNPC-850. | |
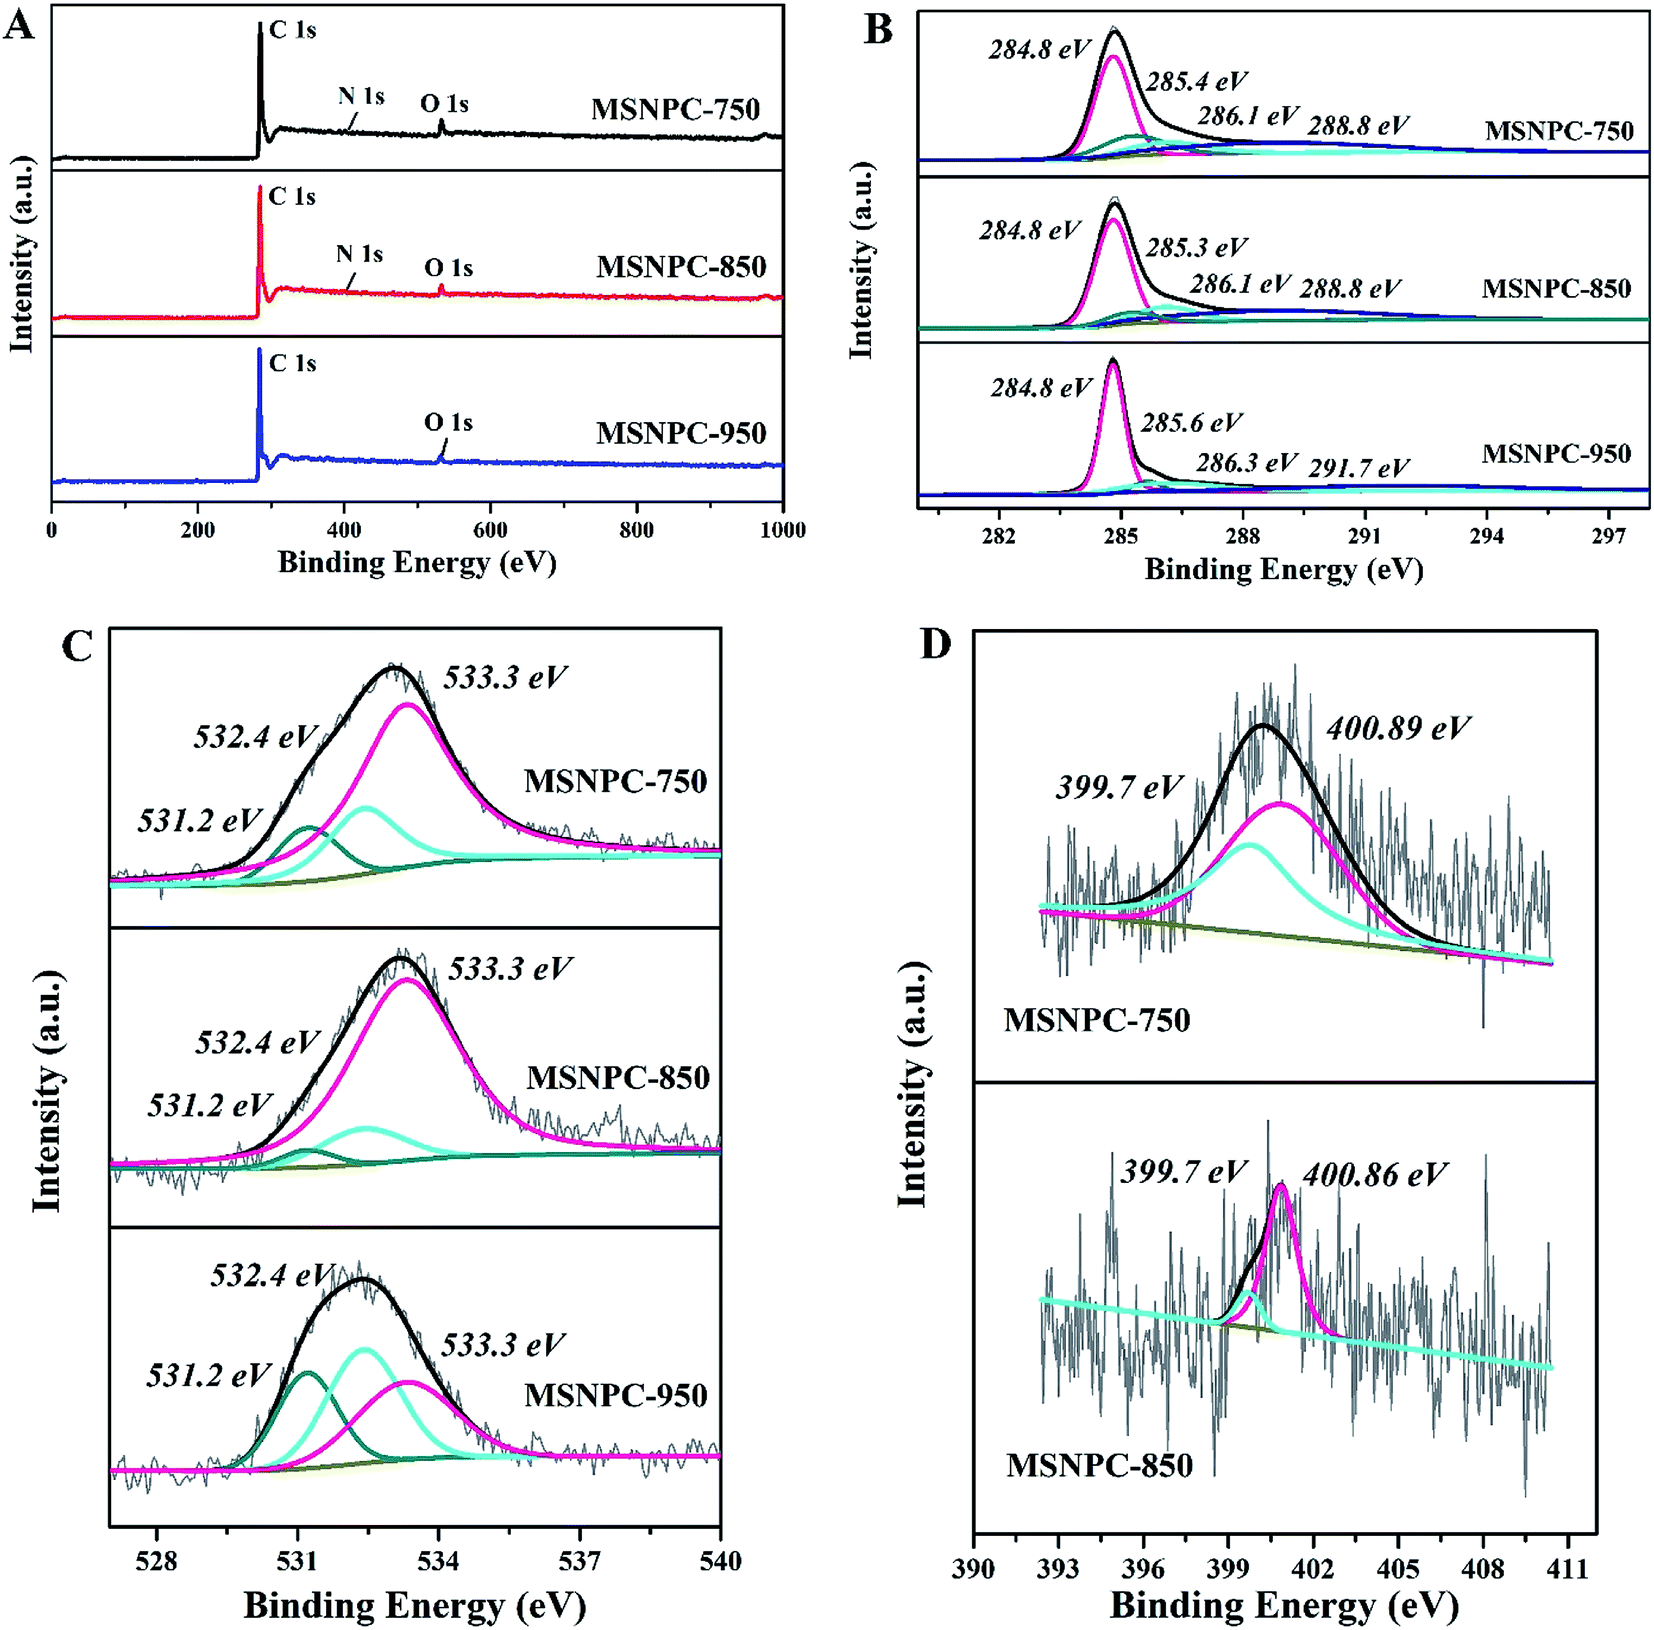
XPS is used to uncover the surface element species and chemical states of MSNPCs. The wide-scan spectra (Fig. 2A) show the oxygen content of MSNPC-850 is 4.15 at% and that the nitrogen is 1.29 at%. Due to the absence of nitrogen species in MS as demonstrated by the EDS results (Fig. S1†), the nitrogen species could only result from the addition of melamine, indicating that the ultrasound-assisted doping treatment is truly effective. Moreover, with the increase in activation temperature, the surface oxygen and nitrogen concentrations manifest a tendency of decline (oxygen: 6.11 at% of MSNPC-750 and 3.71 at% of MSNPC-950; nitrogen: 1.50 at% of MSNPC-750 and the undetectable level of MSNPC-950). Furthermore, the decomposition of C1s spectra of MSNPCs (Fig. 2B) are C–C (284.8 eV), C–N/C![[double bond, length as m-dash]](https://www.rsc.org/images/entities/char_e001.gif) N/CO (285.3–285.6 eV), C–OH (286.1 eV) and –COOH (288.8 eV).36 As seen from Fig. 2C, the O1s spectra of MSNPCs can be assigned to the following three peaks: O1 (531.2 eV), O2 (532.4 eV) and O3 (533.3 eV), representing CO, C–OOH and C–OH, respectively.27,37,38 The contribution of the O3 peak shows a maximum proportion in the O1s spectrum of MSNPC-850. More hydroxyl groups (related to O3) could produce more hydrogen bonds in the electrolyte–electrode interface, possibly resulting in better wettability.39 Reasonably, MSNPC-950 exhibits an obvious loss of C–OH at the higher activation temperature, which is consistent with the C1s spectra (Fig. 2B). The N1s spectrum of MSNPC-850 (Fig. 2D, lower) presents two nitrogen species: pyrrolic nitrogen (N5, 399.7 eV) and quaternary nitrogen (NQ, 400.9 eV).40 The abundant O and N species provide great advantages for MSNPC-850: (1) NQ atoms in the carbon matrix can enhance the electronic conductivity of the material;41 (2) hydrophilic oxygen- and nitrogen-containing functional groups can reduce the contact angle of the electrolyte–electrode interface, further capable of improving the surface wettability of the material;39,42 (3) oxygen- and nitrogen-containing species can also provide the faradaic pseudocapacitance for the material.22,43
N/CO (285.3–285.6 eV), C–OH (286.1 eV) and –COOH (288.8 eV).36 As seen from Fig. 2C, the O1s spectra of MSNPCs can be assigned to the following three peaks: O1 (531.2 eV), O2 (532.4 eV) and O3 (533.3 eV), representing CO, C–OOH and C–OH, respectively.27,37,38 The contribution of the O3 peak shows a maximum proportion in the O1s spectrum of MSNPC-850. More hydroxyl groups (related to O3) could produce more hydrogen bonds in the electrolyte–electrode interface, possibly resulting in better wettability.39 Reasonably, MSNPC-950 exhibits an obvious loss of C–OH at the higher activation temperature, which is consistent with the C1s spectra (Fig. 2B). The N1s spectrum of MSNPC-850 (Fig. 2D, lower) presents two nitrogen species: pyrrolic nitrogen (N5, 399.7 eV) and quaternary nitrogen (NQ, 400.9 eV).40 The abundant O and N species provide great advantages for MSNPC-850: (1) NQ atoms in the carbon matrix can enhance the electronic conductivity of the material;41 (2) hydrophilic oxygen- and nitrogen-containing functional groups can reduce the contact angle of the electrolyte–electrode interface, further capable of improving the surface wettability of the material;39,42 (3) oxygen- and nitrogen-containing species can also provide the faradaic pseudocapacitance for the material.22,43
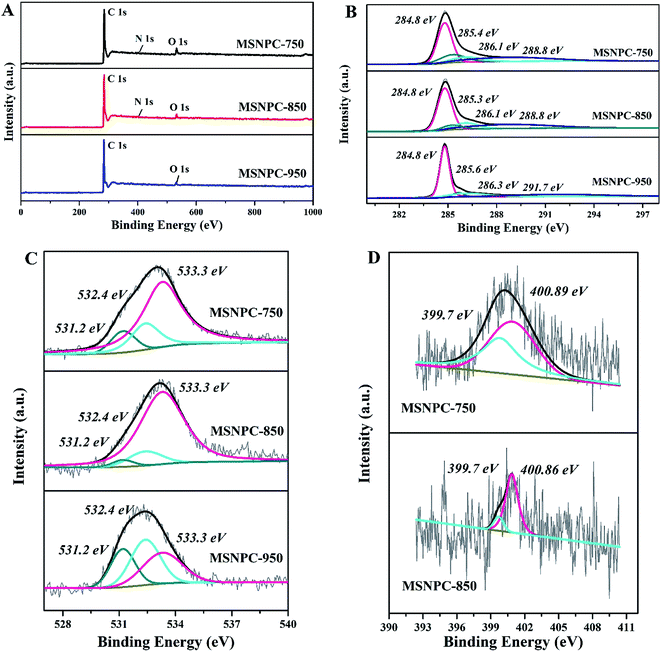 |
| | Fig. 2 XPS results of MSNPCs: (A) wide-scan spectra, (B) C1s spectra, (C) O1s spectra, (D) N1s spectra. | |
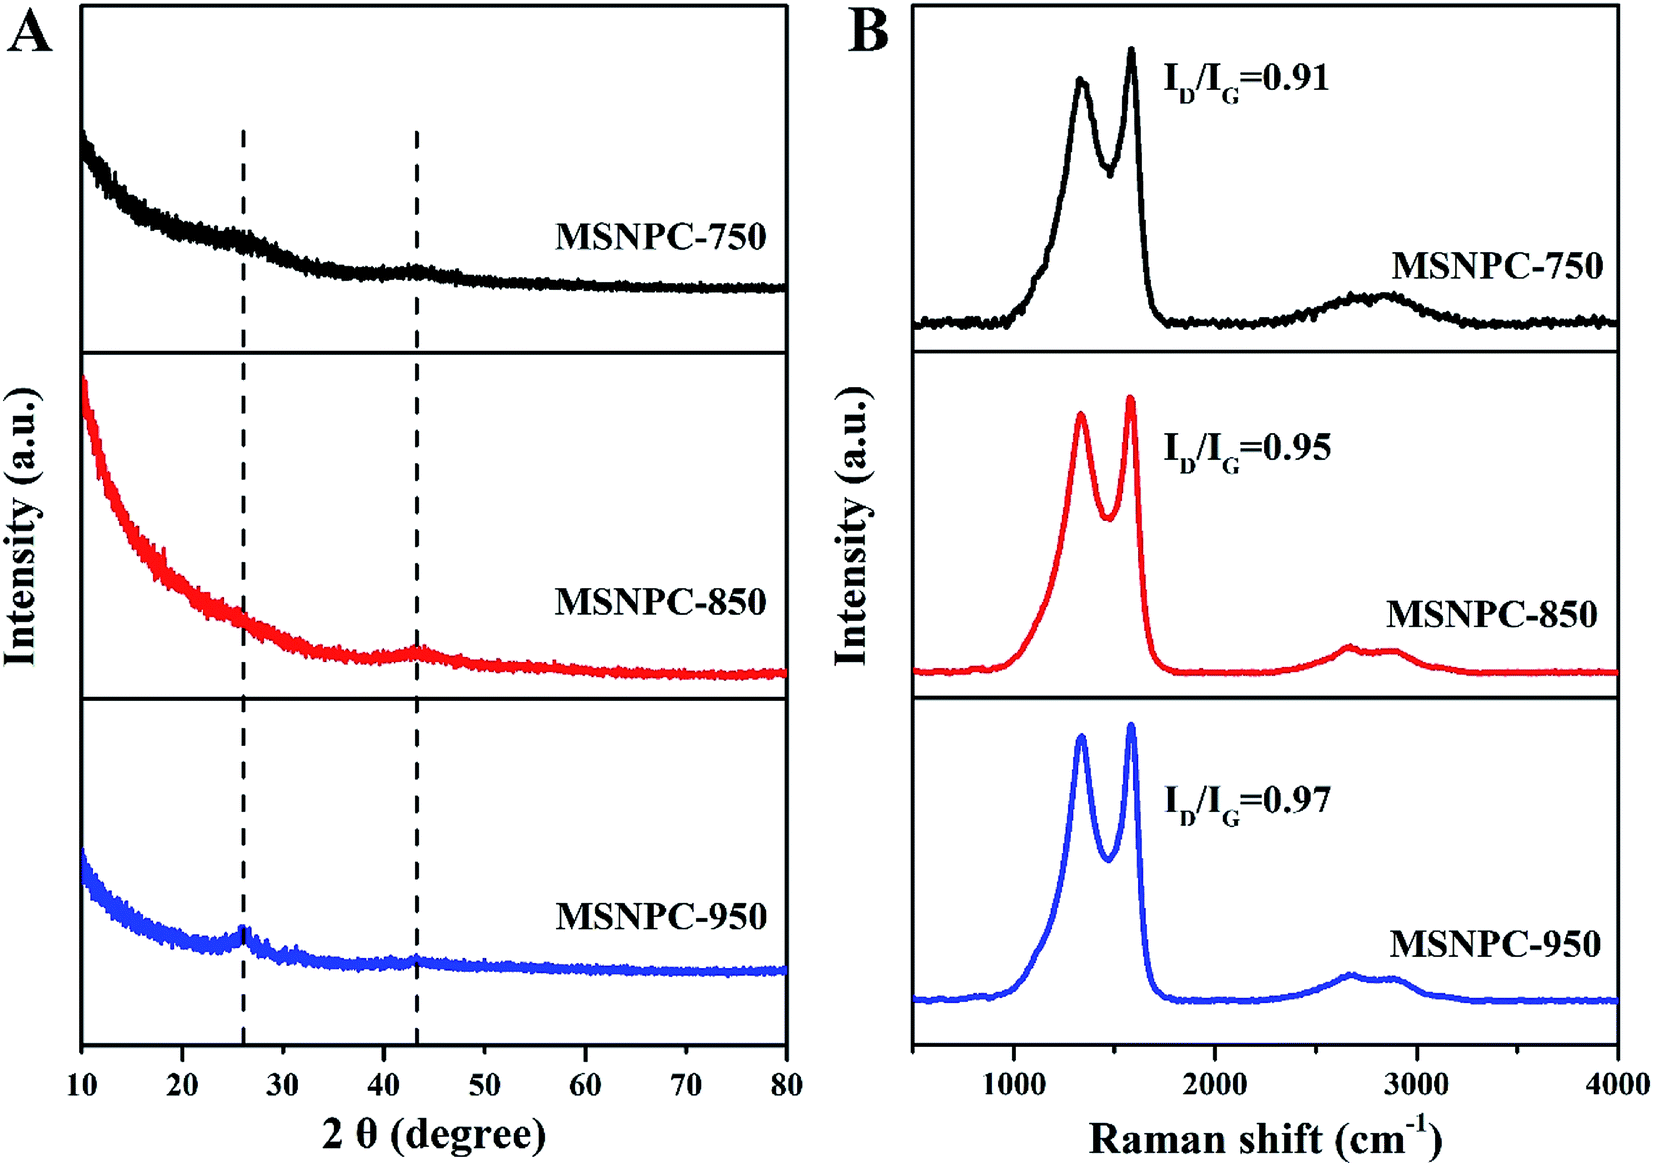
XRD patterns of MSNPCs, as shown in Fig. 3A, show weak diffraction intensities, implying the predominance of amorphous structures,44,45 in accordance with the high-resolution TEM observation. Further, the broad diffraction peaks of MSNPCs at 26° and 43° can be assigned to the reflections of (002) and (100) carbon, respectively.46 The (002) peak represents the graphitic stacking originating from randomly oriented aromatic carbon whereas the (100) peak should be attributed to the interlayer of a limited degree of graphitization,46 also agreeing with what is observed in the high-resolution TEM image. In the small diffraction-angle range, the curve of MSNPC-850 presents an evidently upward shape and even covers the (002) peak at 26°, implying the presence of abundant micropores.47 Raman spectra of MSNPCs are displayed in Fig. 3B: the two obvious peaks at 1334 cm−1 (the D band) and 1583 cm−1 (the G band) exist. The D band is relevant to sp3 carbon, representing a disorder degree of a material, whereas the G band is related to sp2 planar carbon, reflecting a degree of graphitization.48 The calculated ID/IG values (intensity ratios of the D to G bands) of MSNPC-750, MSNPC-850 and MSNPC-950 are 0.91, 0.95 and 0.97, respectively. The low ID/IG value of MSNPC-750 (0.91) is due to the relatively low activation temperature (750 °C) whereas the high ID/IG value of MSNPC-950 (0.97) can be ascribed to over-etching at the excessively high temperature (950 °C), giving the more disordered structure of MSNPC-950. MSNPC-850 shows a moderate ID/IG value (0.95), which reveals that MSNPC-850 contains suitable defect structures with some degree of graphitization. Further, two small peaks at 2660 cm−1 (the 2D band) and 2895 cm−1 (the G + D band) are also observed in Fig. 3B. The 2D band is formed by the two phonon process activated by double resonance, whereas the G + D band is ascribed to the combination of phonons with different momentum around the Γ and K points.46 Such features verify the existence of disordered structures that arise as a result of nanopores and heteroatoms in MSNPC-850.
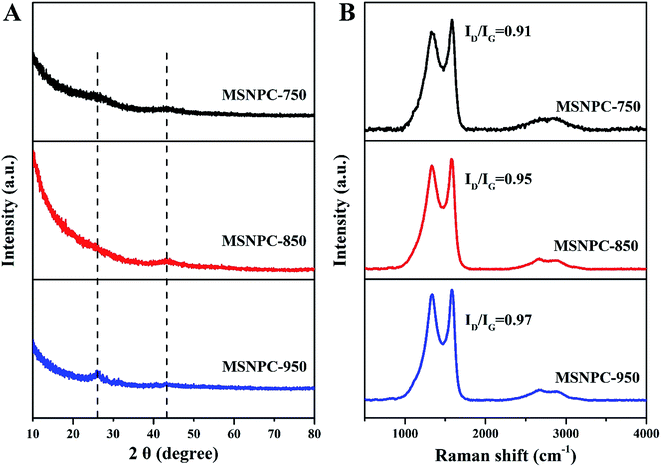 |
| | Fig. 3 (A) XRD patterns and (B) Raman spectra of MSNPCs. | |
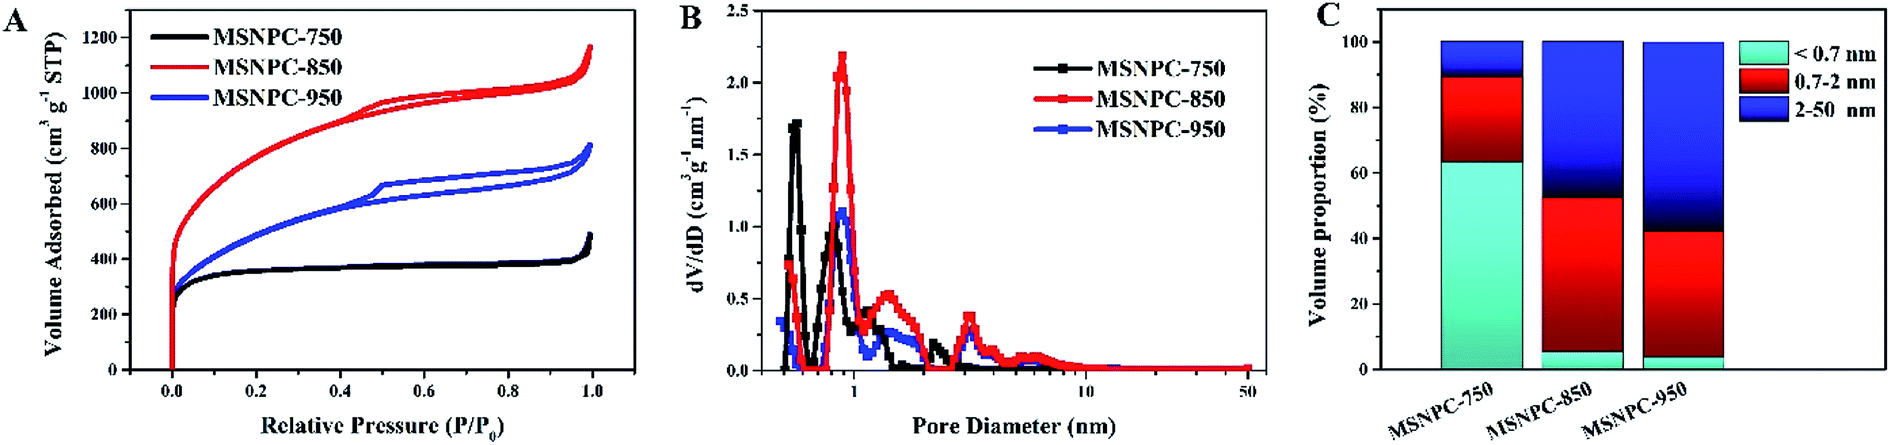
The N2 adsorption–desorption isotherms of MSNPCs are shown in Fig. 4A. MSNPC-750, MSNPC-850 and MSNPC-950 display the Type I/II adsorption–desorption isotherms: when the relative pressure (P/P0) is below 0.01, the N2 uptakes of MSNPCs vary sharply, inferring the presence of a large number of micropores,19 agreeing with the XRD results. In addition, the hysteresis loops in the 0.50–0.99 relative pressure region indicate the existence of mesopores, and the tail in the high relative pressure region (close to 1.0) denotes the existence of macropores.49 The pore size distribution curves calculated by the DFT method are displayed in Fig. 4B. MSNPCs manifest three main distribution ranges: 0.5–0.7, 0.7–2 and 2–7 nm, confirming the predominance of micropores along with a certain quantity of mesopores. The pore textural features of MSNPCs are listed in Table 1. Clearly, with the change of activation temperature, the peaks in the micropore region show the regular shifts: the micropore volume and surface area of MSNPC-750 are larger than those of both MSNPC-850 and MSNPC-950 within pore diameters of <0.7 nm but smaller within pore diameters of 0.7–2 nm; moreover, MSNPC-850 exhibits the highest peak centred at the micropore diameter of around 0.8 nm among the MSNPCs, inferring that MSNPC-850 owns the most 0.7–2 nm sized micropores. Fig. 4C represents the volume proportions of each pore size segment of MSNPCs. It can be observed that the 0.7–2 nm sized pores of MSNPC-850 possess a maximum volume proportion of 47.2%. In addition, MSNPC-950 has the less volume proportion of the 0.7–2 nm sized pores (38.4%) and yet the more volume proportion of mesopores (57.8%) than MSNPC-850, whereas MSNPC-750 owns a minimum volume proportion of the 0.7–2 nm sized pores (26.3%). The inadequate pore development of MSNPC-750 and the over-activation of MSNPC-950 have caused a shrinkage of micropores with diameter of 0.7–2 nm. MSNPC-750 exhibits a minimum BET surface area of 1366 m2 g−1, implying that the activation temperature of 750 °C is insufficient to create adequate nanopores. In effect, when KHCO3 is employed for the chemical activation, the reactions can be as follows:50
| 2KHCO3 → K2CO3 + H2O + CO2T < 200 °C, |
| K2CO3 + 2C → K2O + 3CO T > 700 °C. |
When the activation temperature increases up to 850 °C, K
2CO
3 slowly decomposes to K
2O and CO
2, the latter of which could further activate carbonaceous materials:
50| K2CO3 → K2O + CO2T = 850 °C. |
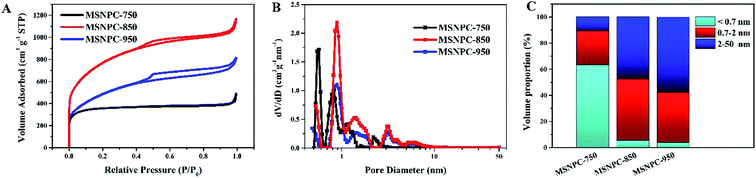 |
| | Fig. 4 (A) N2 adsorption–desorption isotherms, (B) pore size distributions calculated by the DFT method, and (C) volume-proportion histograms of each pore size segment (<0.7, 0.7–2 and 2–50 nm) of MSNPCs. | |
Table 1 Pore textural properties of MSNPCs, WSNPC-850 and PSNPC-850a
| Sample |
t-Plot method |
![[D with combining macron]](https://www.rsc.org/images/entities/i_char_0044_0304.gif) nm nm |
DFT method |
|
S
BET m2 g−1 |
S
micro m2 g−1 |
V
micro cm3 g−1 |
V
t cm3 g−1 |
V
1/S1 (<0.7 nm) cm3 g−1/m2 g−1 |
V
2/S2 (0.7–2 nm) cm3 g−1/m2 g−1 |
V
3/S3 (2–50 nm) cm3 g−1/m2 g−1 |
|
S
BET: BET specific surface area; Smicro: micropore specific surface area; Vmicro: micropore volume; Vt: total pore volume; : average pore diameter; V1/S1: the ratio of volume to surface area of micropores with diameter <0.7 nm; V2/S2: the ratio of volume to surface area of micropores with diameter between 0.7 and 2 nm; V3/S3: the ratio of volume to surface area of mesopores (diameter: 2–50 nm).
|
| MSNPC-750 |
1366 |
1267 |
0.514 |
0.759 |
2.22 |
0.133/463 |
0.315/672 |
0.126/155 |
| MSNPC-850 |
2796 |
1600 |
0.691 |
1.806 |
2.58 |
0.0793/315 |
0.718/1300 |
0.722/678 |
| MSNPC-950 |
1757 |
705 |
0.303 |
1.263 |
2.87 |
0.0397/167 |
0.407/747 |
0.612/536 |
| WSNPC-850 |
2720 |
1491 |
0.614 |
1.639 |
2.41 |
0.118/479 |
0.634/1214 |
0.598/636 |
| PSNPC-850 |
2990 |
1246 |
0.545 |
2.25 |
3.03 |
0.0723/304 |
0.689/1234 |
1.120/944 |
As listed in Table 1, MSNPC-850 exhibits the largest BET specific surface area of 2796 m2 g−1 among MSNPCs and the optimized pore size distribution is dominated by the 0.7–2 nm sized micropores and mesopores (Fig. 4B). Such a large surface area stems from at least three factors: (1) the moderate activation ability of KHCO3 at 850 °C as demonstrated above; (2) the molecular-level activation induced by the alkali and alkaline earth metals potassium, calcium and magnesium that intrinsically exist in the biomass, which has been identified by the EDS results (Fig. S1†), as a result acting as an in situ biotemplate;32 (3) the sonochemistry-assisted bimodal (nitrogen/carbon) constitution of the precursor MSNC.51 With regard to supercapacitor electrode materials, large specific surface areas that are favourable for the formation of large electrochemical double-layer capacitance (EDLC) are to a great extent provided by abundant micropores whereas the meso/macropore structure is able to facilitate the mass transport of electrolyte ions.11 The average pore size of MSNPC-950 shows a higher value of 2.87 nm than that of MSNPC-750 or MSNPC-850, but MSNPC-950 only exhibits a total surface area of 1757 m2 g−1. By comparison with MSNPC-850, the 0.7–2 nm sized pore volume of MSNPC-950 is reduced from 0.718 to 0.407 cm3 g−1 and the surface area of MSNPC-950 within pore diameter of 0.7–2 nm decreases from 1300 to 747 m2 g−1, indicating the loss of effective micropores,28,52,53 referred to as the 0.7–2 nm sized pores, which are based upon the consideration of the relative sizes of pore channels and hydrated electrolyte ions. Herein, 0.7 nm is selected as the critical size because of the hydrated radii of K+ cations (3.31 Å) and OH− anions (3.00 Å).54,55 It is evident that the unfavourable pore size can limit transportation and adsorption of the solvated ions.56,57 It can be predicted that the order of specific capacitance of MSNPCs in KOH should be MSNPC-850 > MSNPC-950 > MSNPC-750, the same order of their corresponding effective micropore volume and surface area, as confirmed below.
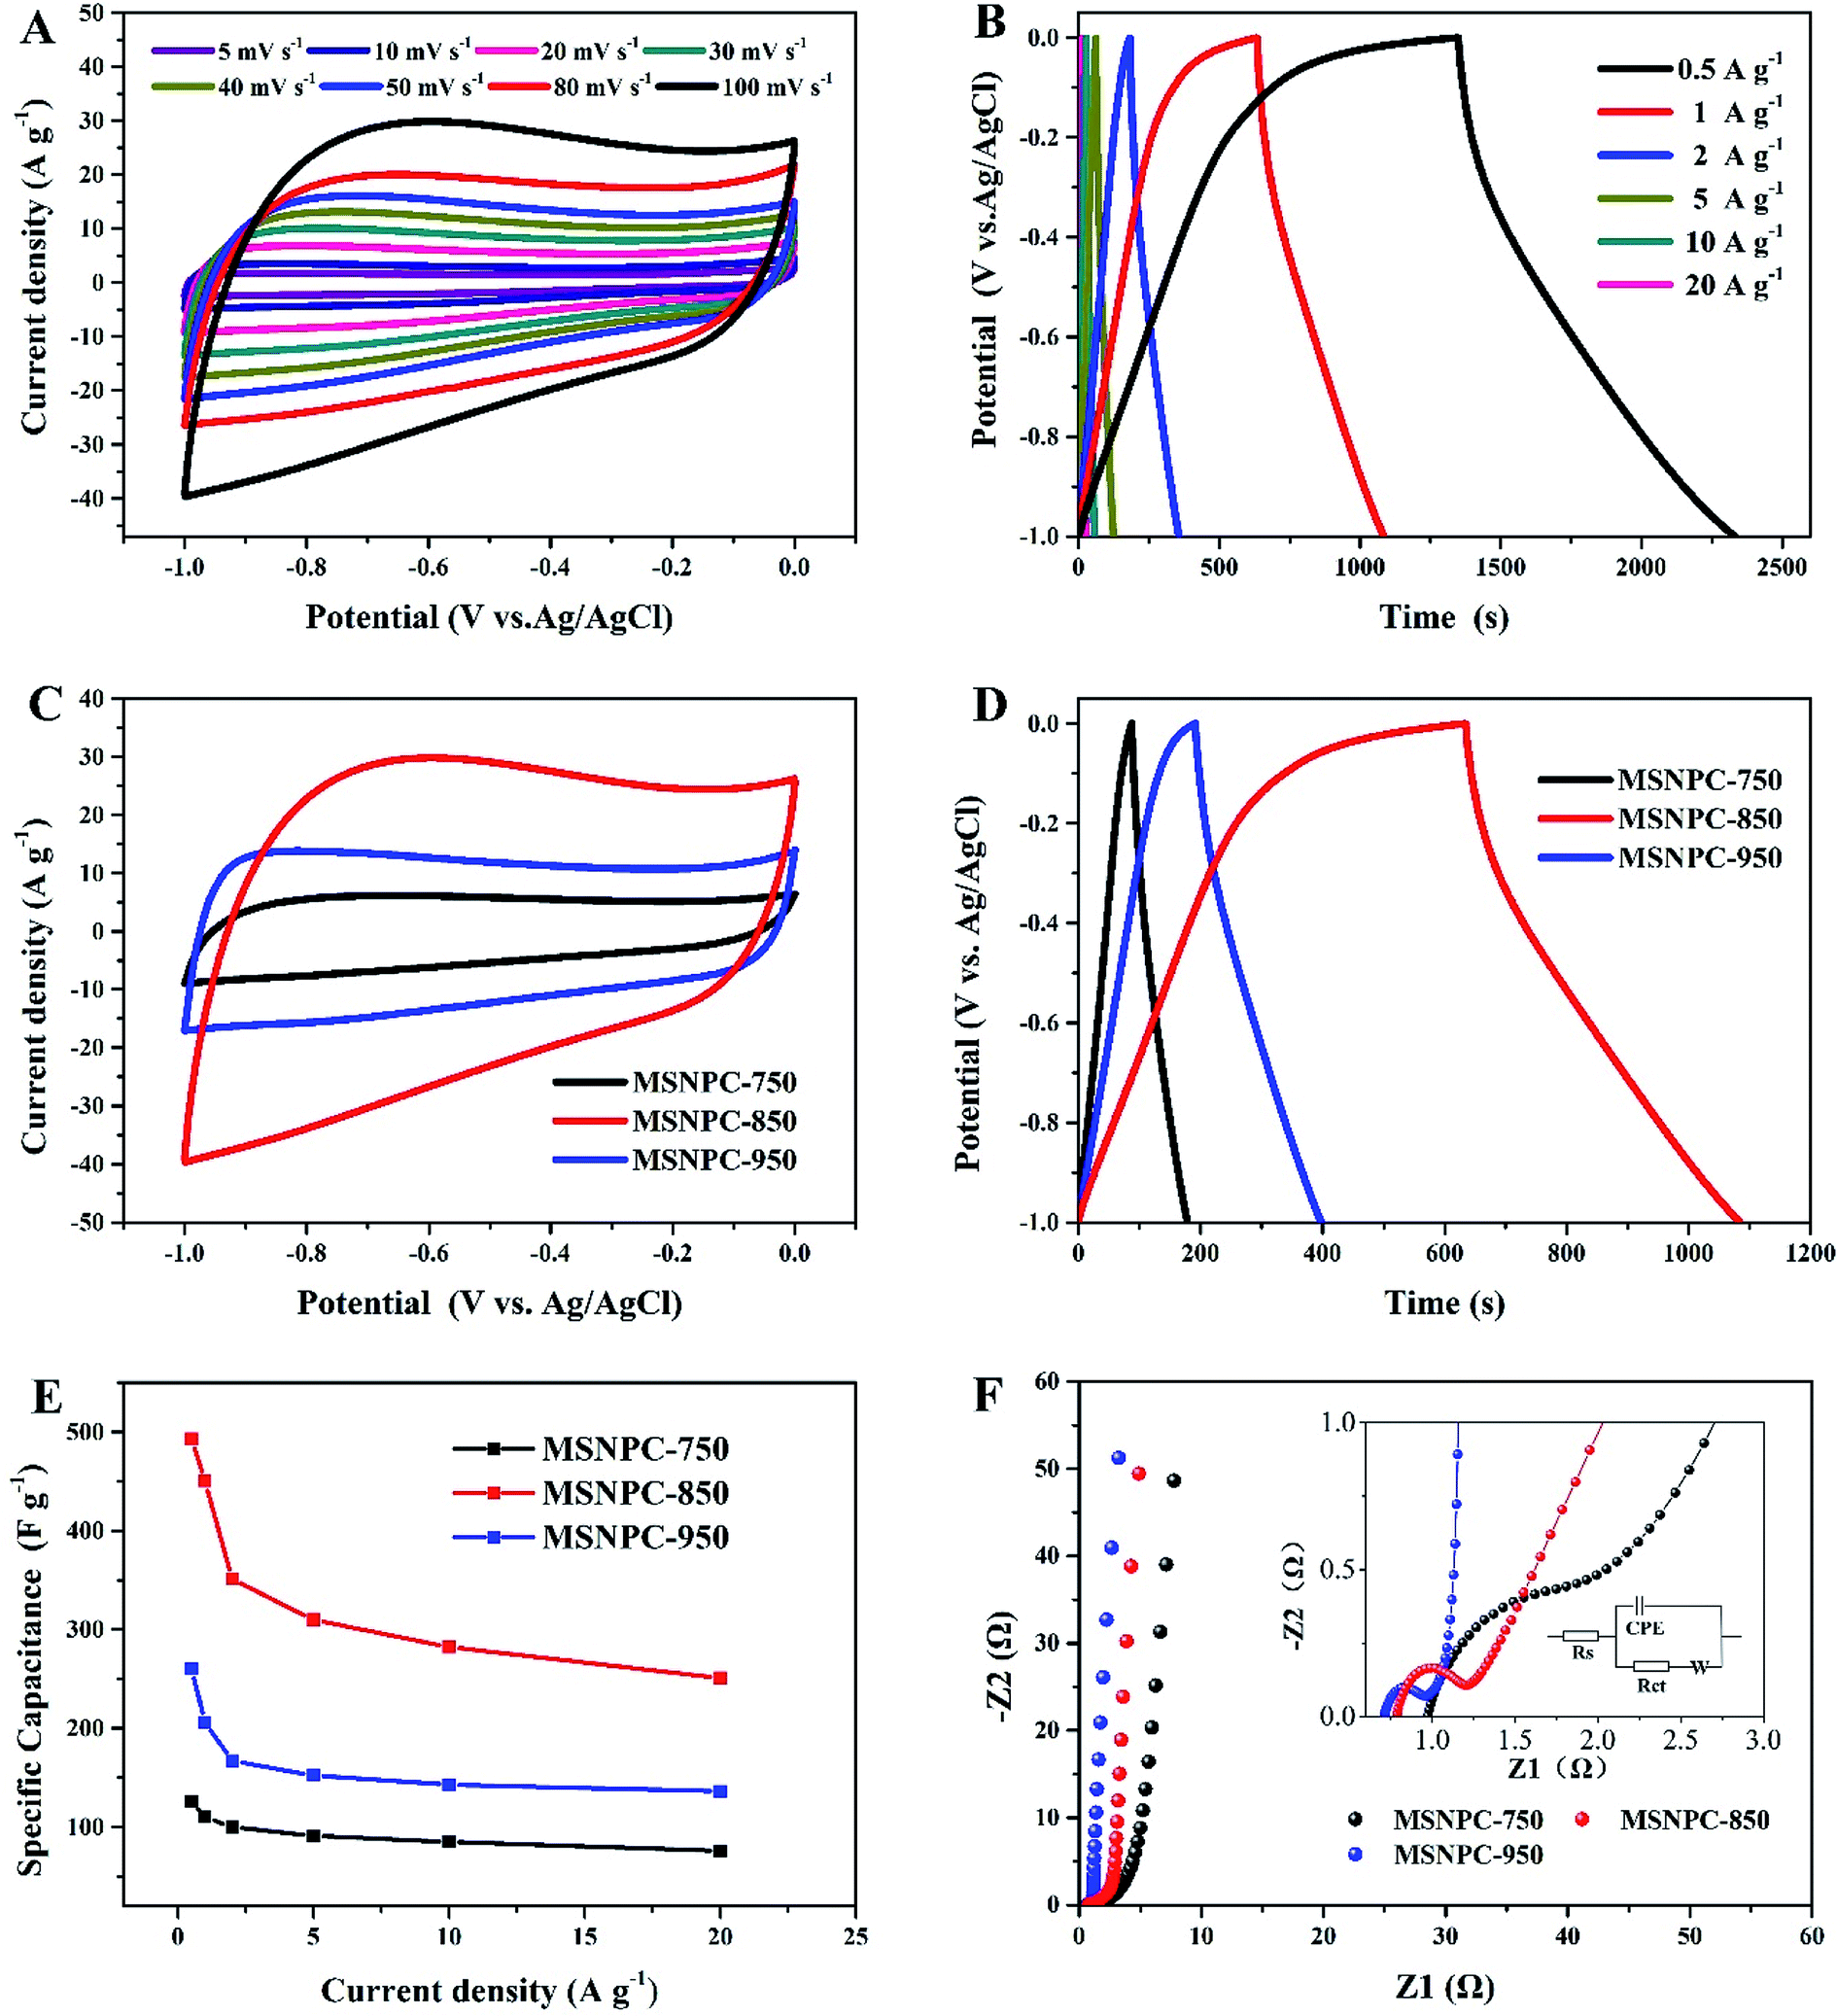
Fig. 5 displays the electrochemical characteristics of MSNPCs in 6 M KOH. As seen from Fig. 5A, all the CV curves of MSNPC-850 exhibit quasi-rectangular shapes, indicative of good EDLC behaviour of MSNPCs. In the meantime, the CV curve capable of retaining a quasi-rectangular shape with only a limited distortion could be observed even at a high scan rate of 100 mV s−1, due largely to the low intrinsic resistance and fast ion diffusion kinetics of the electrolyte. It is worth mentioning that in Fig. 5A there is the presence of hump-shape broad peaks around the potential range of −0.7 to −0.2 V in the CV curves, implying that there is a faradaic current contribution, which possibly originates from heteroatoms-induced redox reactions occurring on the interface between the electrode and the electrolyte.58 Further, the proportions of EDLC and pseudocapacitance contributions can be calculated by the following equation:59
where
i is current value measured in a CV circle,
v is scan rate,
a and
b are coefficients. The left part of the equation represents the faradaic current, while the right part corresponds to the EDLC contribution. The equation can be converted as follows:
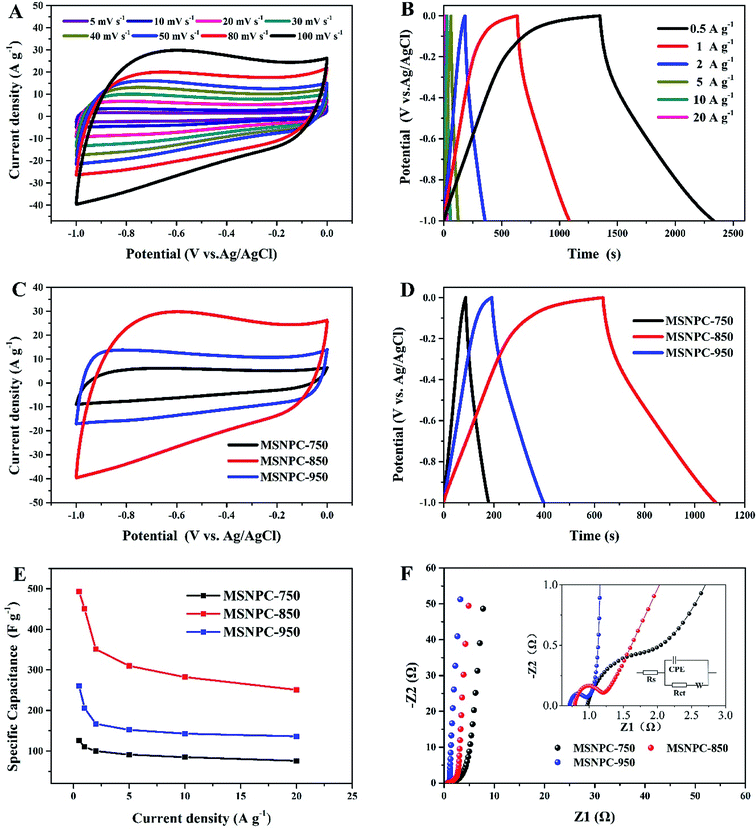 |
| | Fig. 5 Electrochemical performance of MSNPCs in 6 M KOH: (A) CV curves of MSNPC-850 at scan rates ranging from 5 to 100 mV s−1, (B) GCD curves of MSNPC-850 at current densities ranging from 0.5 to 20 A g−1, (C) CV curves of MSNPCs at a scan rate of 100 mV s−1, (D) GCD curves of MSNPCs at a current density at 1 A g−1, (E) rate performance of MSNPCs, (F) Nyquist plots of MSNPCs in the EIS measurement. | |
Fig. S2† demonstrates the EDLC and pseudocapacitance contributions of MSNC-850 and MSNPC-850. Proportions of 83% EDLC in MSPC-850 and 71% in MSNPC-850 further substantiate that there indeed exists pseudocapacitance, apart from the predominant EDLC, in the raised capacitance level. The higher pseudocapacitive proportion of MSNPC-850 should be attributable to the introduction of nitrogen species on the surface of the material.60 As for the specific capacitance evaluation (Fig. 5B), all the GCD curves of MSNPC-850 show quasi-symmetric patterns, indicating good coulombic efficiency and electrochemical reversibility. The specific capacitance exhibits a high performance of 493 F g−1 at a current density of 0.5 A g−1, which has achieved a state-of-the-art level compared with recent results (Table S1†). At the other current densities, the specific capacitance values of MSNPC-850 were calculated to be 450, 351, 310, 282 and 251 F g−1 at the current densities of 1, 2, 5, 10 and 20 A g−1, respectively. Further, to substantiate that ultrasonic irradiation has indeed enhanced the electrochemical performance of the material, the capacitive measurements of MSNPC-850* (dispensing with the ultrasonic treatment) were performed in the three-electrode system, as shown in Fig. S3.† The specific capacitance values of MSNPC-850* were calculated to be 360, 292, 264, 229, 200 and 164 F g−1 at the current densities of 0.5, 1, 2, 5, 10 and 20 A g−1, respectively. By comparison, the specific capacitances of MSNPC-850* are nearly 70% of those of MSNPC-850 on average. In other words, ultrasonic irradiation supplies the extra 30% of capacitances to the material.
As shown in Fig. 5C, the CV curve of MSNPC-750 at 100 mV s−1 presents a thin quasi-rectangular shape, which is attributable to the poor pore development of the material. MSNPC-950, with the highest mesopore proportion (57.8%) in MSNPCs, possesses a quasi-rectangular CV shape with an obviously less distorted outline than MSNPC-850, because the existence of more mesopores in MSNPC-950 facilitates the ion transport within the pore framework and thus lower the ohmic resistance,11 leading to an improved rectangular CV shape. As shown in Fig. 5D and E, however, the specific capacitance of MSNPC-750 (126 F g−1 at 0.5 A g−1) or MSNPC-950 (260 F g−1 at 0.5 A g−1) shows a marked drop compared to that of MSNPC-850 (493 F g−1 at 0.5 A g−1), attributed to the relatively small effective micropore volumes and surface areas of MSNPC-750 and MSNPC-950. The specific capacitance values of MSNPCs at different current densities are listed in Table S2.† Consequently, MSNPC-750 and MSNPC-950 are not preferable candidates in search of fine supercapacitor electrodes. Fig. 5F shows the Nyquist plots of MSNPCs. In the low-frequency region, each straight line of MSNPCs shows a steep slope, indicative of a good capacitive behaviour. In the high-frequency region (magnified in Fig. 5F inset), MSNPC-950 shows the smallest semi-circle, indicating its lowest charge-transfer resistance (Rct); on the contrary, MSNPC-750 displays a large arc, showing a poor ionic transport ability of this material.61 The equivalent circuit is shown in the inset of Fig. 5F, with the corresponding fit results being displayed in Table S3.† As it is defined, Rct represents the charge-transport ability on the electrolyte–electrode interface.33 The Rct value of MSNPC-850 is 0.335 Ω, which is between that of MSNPC-750 (1.017 Ω) and of MSNPC-950 (0.220 Ω), due in part to the moderate mesopore proportion as mentioned above.
To further verify the universality of this synthetic method for NPCs, PS and WS were employed as the biomass precursors. The physisorption measurement results of PSNPC-850 and WSNPC-850 are shown in Fig. S4† and Table 1. In Fig. S4A and B,† the isotherms and the pore size distribution curves of the NPCs derived from different biomass precursors are compared. All the materials made by this method manifest analogous isotherms and pore size distributions with one another, particularly each possessing a prominent pore peak centred at ∼0.80 nm (Fig. S4B†), demonstrating this ultrasound-assisted doping-activating approach is able to be applied to different types of biomass. Further, PSNPC-850 exhibits the largest surface area (2990 m2 g−1) and the largest mesopore volume (1.120 cm3 g−1), as shown in both Fig. S4C and Table 1,† which, however, do not make it a larger specific capacitance than MSNPC-850 (Fig. S5 and Table S2†). Likewise, this can be assigned to the fall in the effective micropore volume and surface area of PSNPC-850. Among the NPCs derived from the three biomass sources, MSNPC-850 has the largest specific capacitance.
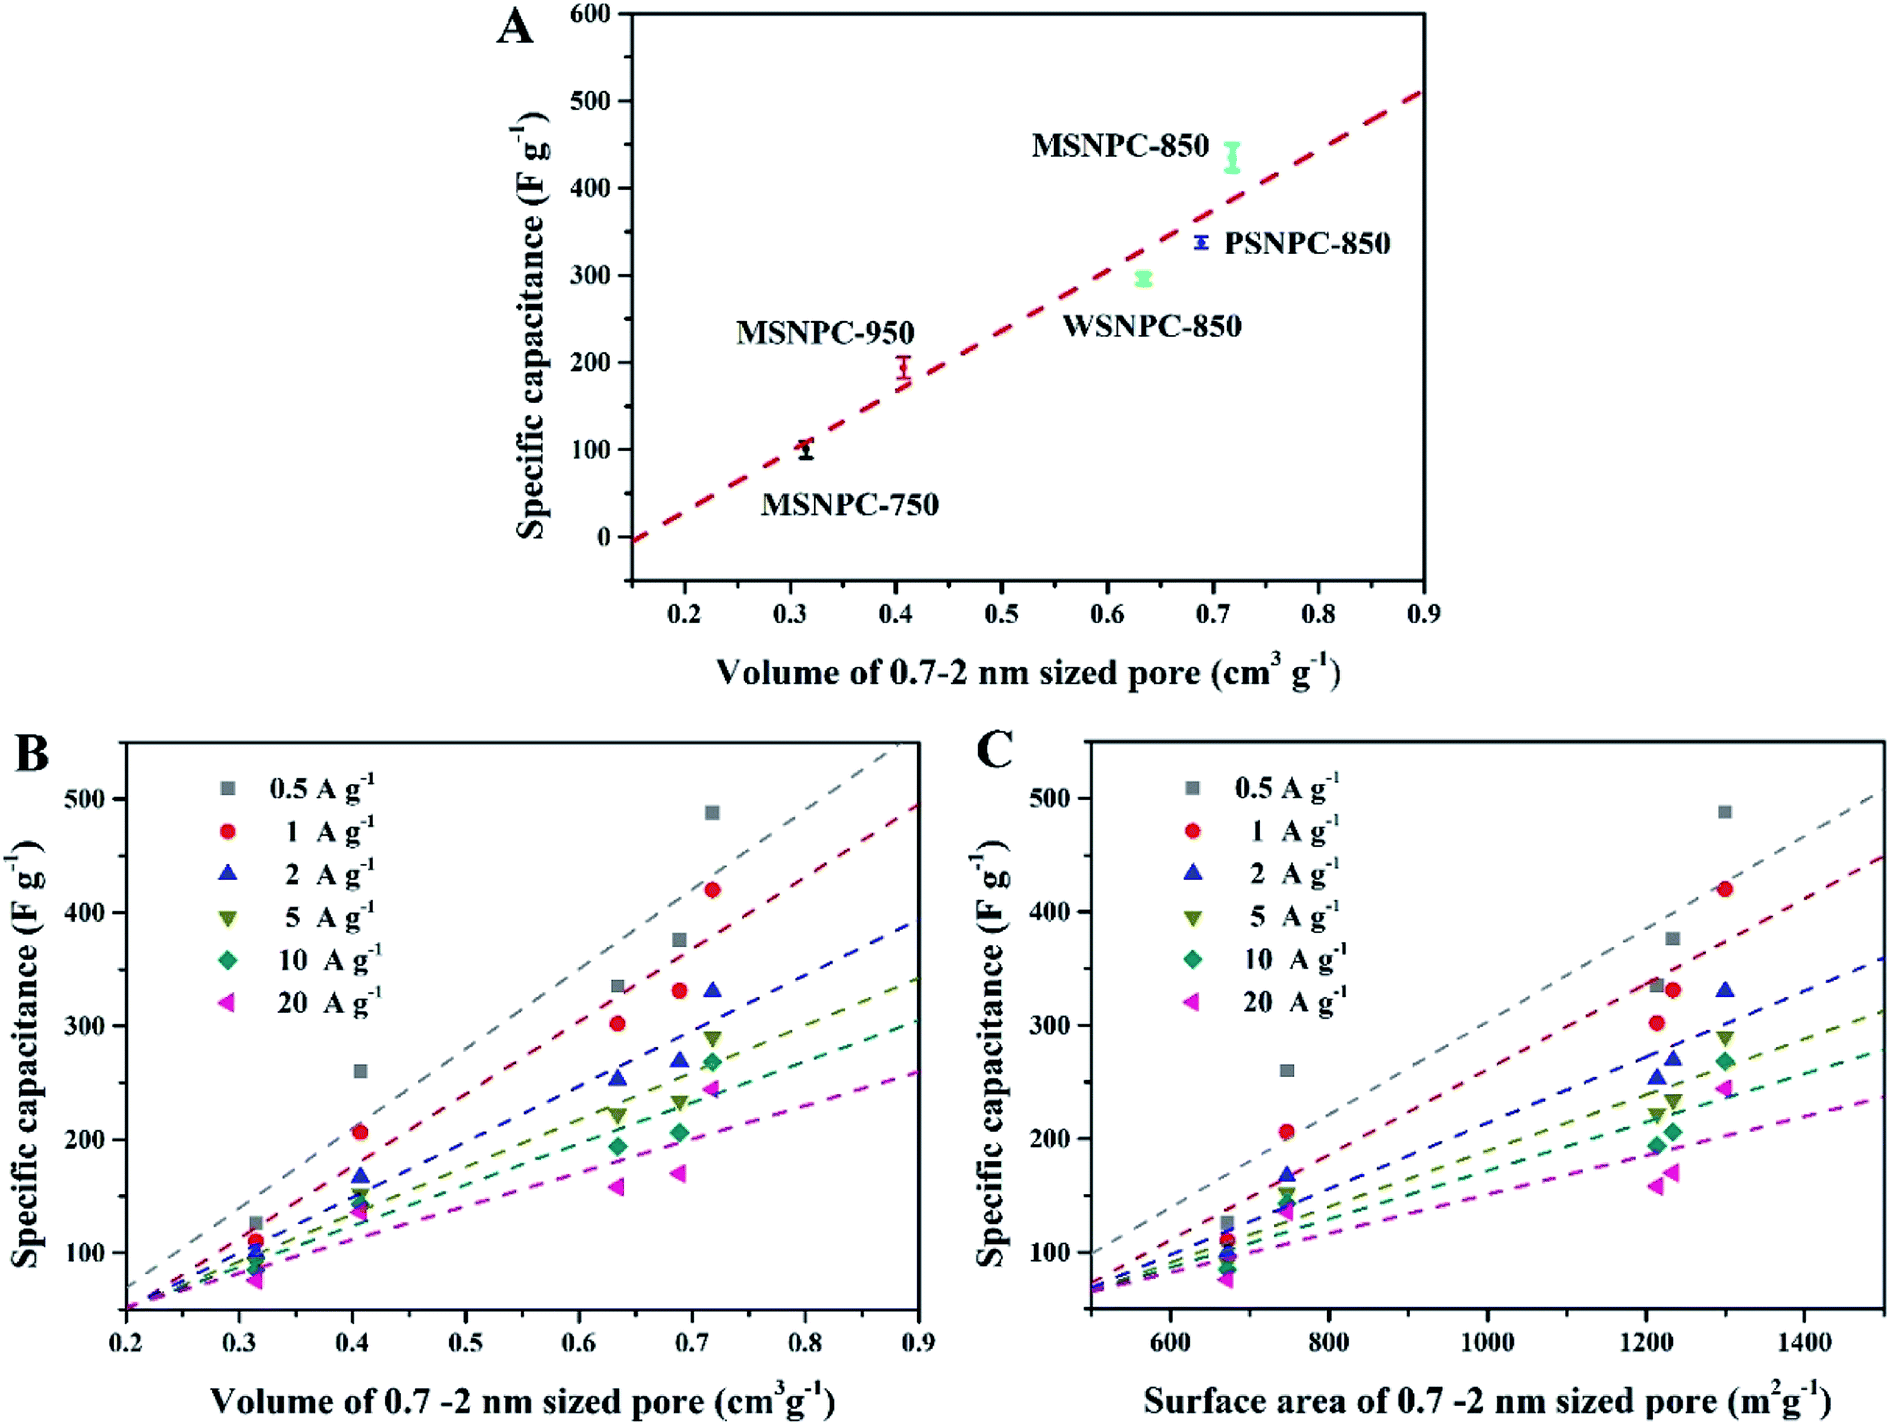
How do the effective micropores (i.e., the 0.7–2 nm sized pores in this case) determine the charge-storage limit of supercapacitors? To shed light on this issue, the pore size distributions (Table 1) and the capacitive performance (Table S2†) of all the five bio-derived NPCs were taken into account. As Fig. 6A demonstrates, the X axis represents the volumes of the 0.7–2 nm sized pores and the Y axis is the specific capacitance (Csp) values of MSNPCs, WSNPC-850 and PSNPC-850 obtained in 6 M KOH at the current density of 0.5 A g−1. Evidently, there is a linear relationship between the volumes of the 0.7–2 nm sized pores and the specific capacitances, regardless of biomass types and activation temperatures employed. Fig. 6B and C investigate this linear relevance at various current densities. Similarly, the dependences of the specific capacitances on the effective micropore volumes and surface areas exhibit the linear tendencies across the volume and surface area ranges of the 0.7–2 nm sized pores. Furthermore, the slopes of the fit straight lines decrease with the increase in current densities, which is conceivable because charging/discharging occur rapidly at high current densities so that electrolyte ions do not have enough time to transport into/out of the micropores and adsorb/desorb on the electrode surface.
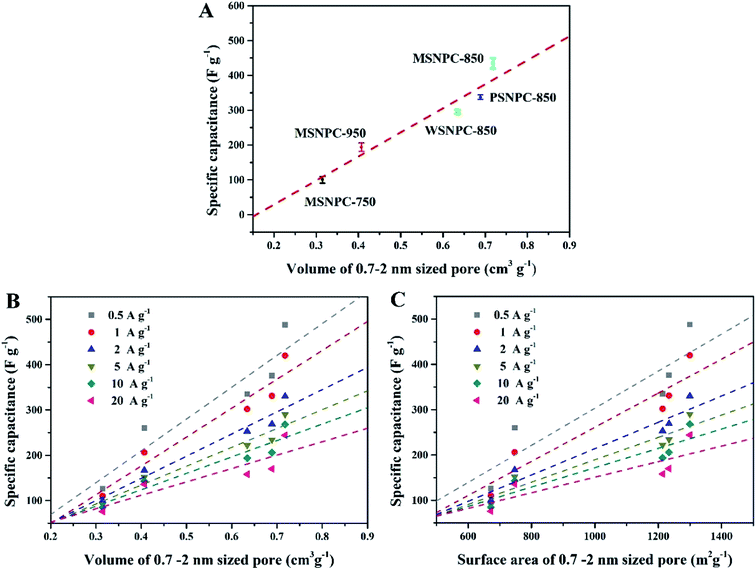 |
| | Fig. 6 MSNPCs, PSNPC-850 and WSNPC-850 in 6 M KOH: (A) dependence of Csp (at 1 A g−1) on the effective micropore volume, (B) dependence of Csp (at 0.5–20 A g−1) on the effective micropore volume, (C) dependence of Csp (at 0.5–20 A g−1) on the effective micropore surface area. | |
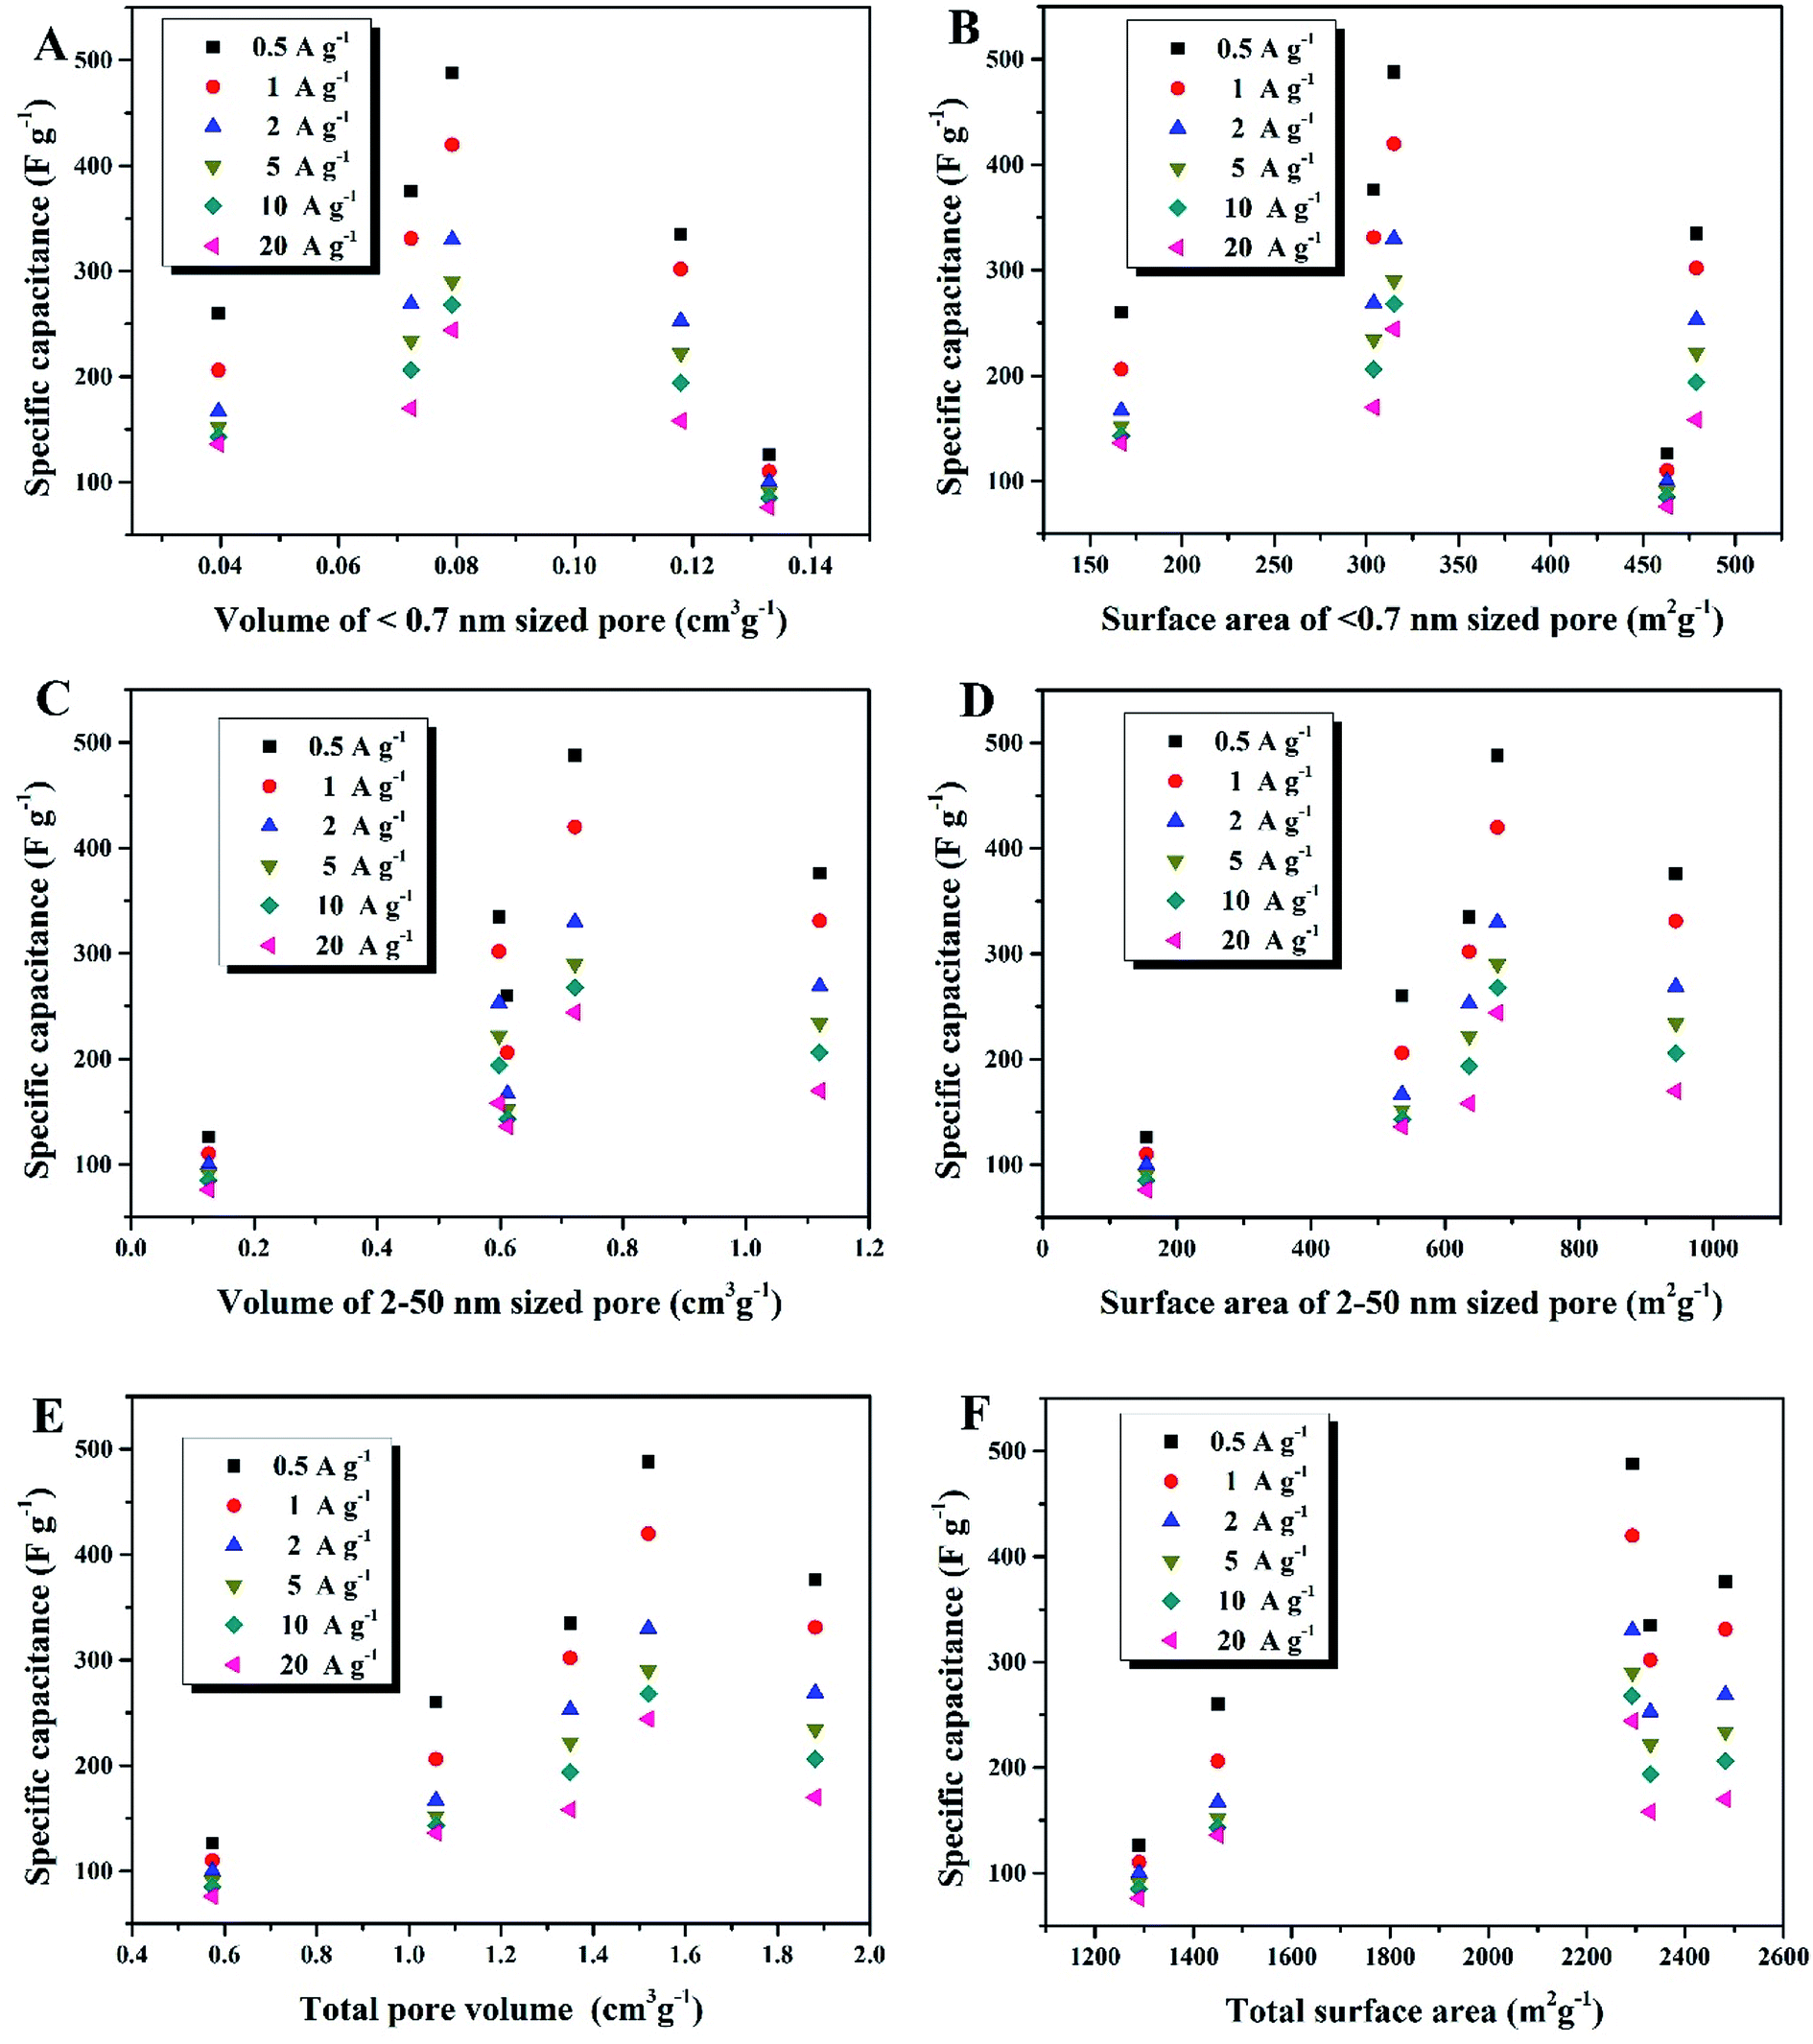
Compared to the effective micropores, the specific capacitance is not positively correlated with volumes or surface areas of any other pore size segments, that is, <0.7 nm (narrow micropores), 2–50 nm (mesopores) and 0.5–50 nm (hierarchical micro/mesopores), as shown in Fig. 7. It can be proposed that the effective micropore volume and surface area determine the limit of charge-storage capability of a nanopore structure and exert a linear influence on the specific capacitance of a porous electrode. Fig. 6B and C can both corroborate this viewpoint: the more proportion of the 0.7–2 nm sized pores has an electrode, the larger specific capacitance it owns.
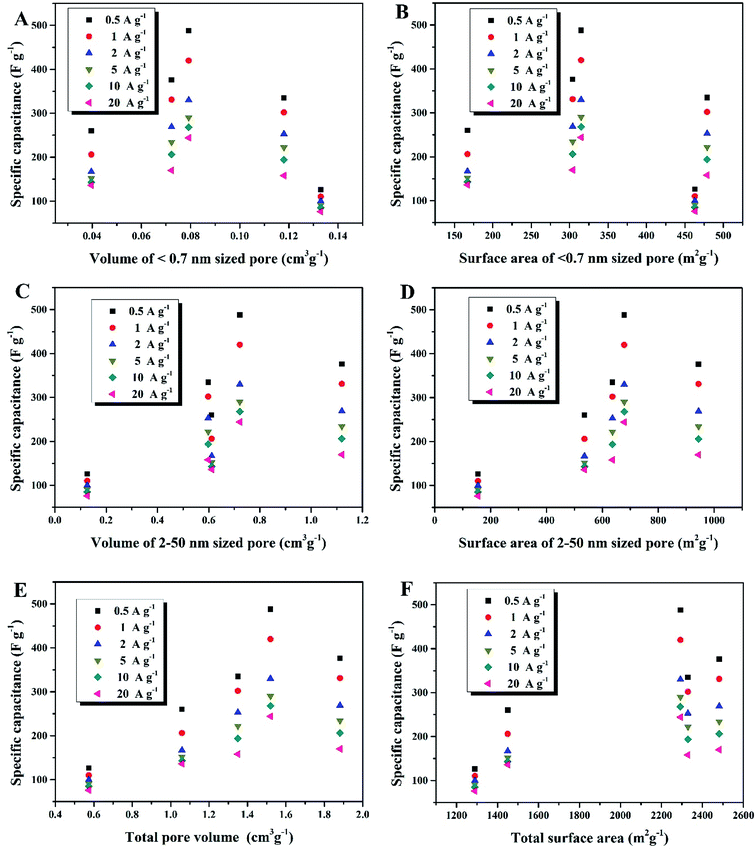 |
| | Fig. 7 (A) Dependence of Csp on volume of <0.7 nm sized pores, (B) dependence of Csp on surface area of <0.7 nm sized pores, (C) dependence of Csp on volume of 2–50 nm sized pores, (D) dependence of Csp on surface area of 2–50 nm sized pores, (E) dependence of Csp on volume of total pores (0.5–50 nm), (F) dependence of Csp on surface area of total pores (0.5–50 nm). | |
The two-electrode system was assembled to examine the electrochemical performance of the supercapacitor MSNPC-850‖MSNPC-850 employing different electrolytes. At various scan rates, the CV curves (Fig. S6A†) each manifest quasi-rectangular shapes in 6 M KOH, indicating the typical EDLC feature. Meanwhile, there are still broad hump-shape redox peaks at a wide voltage range, revealing the presence of pseudocapacitance. At different current densities, the GCD curves in Fig. S6B† show quasi-symmetric shapes, which are characteristic of the fine capacitive behaviour in 6 M KOH. The specific capacitance in the two-electrode system exhibits a cell specific capacitance of 79 F g−1 at 0.2 A g−1, showing that MSNPC-850 is a promising supercapacitor electrode material. On account of the limited voltage window (0–1 V) obtained in KOH, the neutral aqueous electrolyte Na2SO4 that could withstand a wider voltage window up to 1.8 V (Fig. S7†) was used to further enhance the electrochemical performance of MSNPC-850‖MSNPC-850, as the voltage window has a considerable influence on the energy and power densities of a supercapacitor (eqn (2) and (4)). Fig. S6C† shows the CV curves of MSNPC-850‖MSNPC-850 in 1 M Na2SO4, each displaying quasi-rectangular shapes. According to the GCD curves displayed in Fig. S6D,† MSNPC-850‖MSNPC-850 exhibits a cell capacitance of 61 F g−1 when the current density is 0.2 A g−1. Moreover, NaOH was also used to further compare the electrochemical performance of the supercapacitor in different electrolytes. The CV and GCD curves in 6 M NaOH are displayed in Fig. S6E and F† respectively. The specific capacitance of MSNPC-850‖MSNPC-850 in 6 M NaOH only exhibits 48 F g−1 at 0.5 A g−1, markedly smaller than that in 6 M KOH or 1 M Na2SO4. Fig. S8† shows the Nyquist plot of the supercapacitor MSNPC-850‖MSNPC-850 using the different electrolytes. Evidently, in the low-frequency region, all the curves exhibit linear lines, which are indicative of the capacitive features; in the high-frequency region, the semi-circle reveals Rct and the starting position of Z1 indicates the combined series resistance (Rs). The equivalent circuit fit results are shown in Table S4.†Rct and Rs of MSNPC-850‖MSNPC-850 in 6 M KOH are 0.335 and 0.776 Ω, respectively, each presenting the smallest value among the three electrolytes. The Na2SO4 electrolyte exhibits a relatively high Rs of 4.340 Ω and Rct of 2.646 Ω. In terms of electrolytes, NaOH is inferior to KOH owing to its larger Rs and Rct and also to Na2SO4 due to its smaller voltage window; therefore, KOH and Na2SO4 are more preferable electrolytes for aqueous supercapacitors because of their respective merits.
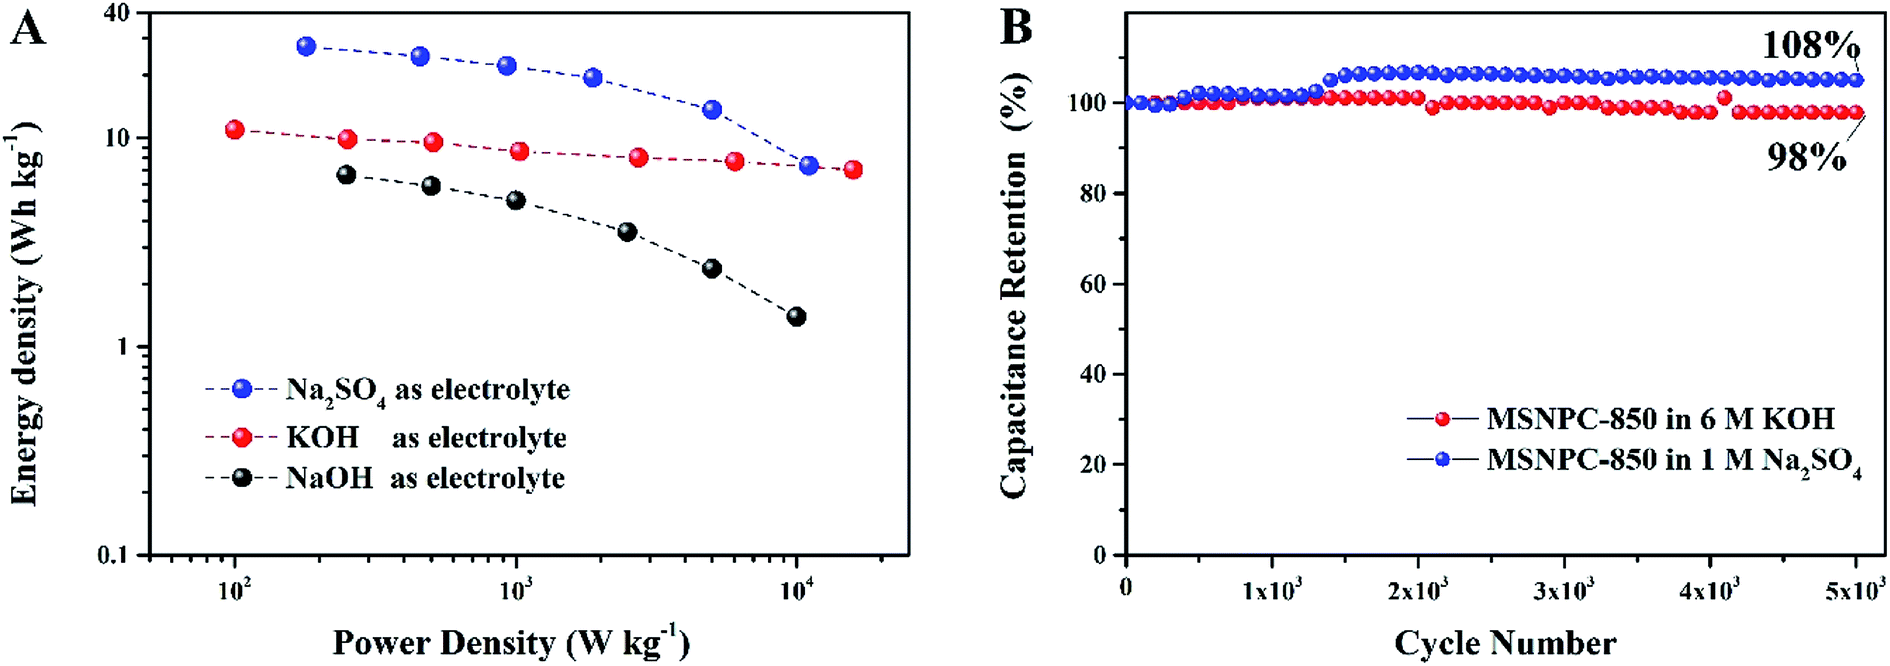
The Ragone plots of MSNPC-850‖MSNPC-850 are displayed in Fig. 8A. MSNPC-850‖MSNPC-850 in 1 M Na2SO4 exhibits a high energy density of up to 27.5 W h kg−1 (at 180 W kg−1). In 6 M KOH, the MSNPC-850‖MSCNPC-850 supercapacitor can achieve an energy density of 10.9 W h kg−1 (at 100 W kg−1). The cycling stabilities of MSNPC-850‖MSNPC-850 in KOH and Na2SO4 were explored using continuous GCD measurements at 5 A g−1. As shown in Fig. 8B, after 5000 charge/discharge cycles, the capacitance retention retains 98% in 6 M KOH and 108% in 1 M Na2SO4. The capacitance increase in 1 M Na2SO4 should be ascribed to the increased effective interface of the supercapacitor material with the persistent charging/discharging.62,63 These results confirmed that MSNPC-850 is an attractive electrode material for supercapacitors with continuous working ability and multiple-electrolyte compatibility.
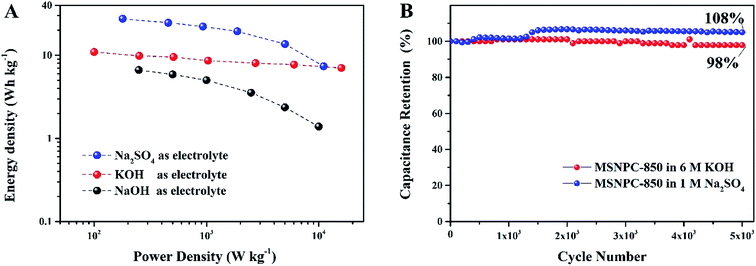 |
| | Fig. 8 (A) Ragone plots of MSNPC-850‖MSNPC-850 in the different electrolytes: 6 M KOH, 6 M NaOH and 1 M Na2SO4, (B) cycling stabilities of MSNPC-850‖MSNPC-850 at the current density of 5 A g−1 in 6 M KOH and 1 M Na2SO4. | |
Conclusions
To summarize, various types of fruit skins were employed as the carbon sources and potassium bicarbonate as the chemical activator, dispensing with hazardous chemical reagents, to prepare nitrogen-doped nanoporous carbons as supercapacitor electrodes by a novel and green way that combines the ultrasound-assisted treatment with the subsequent pyrolytic processes. It is worth noting that mango and pitaya skins are first-time used as the carbon precursors to prepare supercapacitor electrodes. Ultrasound herein is a crucial element in the preparation of bimodal carbon/nitrogen precursors to generate acoustic cavitation and accelerate uniform dispersion and intense interaction of reactant mixtures. MSNPC-850 exhibits a maximum specific capacitance of 493 F g−1 at 0.5 A g−1 in the three-electrode system in 6 M KOH. The MSNPC-850‖MSCNPC-850 supercapacitor has high energy densities of 27.5 W h kg−1 (at 180 W kg−1) in 1 M Na2SO4 and 10.9 W h kg−1 (at 100 W kg−1) in 6 M KOH. The capacitance remains 108% in 1 M Na2SO4 and 98% in 6 M KOH after 5000 charge/discharge cycles, demonstrating a long working stability in different electrolytes. Such fine electrochemical performance can be ascribed to the optimization of the effective micropore volume and surface area. The specific capacitance has been found linearly correlated with volume and surface area of the effective micropores (i.e., the 0.7–2 nm sized pores in this study) instead of those of any other sized pores (i.e., <0.7, 2–50 and 0.5–50 nm), by considering pore size relative to the hydrated sizes of electrolyte ions. As a consequence, one can anticipate that more effective micropores will make greater capacitance.
Conflicts of interest
There are no conflicts to declare.
Acknowledgements
We are very grateful for the financial support provided by the National Natural Science Foundation of China (51702358) and the Natural Science Foundation of Jiangsu Province (BK20170281). We also thank the Advanced Analysis and Computation Center (AACC) of China University of Mining and Technology (CUMT) for the TEM, XPS, XRD and Raman measurements. P. B. receives the ESI doctoral studentship of CUMT. L. X. holds the Jiangsu Specially-Appointed Professorship.
References
- F. Wang, X. Wu, X. Yuan, Z. Liu, Y. Zhang, L. Fu, Y. Zhu, Q. Zhou, Y. Wu and W. Huang, Chem. Soc. Rev., 2017, 46, 6816–6854 RSC.
- Y. Zhai, Y. Dou, D. Zhao, P. F. Fulvio, R. T. Mayes and S. Dai, Adv. Mater., 2011, 23, 4828–4850 CrossRef CAS.
- L. Gao, L. Xiong, D. Xu, J. Cai, L. Huang, J. Zhou and L. Zhang, ACS Appl. Mater. Interfaces, 2018, 10, 28918–28927 CrossRef CAS.
- X. Wu, J. Tang, Y. Duan, A. Yu, M. Berry and K. Tam, J. Mater. Chem. A, 2014, 2, 19268–19274 RSC.
- A. González, E. Goikolea, J. A. Barrena and R. Mysyk, Renewable Sustainable Energy Rev., 2016, 58, 1189–1206 CrossRef.
- Z. Bi, Q. Kong, Y. Cao, G. Sun, F. Su, X. Wei, X. Li, A. Ahmad, L. Xie and C. M. Chen, J. Mater. Chem. A, 2019, 7, 16028–16045 RSC.
- Z. Zhang, S. Yang, H. Li, Y. Zan, X. Li, Y. Zhu, M. Dou and F. Wang, Adv. Mater., 2019, 31, 1805718 CrossRef.
- J. Huang, B. Zhao, T. Liu, J. Mou, Z. Jiang, J. Liu, H. Li and M. Liu, Adv. Funct. Mater., 2019, 29, 1902255 CrossRef.
- S. Zhou, L. Zhou, Y. Zhang, J. Sun, J. Wen and Y. Yuan, J. Mater. Chem. A, 2019, 7, 4217–4229 RSC.
- J. Deng, M. Li and Y. Wang, Green Chem., 2016, 18, 4824–4854 RSC.
- S. Dutta, A. Bhaumik and K. C. Wu, Energy Environ. Sci., 2014, 7, 3574–3592 RSC.
- W. Shi, B. Chang, H. Yin, S. Zhang, B. Yang and X. Dong, Sustainable Energy Fuels, 2019, 3, 1201–1204 RSC.
- Q. Wang, J. Yan and Z. J. Fan, Energy Environ. Sci., 2016, 9, 729–762 RSC.
- M. Inagaki, M. Toyoda, Y. Soneda, S. Tsujimura and T. Morishita, Carbon, 2016, 107, 448–473 CrossRef CAS.
- M. J. Ahmed and S. K. Theydan, Powder Technol., 2012, 229, 237–245 CrossRef CAS.
- Y. Li, G. Wang, T. Wei, Z. Fan and P. Yan, Nano Energy, 2016, 19, 165–175 CrossRef CAS.
- A. Jain, S. Jayaraman, R. Balasubramanian and M. P. Srinivasan, J. Mater. Chem. A, 2014, 2, 520–528 RSC.
- D. Prahas, Y. Kartika, N. Indraswati and S. Ismadji, Chem. Eng. J., 2008, 140, 32–42 CrossRef CAS.
- J. Deng, T. Xiong, F. Xu, M. Li, C. Han, Y. Gong, H. Wang and Y. Wang, Green Chem., 2015, 17, 4053–4060 RSC.
- J. Deng, T. Xiong, H. Wang, A. Zheng and Y. Wang, ACS Sustainable Chem. Eng., 2016, 4, 3750–3756 CrossRef CAS.
- H. Lu and X. S. Zhao, Sustainable Energy Fuels, 2017, 1, 1265–1281 RSC.
- Y. Wang, Y. Song and Y. Xia, Chem. Soc. Rev., 2016, 45, 5925–5950 RSC.
- S. W. Xu, Y. Q. Zhao, Y. X. Xu, Q. H. Chen, G. Q. Zhang, Q. Q. Xu, D. D. Zhao, X. Zhang and C. L. Xu, J. Power Sources, 2018, 401, 375–385 CrossRef CAS.
- L. Sun, L. Wang, C. Tian, T. Tan, Y. Xie, K. Shi, M. Li and H. Fu, RSC Adv., 2012, 2, 4498–4506 RSC.
- X. Wu, Z. Shi, R. Tjandra, A. J. Cousins, S. Sv, A. Yu, R. M. Berry and K. C. Tam, J. Mater. Chem. A, 2015, 3, 23768–23777 RSC.
- Y. Wang, S. Zuo and Y. Liu, Electrochim. Acta, 2018, 263, 465–473 CrossRef CAS.
- L. Chen, Z. Chen, Y. Kuang, C. Xu, L. Yang, M. Zhou, B. He, M. Jing, Z. Li, F. Li, Z. Chen and Z. Hou, ACS Appl. Mater. Interfaces, 2018, 10, 27047–27055 CrossRef CAS.
- J. Qi, W. Zhang and L. Xu, Chem.–Eur. J., 2018, 24, 18097–18105 CrossRef CAS.
- M. Inagaki, M. Toyoda, Y. Soneda and T. Morishita, Carbon, 2018, 132, 104–140 CrossRef CAS.
- F. Liu, R. Yuan, N. Zhang, C. Ke, S. Ma, R. Zhang and L. Liu, Appl. Surf. Sci., 2018, 437, 271–280 CrossRef CAS.
- K. S. Suslick, Science, 1990, 247, 1439–1445 CrossRef CAS.
- M. Zhang, H. Tao, Y. Liu, C. Yan, S. Hong, J. Masa, A. Robertson, S. Liu, J. Qiu and Z. Sun, ACS Sustainable Chem. Eng., 2019, 7, 3434–3442 CrossRef CAS.
- Y. Zhang, S. Liu, X. Zheng, X. Wang, Y. Xu, H. Tang, F. Kang, Q. Yang and J. Luo, Adv. Funct. Mater., 2017, 27, 1604687 CrossRef.
- L. Peng, Y. Liang, J. Huang, L. Xing, H. Hu, Y. Xiao, H. Dong, Y. Liu and M. Zheng, ACS Sustainable Chem. Eng., 2019, 7, 10393–10402 CrossRef CAS.
- Y. Gong, D. Li, C. Luo, Q. Fu and C. Pan, Green Chem., 2017, 19, 4132–4140 RSC.
- W. Si, J. Zhou, S. Zhang, S. Li, W. Xing and S. Zhuo, Electrochim. Acta, 2013, 107, 397–405 CrossRef CAS.
- S. Zhao, P. Li, J. Adkins, L. Zhu, F. Du, Q. Zhou and J. Zheng, J. Electroanal. Chem., 2018, 823, 422–428 CrossRef CAS.
- L. Pan, Y. Wang, H. Hu, X. Li, J. Liu, L. Guan, W. Tian, X. Wang, Y. Li and M. Wu, Carbon, 2018, 134, 345–353 CrossRef CAS.
- C. Xu, G. Zhou and H. Qiu, RSC Adv., 2017, 7, 47954–47965 RSC.
- X. Huang, Q. Wang, X. Y. Chen and Z. J. Zhang, J. Electroanal. Chem., 2015, 748, 23–33 CrossRef CAS.
- A. K. Mondal, K. Kretschmer, Y. Zhao, H. Liu, C. Wang, B. Sun and G. Wang, Chem.–Eur. J., 2017, 23, 3683–3690 CrossRef CAS.
- X. Han, H. Jiang, Y. Zhou, W. Hong, Y. Zhou, P. Gao, R. Ding and E. Liu, J. Alloys Compd., 2018, 744, 544–551 CrossRef CAS.
- Y. He, Y. Zhang, X. Li, Z. Lv, X. Wang, Z. Liu and X. Huang, Electrochim. Acta, 2018, 282, 618–625 CrossRef CAS.
- Y. Ma, G. Zhou, J. Ding, S. Li and G. Wang, Cellulose, 2018, 25, 4011–4029 CrossRef CAS.
- T. Fan, G. Zhou and J. Wang, Process Saf. Environ. Prot., 2018, 113, 282–291 CrossRef CAS.
- S. Lei, L. Chen, W. Zhou, P. Deng, Y. Liu, L. Fei, W. Lu, Y. Xiao and B. Cheng, J. Power Sources, 2018, 379, 74–83 CrossRef CAS.
- J. Li, G. Zan and Q. Wu, RSC Adv., 2016, 6, 57464–57472 RSC.
- A. C. Ferrari and D. M. Basko, Nat. Nanotechnol., 2013, 8, 235–246 CrossRef CAS.
- L. Xie, G. Sun, F. Su, X. Guo, Q. Kong, X. Li, X. Huang, L. Wan, W. Song, K. Li, C. Lv and C. Chen, J. Mater. Chem. A, 2016, 4, 1637–1646 RSC.
- M. Sevilla and A. B. Fuertes, ChemSusChem, 2016, 9, 1880–1888 CrossRef CAS.
- M. Sevilla, G. A. Ferrero and A. B. Fuertes, Carbon, 2017, 114, 50–58 CrossRef CAS.
- W. Zhang, J. Qi, P. Bai, H. Wang and L. Xu, New J. Chem., 2019, 43, 10878–10886 RSC.
- J. Qi, B. Jin, P. Bai, W. Zhang and L. Xu, RSC Adv., 2019, 9, 24344–24356 RSC.
- A. G. Volkov, S. Paula and D. W. Deamer, Bioelectrochem. Bioenerg., 1997, 42, 153–160 CrossRef CAS.
- M. Barczak, Y. Elsayed, J. Jagiello and T. J. Bandosz, Electrochim. Acta, 2018, 275, 236–247 CrossRef CAS.
- C. Largeot, C. Portet, J. Chmiola, P. L. Taberna, Y. Gogotsi and P. Simon, J. Am. Chem. Soc., 2008, 130, 2730–2731 CrossRef CAS PubMed.
- M. Inagaki, H. Konno and O. Tanaike, J. Power Sources, 2010, 195, 7880–7903 CrossRef CAS.
- R. J. Mo, Y. Zhao, M. Wu, H. M. Xiao, S. Kuga, Y. Huang, J. P. Li and S. Y. Fu, RSC Adv., 2016, 6, 59333–59342 RSC.
- T. Brezesinski, J. Wang, J. Polleux, B. Dunn and S. H. Tolbert, J. Am. Chem. Soc., 2009, 131, 1802–1809 CrossRef CAS.
- B. Liu, Y. Liu, H. Chen, M. Yang and H. Li, J. Power Sources, 2017, 341, 309–317 CrossRef CAS.
- E. Hao, W. Liu, S. Liu, Y. Zhang, H. Wang, S. Chen, F. Cheng, S. Zhao and H. Yang, J. Mater. Chem. A, 2017, 5, 2204–2214 RSC.
- Z. Fan, J. Yan, L. Zhi, Q. Zhang, T. Wei, J. Feng, M. Zhang, W. Qian and F. Wei, Adv. Mater., 2010, 22, 3723–3728 CrossRef CAS.
- Y. Yoon, K. Lee, C. Baik, H. Yoo, M. Min, Y. Park, S. M. Lee and H. Lee, Adv. Mater., 2013, 25, 4437–4444 CrossRef CAS.
Footnote |
| † Electronic supplementary information (ESI) available. See DOI: 10.1039/c9ra06501f |
|
| This journal is © The Royal Society of Chemistry 2019 |
Click here to see how this site uses Cookies. View our privacy policy here. 
 Open Access Article
 This Open Access Article is licensed under a Creative Commons Attribution-Non Commercial 3.0 Unported Licence
 *
*