 Open Access Article
Experimental study of growth kinetics of CO2 hydrates and multiphase flow properties of slurries in high pressure flow systems
Xiao-fang Lv *a,
Jiang-wei Zuoa,
Yang Liu
 *a,
Shi-Dong Zhou
 a,
Da-yong Lua,
Ke-le Yanbc,
Bo-hui Shi
 d and
Hui-jun Zhaoa
aJiangsu Key Laboratory of Oil-Gas Storage and Transportation Technology, School of Petroleum Engineering, Changzhou University, Changzhou, 213164, China. E-mail: lvxiaofang5@cczu.edu.cn; chrisblack@foxmail.com
bSINOPEC Research Institute of Safety Engineering, 339 Songling Road, Qingdao, 266000, China
cState Key Laboratory of Safety and Control for Chemicals, 218 Yanansan Road, Qingdao, 266071, China
dNational Engineering Laboratory for Pipeline Safety/MOE Key Laboratory of Petroleum Engineering/Beijing Key Laboratory of Urban Oil and Gas Distribution Technology, China University of Petroleum-Beijing, Beijing, 102249, China
First published on 15th October 2019
Abstract
The formation and accumulation of hydrates in high pressure oil and gas pipelines bring great risks to field development and deep-water transportation. In this paper, a high pressure flow loop equipped with visual window was used to study the growth process of hydrates in a pipe flow system and slurry flow characteristics. Deionized water, industrial white oil and CO2 were selected as the experiment medium. A series of experiments with different initial pressures (2.5–3 MPa), liquid loads (7–9 L), flow rates (25–35 kg min−1) and water cuts (60–100%) were designed and carried out. Specifically, hydrate formation and slurry flow characteristics in two different systems, pure water and oil–water emulsion system, were compared. Both of the systems experienced an induction stage, slurry flow stage and followed by a plugging stage. Although hydrate growth gradually ceased in the slurry flow stage, plugging still occurred due to the continuous agglomeration of hydrates. Visual observation showed that there were obvious stratification of the oil–water emulsion systems at the later time of slurry flow stage, which directly resulted in pipe blockage. The hydrate induction time of the flow systems gradually decreased with the increasing initial pressure, initial flow rate and water content. And the induction time tended to decrease first and then slowly increase with the increasing liquid loading. For emulsion systems, the apparent viscosity and friction coefficient of the hydrate slurry increased with the increasing water content, indicating that there were higher plugging risks compared to the pure water systems. Moreover, the results of sensitivity analysis showed that the water content was the main factor affecting the hydrate induction time, followed by the influence of liquid carrying capacity and flow rate, and the initial pressure had the least influence on the induction time. Conclusions obtained in this paper can provide some reference not only for the prevention and management of hydrates in pipelines, but also for the application of CO2 hydrate as a refrigerant.
1. Introduction
Gas hydrates, also known as cage hydrates, are a kind of non-stoichiometric compound formed by gas and water molecules.1,2 Based on the unique physical and chemical properties of hydrates, a series of hydrate application technologies have been developed, involving the comprehensive utilization of water resources,3,4 capture and storage of greenhouse gas CO2,5 mining CH4 via CO2 replacement,6 hydrate storage and transportation technology,7 separation of mixed gas by hydrate method,8 and many other fields, which greatly improve human life. On the other hand, with the extraction of oil and gas resources gradually moving toward deep sea areas, deep sea oil and gas pipelines usually face low-temperature and high-pressure environment, which provides favorable conditions for hydrate formation in pipelines. The resulting hydrate blockage and other related problems pose great threats and challenges to the normal exploitation and transportation safety of oil and gas resources.9,10At present, the main methods of the hydrate prevention and control include traditional thermodynamic method and hydrate risk managements.11 With the injection of thermodynamic inhibitors or the usage of insulating pipes, the temperature of field products is higher than hydrate formation temperature, and thus the formation of hydrates is suppressed. However, technical limitations appear in the application of this method. The high cost of thermodynamic inhibitors, large dosage and easy to cause such problems as environmental pollution limit its application. A new solution is hydrate risk control strategy, which allows hydrate formation in oil and gas pipelines with the injection of low dose hydrate inhibitors, such as anti-agglomerants (AAs)12–14 and kinetic inhibitors (KHIs).15,16 This new strategy has attracted the attention of academia and industry. Therefore, it is critical to explore the hydrate formation and flow characteristics of high pressure flow systems for the implementation of hydrate risk control strategy.
Nowadays, flow loops are considered as one of the most useful equipment for hydrate research, where a series of hydrate formation/decomposition, hydrate slurry flow and plugging experiments can be conducted.2,17–21 A large number of experimental data were obtained, which could simulate the real pipe flow and provide important reference for the fields. Melchuna et al.22 analyzed the influence of the flow characteristics of the slurry and the crystallization process of methane hydrate in the emulsion system with different water content using a flow loop. Pauchard et al.23 established a model for predicting hydrate particle agglomeration and pressure drop. They also analyzed the risk of hydrate blockage in flow systems. Sinquin et al.24 studied the rheological properties of hydrate suspensions and the flow characteristics of hydrates that were formed by two gas-rich systems. Joshi et al.2 studied the formation and plugging mechanism of hydrates in high water cut systems through the US Exxon Mobil Loop. Ding et al.25 studied the flow characteristics and flow patterns of natural gas hydrate slurry through a flow loop, and they proposed the mechanism of hydrate formation and plugging of different gas–liquid flow patterns. Song et al.26 completed a series of hydrate plugging experiments relied on a high-pressure flow loop and put forward corresponding mechanisms for different types of hydrate plugging.
As seen, for the studies of the hydrate formation in flow systems, experiments have been carried out on different experimental loops using different experimental systems. The focus of these researches include obtaining the effects of pressure, subcooling, water content, gas content, flow rate and other factors on hydrate formation kinetics, such as induction time. For the study of the flow characteristics of hydrate slurries, the viscosity and rheological properties of different types of hydrate slurries as well as the variation of flow friction and pressure drop are also the focus. In addition, the hydrate volume fraction were correlated with the viscosity of hydrate slurries, and predictive models for characterizing the viscosity of hydrate slurries were established based on experimental data.24,27 However, due to the differences in the experimental loops (e.g., length, flow diameter, and experimental materials etc.), the applicability and accuracy of one model to another flow system still require further verification.
Considering the problem of increasing water content during oil and gas field mining and transportation, a series of hydrate formation and slurry flow experiments under different experimental conditions, especially high water cut, were carried with the assistance of high pressure visual loop in this paper. The effects of initial pressure, pipe liquid loading, pipe transport flow rate and water content on the kinetics of CO2 hydrate formation as well as the flow behaviors were systematically studied. Finally, the multi-factor analysis method was used to analyze the sensitivity factors of the induction time, and the degree of influence of each factor was obtained. The experimental conclusions of this work can contribute to the implementation of the hydrate risk control strategy.
2. Experimental section
2.1. Experimental apparatus
All the experiments in this work were conducted in a high pressure hydrate circulation loop. The length of the loop is 17 m (including hose part), the inner diameter is 25.4 mm, and the total volume is 10 L. The designed pressure of the loop is 15 MPa. There are two observation windows and two transparent sections in the whole section for observing the macroscopic morphology of hydrate formation and flow at different positions of the loop. The loop is equipped with complete systems for intake, injection, refrigeration and data acquisition. The temperature, pressure, differential pressure, mass flow rate, and mixture density are collected by the sensors and recorded by the computer. Not only the experiments of hydrate formation and hydrate slurry flow, but also the evaluation of the effects of various additives in flow systems, such as AAs, KHIs and hydrate promoters, can be performed using the flow loop. Fig. 1 is the schematic diagram of the loop. Additional details of the loop can be found in Appendix A and elsewhere.28,292.2. Experimental materials
CO2 gas used in this work is provided by Changzhou Jinghua industrial gas Co., LTD., with a purity of 99.8%. The experimental liquid phase are composed of industrial grade 5# white oil and distilled water (made by the laboratory). The white oil, which is colorless, odorless, transparent and oily liquid without asphaltene, resin or other natural surfactants, is selected to avoid the influence of impurities (e.g., surfactants) on the formation of hydrates. The kinematic viscosity of the white oil is 5.5 mm2 s−1 (40 °C). Tween-80 is selected as the emulsifier, and is purchased from Jiangsu Hai'an petrochemical plant. In addition, in order to observe the macroscopic morphology of CO2 hydrate formation and slurry flow, a certain proportion of dyes were added.2.3. Experimental procedures
| Exp. no. | Initial pressure/MPa | Liquid loading/L | Intake air temperature/K | Water bath temperature/K | Initial average flow rate/kg min−1 | water cut |
|---|---|---|---|---|---|---|
| 1 | 2.5 | 8 | 281.15–283.15 | 273.15 | 30 | 100% |
| 2 | 2.8 | 8 | 282.15–284.15 | 273.15 | 30 | 100% |
| 3 | 3.0 | 8 | 283.15–284.15 | 273.15 | 30 | 100% |
| 4 | 2.5 | 9 | 281.15–283.15 | 273.15 | 25 | 100% |
| 5 | 2.8 | 9 | 282.15–283.15 | 273.15 | 25 | 100% |
| 6 | 3.0 | 9 | 283.15–284.15 | 273.15 | 25 | 100% |
| 7 | 3.0 | 7 | 282.15–283.15 | 275.15 | 35 | 100% |
| 8 | 3.0 | 8 | 281.15–283.15 | 275.15 | 35 | 100% |
| 9 | 3.0 | 9 | 282.15–284.15 | 275.15 | 35 | 100% |
| 10 | 2.8 | 7 | 281.15–283.15 | 274.15 | 25 | 100% |
| 11 | 2.8 | 7 | 281.15–283.15 | 274.15 | 30 | 100% |
| 12 | 2.8 | 7 | 281.15–283.15 | 274.15 | 35 | 100% |
| 13 | 3 | 9 | 287.15–289.15 | 273.15 | 30 | 60% |
| 14 | 3 | 9 | 287.15–289.15 | 273.15 | 30 | 70% |
| 15 | 3 | 9 | 288.15–289.15 | 273.15 | 30 | 80% |
| 16 | 3 | 9 | 288.15–289.15 | 273.15 | 30 | 90% |
| 17 | 3 | 9 | 286.15–288.15 | 273.15 | 30 | 100% |
2.4. Experimental conditions
The experimental system was a constant volume system. Each of the experiments were conducted three times to provide confidence in the data reliability, and typical results of repeated experiments were exhibited in this work. For more details about repeated experiments, please refer to Appendix B. Table 1 shows the relevant experimental conditions of each set of experiments.2.5. Determination of induction time of hydrate formation in flow systems
Hydrate induction time is an important kinetic parameter indicating the degree of difficulty and the rate of hydrate formation. A longer induction time means that there are higher possibility for the fluid flowing safely through the pipeline without forming hydrates. Different researchers have proposed different definitions of hydrate induction time based on different experimental systems.30–35 In this work, induction time is described from the macroscopic aspect, including critical nuclei stage and visible crystal stage. In other words, the induction time is determined by a start point and an end point that is easy to observe and characterized by the large amount of hydrate formation.The time when the system temperature inside the tube is lowered to the three-phase equilibrium point of CO2 hydrate is regarded as the start point (Ts) of the induction time. The acquisition of the phase equilibrium point of the experimental system is calculated based on the CSMHyd36 software compiled by Colorado School of Mines. The time point when the temperature in the loop rises suddenly and pressure drops suddenly during the cooling process is defined as the end point (Te) of the induction time. The time interval between the start point and end point is defined as the induction time of the flow system (Tind = Te − Ts). This is similar to the method proposed by Lv et al.32 for measuring the induction time of methane hydrates in oil–water emulsion systems. Taking experiment 9 as an example, Fig. 2 shows the definition method of induction time in this system.
2.6. Calculation of experimental gas consumption and hydrate volume fraction
In the process of hydrate formation, the amount of gas consumption can not only reflect the rate of hydrate formation, but also reflect the final gas storage capacity and gas storage density of hydrate. The introduction of solid hydrate particles into the fluid is bound to affect the fluidity of the experimental fluid. Accordingly, the volume fraction of hydrate plays a crucial role in the flow and plugging characteristics of the slurry. Based on the principle of conservation of the amount of matter in the reaction system, the gas consumption during CO2 hydrate formation is obtained by calculating the difference of the gas molar amount between the end point of induction time and subsequent time. Then hydrate formation volume fraction can be determined by pressure, temperature and gas consumption of the experimental system.37 For more details on calculations, see Appendix C.3. Results and discussion
3.1. Analysis of CO2 hydrate formation and slurry flow in flow systems
Fig. 3 displays the variation of different parameters such as pressure, temperature, gas consumption and hydrate volume fraction with time in the high pressure flow systems. Fig. 4 shows the variation trend of differential pressure and mass flow rate versus time. As seen, the CO2 hydrate formation and slurry flow process in flow systems of this work can be divided into following stages.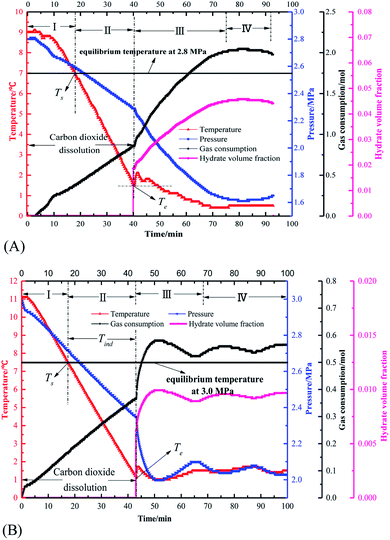 | ||
| Fig. 3 The curve of temperature, pressure, gas consumption, hydrate volume fraction versus time in flow systems (A: pure water system, experiment 2) (B: oil–water emulsion system, experiment 14). | ||
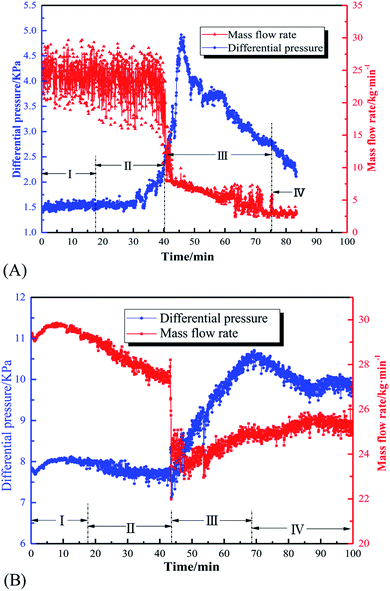 | ||
| Fig. 4 The curve of pressure difference, mass flow rate versus time in flow systems (A: pure water system, experiment 2) (B: oil–water emulsion system, experiment 14). | ||
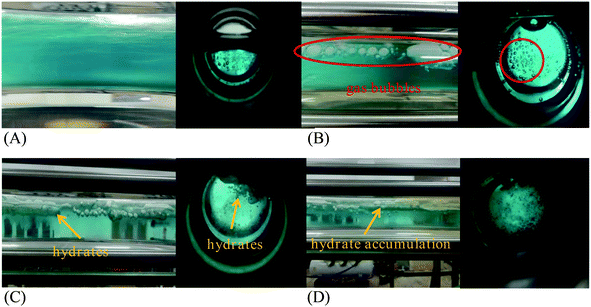
In the initial stage, the gas consumption curve shows a gradual increase due to gas dissolution. And there is no hydrate formation at this stage. As shown in Fig. 5A and 6A, a stable gas–liquid two-phase flow in the loop can be observed from the transparent section and the visual window. Part of gas phase is unevenly dispersed in the liquid phase, and the system possess well fluidity. Fig. 6A also illustrates that the emulsion in the flow system is stable before hydrate formation, predominately due to the function of the efficient flow shear.
Fig. 4 depicts that, in both pure water system and oil–water system, with large amount of hydrate formation, the mass flow rate synchronously shows a sudden drop. This can be explained by the sudden increase in the viscosity of the fluid in the loop after hydrate formation. Although the oil–water system has the approaching pressure and temperature compared with the pure water system, 10 min after hydrate formation, the hydrate volume fraction of pure water system is significantly higher than that of the emulsion system (0.03 > 0.01). Thus, the increment of differential pressure of pure water system after hydrate formation is much larger than that of the emulsion system, as shown in Fig. 4.
Moreover, for both systems shown in Fig. 4, the differential pressure first increases rapidly and then gradually decreases. It can be analyzed by the Darcy–Weisbach formula38 that the differential pressure is proportional to the friction coefficient and the square of the flow velocity. The pressure difference increases rapidly because the friction coefficient dominates at this time. When the hydrate is formed in a large amount, the coefficient of friction of the system increases due to the transition of liquid–liquid dispersion to liquid–solid dispersion and the effect of hydrate agglomeration,24 which leads to a rapid increase of the pressure difference. Afterwards, the change of the pressure difference is dominated by the flow rate of the system, and the continuous formation of the hydrate makes the viscosity of the fluid become larger and the flow rate decreases, so the pressure difference gradually reduces, which is consistent with the findings of Shi et al.19,37 and Song et al.26 At the same time, it is found that the pressure difference increase in the oil–water system is larger than that in the pure water system.
Fig. 5C shows the macroscopic morphology of the CO2 hydrate in the pure water system at this stage. It can be clearly seen that amounts of hydrate particles emerge in the circular window, and a thick hydrate layer is formed and adhere to the upper side of the transparent segment. Because the adhesion force between hydrate layer and the pipe wall is stronger than the flow shear. There are also a lot of flocculent and granular hydrates in the loop, which flow with the liquid phase.
Fig. 5D shows the distribution of hydrates in the pure water system at this stage. The flake-like and flocculent hydrates in the tube mostly accumulate at the upper wall surface of the tube, which decrease the flow area and result in the final blockage. For the oil–water emulsion system, Fig. 6D shows that there are obvious stratification of the oil–water two-phase at the later time of this stage. This phenomenon is similar to the results reported by Akhfash et al.39 who have conducted methane hydrate formation experiments in a high-pressure sapphire autoclave. For the emulsion system in this work, it is supposed that the pipe flow is not capable to hold large hydrate aggregates, and the deposition of these aggregates results in the decrease in flow rate, which forms a vicious cycle. Consequently, the emulsion is no longer stable and blockage occurs in the oil–water system (see Fig. 6F). Fig. 6D also illustrate that most of the CO2 hydrate particles are concentrated at the oil–water interface after the stratification, since the density of hydrate aggregates is smaller than that of water.
In summary, for the pure water system, hydrates gradually deposit onto the upper pipe wall, and finally forms a dense hydrate layer. For the oil–water systems, the formed hydrates mostly accumulate at the oil–water interface leading to oil–water stratification. The existence of oil phase not only impact on the hydrate formation kinetics, but also pose influence on hydrate behaviors and plugging mechanism for water-dominated systems.
3.2. Hydrate formation in pure water systems
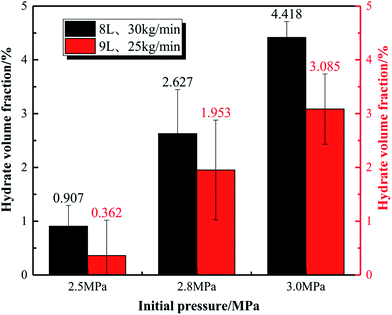
Fig. 8 displays the effect of initial pressure on gas consumption during hydrate formation process of the system with 8 L liquid loading and 30 kg min−1 initial flow rate. In the figure, a, b, and c are the hydrate formation moments (Te) of the systems with 2.5, 2.8 and 3 MPa initial pressure, respectively. Before Te, the gas consumption increases steadily due to the solubility of CO2 in water. After Te, the gas consumption suddenly increases, and continues to increase till it becomes stable. Fig. 9 shows that, during hydrate growth process, CO2 consumption increases with increasing initial pressure. And correspondingly, the hydrate volume fraction also increases with increasing pressure.
 | ||
| Fig. 8 Gas consumption of the systems with 8 L liquid loading versus time under different initial pressures. (a, b and c) Refers to the time point that hydrate formation begins. | ||
Gas consumption rate can be obtained by the first-order derivation of gas consumption versus time. As shown in Fig. 10, during the hydrate growth process, the gas consumption rate shows a trend of increasing first and then decreasing, which indicates that hydrate growth is controlled by different factors at different stages. In the early stage of hydrate growth, there are large amounts of gas bubbles dispersed in the liquid phase (see Fig. 5A and B), and gas–water two phase flow forms in the loop. Therefore, CO2 gas and water can contact with each other sufficiently, due to the large gas–water interfaces. Hydrate formation is mainly controlled by intrinsic kinetics in the early stage. As the hydrate growth continues, gas bubbles are transformed in to hydrates, and hydrate particles accumulates at the oil–water interface (see Fig. 5C), which affects the mass transfer process of gas to contact with water. Meanwhile, system temperature rises due to heat generation by hydrate growth. Limitations of mass transfer and heat transfer are introduced, and the gas consumption rate decreases. Mass and heat transfer are the predominating control factors of hydrate growth at the later stage.
Fig. 11 displays the variation trend of the gas consumption of the systems with different liquid loadings under 3 MPa initial pressure and 35 kg min−1 initial flow rate. As seen, the total gas consumption decreases as the liquid holding capacity of the pipeline increases. Fig. 12 shows the hydrate volume fraction of the systems with different initial pressures versus liquid loading. For different experimental systems, the volume fraction of hydrate decreases with increasing liquid loading, which is consistent with the change in gas consumption. The reasons can be summarized as follows: firstly, the main factor that restricts the growth of hydrates in the gas–liquid two-phase system is the mass transfer of the gas phase to the liquid phase, and the increase in liquid loading is equivalent to reducing the volume of the gas phase, and then the total area of gas–liquid contact is reduced. Secondly, since the experimental conditions are constant volume systems, as the amount of liquid loading increases, the amount of gas phase is less, and the amount of dissolved gas per unit volume of liquid phase is reduced, hindering the mass transfer of the gas phase to the liquid phase. At the same time, the rapid drop in pressure leads to a reduction in the driving force for hydrate formation. Therefore, the total gas consumption decreases as the liquid holding capacity of the pipeline increases. This is similar to the results of Vijayamohan et al.42 who studied the effect of liquid holding capacity on hydrate formation. They found that the liquid holding capacity is too small to limit the mass transfer of gas molecules.
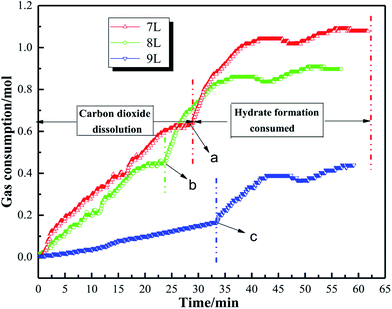 | ||
| Fig. 11 Gas consumption of the system with 3 MPa initial pressure and 35 kg min−1 initial flow rate versus time under different liquid loadings. | ||
Fig. 14 reflects the effects of mass flow rate of the experimental system on gas consumption. Under the experimental conditions of 2.8 MPa and 7 L, the gas consumption at the three points a, b, and c suddenly rises. Before that, the gas consumption trends at different flow rates were similar, and by the end of the experiment, the final gas consumption decreases as the mass flow rate increases. This can be explained by the fact that the hydrate formation in the system with larger flow rate is earlier, and the generated hydrates exists at the gas–liquid interface. The contact area between the gas phase and the liquid phase is reduced, and finally the gas consumption of the system with a larger flow rate is relatively low. In other words, hydrate formation in the later stage of the system is inhibited at a larger flow rate. It can also be apparently seen from Fig. 15 that the hydrate volume fraction also decreases as the flow rate increases.
3.3. Hydrate formation and flow characteristics in oil–water emulsion system
Water content is a key parameter of the oil–water emulsion system, which will inevitably affect the flow parameters of the hydrate slurry. Through experiments 13–16 (only the water content is changed, and other parameters are consistent), the effect of water content on friction coefficient, pressure drop and hydrate slurry viscosity of the high pressure flow system can be studied.The friction coefficient of the liquid phase from the heterogeneous oil–water emulsion to the hydrate slurry in the loop can be determined by the Darcy–Weisbach formula as follows:
 | (1) |
Therefore, the friction coefficient can be expressed as:
 | (2) |
Assume that the fluid flow in this experiment is in laminar flow region, while laminar flow resistance is mainly the internal friction of the fluid, and the resistance is in accordance with Hagen–Poiseuille's law:
 | (3) |
Therefore, the apparent viscosity of the hydrate slurry can be obtained by the relationship between the shear force of the pipe wall and the pressure drop of laminar flow:
 | (4) |
The Reynolds formula that takes the calculated apparent viscosity into the laminar flow region:
 | (5) |
All Reynolds numbers (Re) calculated by eqn (5) are less than 2000, which verifies that the flow of the experimental fluid is indeed laminar flow.
Fig. 16 shows the flow velocity, friction coefficient and viscosity of the fluid under the experimental conditions of 3 MPa initial pressure, 9 L liquid loading, 30 kg min−1 initial flow rate, and 70% water content. As seen, after large amount of hydrate formation, the flow velocity of the fluid decreases rapidly, and the viscosity and friction coefficient of hydrate slurry increase rapidly. During hydrate slurry flow phase, the above parameters gradually stabilize. The Reynolds number of the whole process fluctuates between 200 and 500, indicating the pipe flow is in laminar flow region.
 | ||
| Fig. 16 Flow rate, friction coefficient, slurry viscosity and Reynolds number curve during hydrate formation (3 MPa, 9 L, 30 kg min−1, 70 wt%). | ||
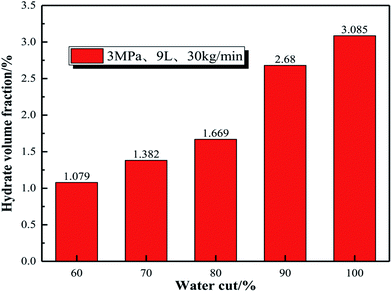
Fig. 19 shows that the volume fraction of hydrate particles in the oil–water system gradually increases with the increasing water content, and the volume fraction of hydrate particles of the systems with 60%, 70%, 80% and 90% water cut is 1.079%, 1.382%, 1.669% and 2.68%, respectively. The hydrate volume fraction of the pure water system under the same conditions is 3.085%, which is much higher than that of emulsion systems.
4. Sensitivity analysis of factors affecting hydrate induction time
In the process of hydrate formation, temperature, pressure, subcooling, supersaturation, salt content of the solution, gas phase composition, surfactant, kinetic inhibitor, polymerization inhibitor, stirring speed, fluid flow rate and water content etc. all have impacts on induction time. It is impossible to determine the degree of influence of each factor by using the single factor method. The “standard regression coefficient method” was adopted to analyze the sensitivity of the factors affecting the induction time, such as initial pressure, liquid loading, flow rate and water content, and to determine the sensitivity of each factor.The theoretical basis is as follows:43 for the dependent variable Y, it subjects to the common influence of the independent variables X1,X2,X3,…,Xm, and a total of n experiments are carried out, so that:
 | (6) |
 | (7) |
 | (8) |
 | (9) |
 | (10) |
| Y = a + b1X1 + b2X2 + … + bmXm | (11) |
The constant term and the regression coefficients b1,b2,…,bm can be found by the following equation:
 | (12) |
 | (13) |
The standard regression coefficient is:
 | (14) |
In the formula,  represent the standard regression coefficient and it is independent of the units taken by Y and
 ![[X with combining macron]](https://www.rsc.org/images/entities/i_char_0058_0304.gif) i. The larger the absolute value of
i. The larger the absolute value of  , the greater the influence of Xi on Y. Thereafter, experimental conditions and induction times of different systems are summarized, which are tabulated in Table 2.
| Initial pressure/MPa | Liquid loading/L | Mass flow/kg min−1 | Water content/% | Induction time/min |
|---|---|---|---|---|
| 2.5 | 8 | 30 | 100 | 24.2 |
| 2.8 | 8 | 30 | 100 | 20.7 |
| 3.0 | 8 | 30 | 100 | 16.3 |
| 3.0 | 7 | 35 | 100 | 26.5 |
| 3.0 | 8 | 35 | 100 | 18.8 |
| 3.0 | 9 | 35 | 100 | 23.5 |
| 2.8 | 7 | 25 | 100 | 25.4 |
| 2.8 | 7 | 30 | 100 | 22.5 |
| 2.8 | 7 | 35 | 100 | 18.4 |
| 3.0 | 9 | 29 | 60 | 33.5 |
| 3.0 | 9 | 30 | 70 | 28.6 |
| 3.0 | 9 | 30 | 80 | 26.4 |
| 3.0 | 9 | 31 | 90 | 23.8 |
The initial pressure, liquid loading, flow rate and water content are taken as the independent variables X1,X2,X3,X4, the induction time is the dependent variable Y, and are calculated from eqn (6–11). Equations for solving the regression coefficients are listed below:
Then the coefficients are obtained as:
| b1 = −0.072, b2 = −2.3515, b3 = 0.0699, b4 = −0.4118 |
From eqn (14), the standard regression coefficients  are:
are:
From the calculation results, it can be seen that:
Therefore, through sensitivity analysis, the system water content has the most significant influence on the induction period of CO2 hydrate formation, liquid loading take the second place, mass flow rate next, and initial pressure on induction time the weakest. Moreover, establishing an induction time model for oil–water systems based on classic nucleation theories34,35 will be the focus of next step work. According to the similarity criterion in fluid mechanics, it is supposed that the flow and plugging phenomenon as well as mechanisms in the flow loop will have similarities with the industrial pipelines. It should also be noted that the diameter of the pipe, the experimental pressure and the flow rate are smaller than that of the actual subsea pipelines, due to the limitations of the experimental equipment. The findings obtained from the experiments in the flow loop can still provide meaningful reference for the plugging mechanisms as well as the practical management of industrial pipelines. More experiments using larger pipe diameter and natural gas as experimental materials should be conducted for verification.
5. Conclusions
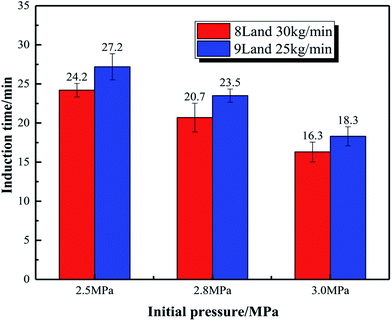
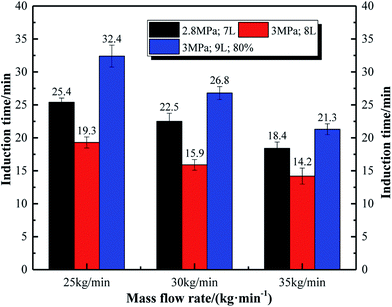
(1) In the constant volume flow systems, the formation process of hydrate was basically similar. Hydrate generated in pure water system mostly accumulated at the upper wall of pipes and formed a thin layer. Part of hydrates were flocculent or flake like and flowed with liquid phase. Hydrates in the oil–water emulsion systems mostly accumulated at the oil–water interface. With the decrease in temperature and flow rate in the tube, the oil and water phase is gradually stratified, and the probability of the hydrate blockage was also increased.(2) In the pure water system, as the initial pressure increased, the hydrate induction time was gradually shortened, and the gas consumption and hydrate volume fraction increased with the increasing initial pressure. The gas consumption and hydrate volume fraction decreased with the increasing liquid loading. Induction time shortened with the increasing flow rate, and gas consumption and hydrate volume fraction decreased with the increasing flow rate.
(3) In the oil–water emulsion system, as the water content increased, the induction time decreased gradually, while the variation of gas consumption and hydrate volume fraction was subtle. In addition, the apparent viscosity and friction coefficient of the hydrate slurry increased with the increasing water content, and the pressure difference increased with the increasing water content. Compared to pure water systems, emulsion systems possessed higher plugging risk.
(4) Sensitivity analysis results indicated that water content was the main factor affecting the hydrate induction time. The effect of the initial pressure on the induction time is minimal. Reducing the water content of the experimental system, reducing the flow rate and increasing the liquid carrying capacity are effective measures to prolong the hydrate induction time, which provides a reference for the safe operation of oil and gas pipelines and hydrate prevention and control.
Appendix A: selection of temperature and pressure transducers
Six temperature and six pressure transducers (marked as TR and PR in Appendix Fig. 21) are distributed on the experimental flow loop. The temperature and pressure at different positions are different. TR1 and PR1 are on the top of the reaction vessel (seperator) of the loop. Under normal circumstances, the reactor is not used. The figure below shows the temperature curves and pressure curves, which are obtained by different transducers, of the system with initial pressure of 3 MPa, liquid loading of 9 L, flow rate of 35 kg min−1 and water content of 100%. As seen, during hydrate formation process, the pressure and temperature trends at different positions are basically the same. For the convenience of measurement and post-calculation, in this paper, the temperature and pressure data of position 6 (i.e., TR6 and PR6) are taken to measure the induction time.Appendix B: details of repeated experiments
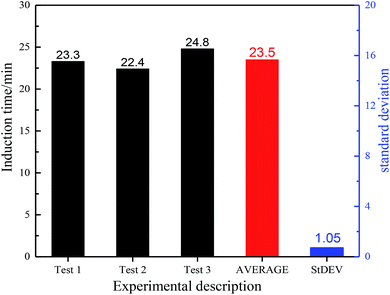
Hydrate induction times of a certain experimental system is affected by a variety of factors and is a scattered value. Therefore, in order to explore the influence of a certain factor on the induction time, it is necessary to carry out repeated tests to obtain more objective conclusions. Here, experiment with initial pressure of 3 MPa, liquid loading of 9 L and mass flow of 35 kg min−1 is taken as an example. The experimental results of experimental pressure and temperature versus time and the induction time and standard deviation of each set of experiments are shown in Appendix Fig. 22. It can be seen from Appendix Fig. 22 and 23 that temperature and pressure curves of different runs shows good coincidence, and the standard deviation of the induction time is pretty small, indicating that the experiment has good repeatability.Appendix C: details of calculation on gas consumption and hydrate volume fraction
During hydrate formation process, the amount of CO2 in the gas phase can be calculated by:where Ploop(t) is the pressure inside the tube before and after the reaction (Pa); Tloop(t) is the temperature inside the tube during the reaction (K); R is the gas constant, the value is 8.3145 J (mol−1 K−1); ZPR(t) is the compression corresponding to time t, the factor is calculated by the PR equation of state.
CO2 is soluble in water and can form hydrates when the reaction system is saturated. Therefore, the gas dissolved in the liquid phase (nCO2,l) must be included in the calculation. The molar amount of dissolved CO2 in the liquid phase can be calculated by the model proposed by Duan et al.44
Gas consumption during hydrate formation can be obtained by the following formula:
| nCO2,consumed|t = (nCO2,l|t=0 + nCO2,g|t=0) − (nCO2,l|t + nCO2,g|t) |
After the gas consumption is obtained, the hydrate volume fraction can be calculated by the following formulas.
where φhyd,t represents the volume fraction of the system hydrate formation at time t; Vhyd,t is the volume of hydrate formed at time t, m3; VLiq,t represents the volume of water in the tube at time t, m3; ng,t is the amount of gas consumed by CO2 at time t, mol; Mg and Mw represent CO2 and the molar mass of water molecules, g mol−1; ρH indicates the density of hydrate, kg m3; β is the hydration number.
Conflicts of interest
There are no conflicts of interest to declare.Acknowledgements
This work was supported by the National Natural Science Foundation of China (Grant No. 51804046 & 51904330 & 51974037), PetroChina Innovation Foundation (Grant No. 2018D-5007-0602) and Natural Science Research Project of Jiangsu Colleges and Universities (Grant No. 18KJB440001).References
- E. Sloan and C. Koh, Clathrate Hydrates of Natural Gases, CRC Press, 2008, pp. 13–14 Search PubMed.
- S. V. Joshi, G. A. Grasso, P. G. Lafond, I. Rao, E. Webb, L. E. Zerpa and A. K. Sum, Experimental flow loop investigations of gas hydrate formation in high water cut systems, Chem. Eng. Sci., 2013, 97, 198–209, DOI:10.1016/j.ces.2013.04.019.
- Q. Lv, X. Li and G. Li, Seawater Desalination by Hydrate Formation and Pellet Production Process, Energy Procedia, 2019, 158, 5144–5148, DOI:10.1016/j.egypro.2019.01.684.
- S. Hong, S. Moon and Y. Lee, et al., Investigation of thermodynamic and kinetic effects of cyclopentane derivatives on CO2 hydrates for potential application to seawater desalination, Chem. Eng. J., 2019, 363, 99–106, DOI:10.1016/j.cej.2019.01.108.
- B. Prah and R. Yun, CO2 hydrate slurry transportation in carbon capture and storage, Appl. Therm. Eng., 2018, 128, 653–661, DOI:10.1016/j.applthermaleng.2017.09.053.
- L. Zhang, L. Yang and J. Wang, et al., Enhanced CH4 recovery and CO2 storage via thermal stimulation in the CH4/CO2 replacement of methane hydrate, Chem. Eng. J., 2017, 308, 40–49, DOI:10.1016/j.cej.2016.09.047.
- E. Chaturvedi, N. Prasad and A. Mandal, Enhanced formation of methane hydrate using a novel synthesized anionic surfactant for application in storage and transportation of natural gas, J. Nat. Gas Sci. Eng., 2018, 56, 246–257, DOI:10.1016/j.jngse.2018.06.016.
- Z. W. Ma, P. Zhang, H. S. Bao and S. Deng, Review of fundamental properties of CO2 hydrates and CO2 capture and separation using hydration method, Renewable Sustainable Energy Rev., 2016, 53, 1273–1302, DOI:10.1016/j.rser.2015.09.076.
- W. Liu, J. Hu, X. Li, Z. Sun, F. Sun and H. Chu, Assessment of hydrate blockage risk in long-distance natural gas transmission pipelines, J. Nat. Gas Sci. Eng., 2018, 60, 256–270, DOI:10.1016/j.jngse.2018.10.022.
- Z. Wang, Y. Zhao, J. Zhang, S. Pan, J. Yu and B. Sun, Flow assurance during deepwater gas well testing: Hydrate blockage prediction and prevention, J. Pet. Sci. Eng., 2018, 163, 211–216, DOI:10.1016/j.petrol.2017.12.093.
- A. H. Saeedi Dehaghani and M. H. Badizad, Thermodynamic modeling of gas hydrate formation in presence of thermodynamic inhibitors with a new association equation of state, Fluid Phase Equilib., 2016, 427, 328–339, DOI:10.1016/j.fluid.2016.07.021.
- S. Dong, M. Li and A. Firoozabadi, Effect of salt and water cuts on hydrate anti-agglomeration in a gas condensate system at high pressure, Fuel, 2017, 210, 713–720, DOI:10.1016/j.fuel.2017.08.096.
- L. Ding, B. Shi, Y. Liu, S. Song, W. Wang, H. Wu and J. Gong, Rheology of natural gas hydrate slurry: Effect of hydrate agglomeration and deposition, Fuel, 2019, 239, 126–137, DOI:10.1016/j.fuel.2018.10.110.
- H. Zhao, M. Sun and A. Firoozabadi, Anti-agglomeration of natural gas hydrates in liquid condensate and crude oil at constant pressure conditions, Fuel, 2016, 180, 187–193, DOI:10.1016/j.fuel.2016.03.029.
- L.-T. Chen, C.-Y. Sun, G.-J. Chen, J. Y. Zuo and H.-J. Ng, Assessment of hydrate kinetic inhibitors with visual observations, Fluid Phase Equilib., 2010, 298, 143–149, DOI:10.1016/j.fluid.2010.07.024.
- Y. H. Sohn and Y. Seo, Effect of monoethylene glycol and kinetic hydrate inhibitor on hydrate blockage formation during cold restart operation, Chem. Eng. Sci., 2017, 168, 444–455, DOI:10.1016/j.ces.2017.05.010.
- Y. Chi, C. Sarica and N. Daraboina, Experimental investigation of two-phase gas-oil stratified flow wax deposition in pipeline, Fuel, 2019, 247, 113–125, DOI:10.1016/j.fuel.2019.03.032.
- X. Shen, G. Hou, J. Ding, X. Zhou, C. Tang, Y. He and D. Liang, Flow characteristics of methane hydrate slurry in the transition region in a high-pressure flow loop, J. Nat. Gas Sci. Eng., 2018, 55, 64–73, DOI:10.1016/j.jngse.2018.04.023.
- B.-H. Shi, S.-F. Song, X.-F. Lv, W.-Q. Li, Y. Wang, L. Ding and J. Gong, Investigation on natural gas hydrate dissociation from a slurry to a water-in-oil emulsion in a high-pressure flow loop, Fuel, 2018, 233, 743–758, DOI:10.1016/j.fuel.2018.06.054.
- Y. Liu, B. Shi, L. Ding, Q. Ma, Y. Chen and S. Song, et al., Study of hydrate formation in water-in-waxy oil emulsions considering heat transfer and mass transfer, Fuel, S2019, 244, 282–295, DOI:10.1016/j.fuel.2019.02.014.
- X. Lv, B. Shi, S. Zhou, S. Wang, W. Huang and X. Sun, Study on the decomposition mechanism of natural gas hydrate particles and its microscopic agglomeration characteristics, Appl. Sci., 2018, 8(12), 2464, DOI:10.3390/app8122464.
- A. Melchuna, A. Cameirao, J.-M. Herri and P. Glenat, Topological modeling of methane hydrate crystallization from low to high water cut emulsion systems, Fluid Phase Equilib., 2016, 412, 158–169, DOI:10.1016/j.fluid.2015.11.023.
- V. Pauchard, M. Darbouret and T. Palermo, et al., Gas hydrate slurry flow in a black oil. Prediction of gas hydrate particles agglomeration and linear pressure drop, 13th International Conference on Multiphase Production Technology, 2007, pp. 343–355 Search PubMed.
- A. Sinquin, T. Palermo and Y. Peysson, Rheological and flow properties of gas hydrate suspensions, Oil Gas Sci. Technol., 2004, 59(1), 41–57, DOI:10.2516/ogst:2004005.
- L. Ding, B. Shi and X. Lv, et al., Hydrate Formation and Plugging Mechanisms in Different Gas–Liquid Flow Patterns, Ind. Eng. Chem. Res., 2017, 56(14), 4173–4184, DOI:10.1021/acs.iecr.6b02717.
- G. Song, Y. Li, W. Wang, K. Jiang, X. Ye and P. Zhao, Investigation of hydrate plugging in natural gas+diesel oil+water systems using a high-pressure flow loop, Chem. Eng. Sci., 2017, 158, 480–489, DOI:10.1016/j.ces.2016.10.045.
- H. Moradpour, A. Chapoy and B. Tohidi, Bimodal model for predicting the emulsion-hydrate mixture viscosity in high water cut systems, Fuel, 2011, 90(11), 3343–3351, DOI:10.1016/j.fuel.2011.06.038.
- S. Zhou, H. Yan and D. Su, et al., Investigation on the kinetics of carbon dioxide hydrate formation using flow loop testing, J. Nat. Gas Sci. Eng., 2018, 49, 385–392, DOI:10.1016/j.jngse.2017.10.022.
- S. Zhou, X. Chen and C. He, et al., Experimental Study on Hydrate Formation and Flow Characteristics with High Water Cuts, Energies, 2018, 11(10), 2610, DOI:10.3390/en11102610.
- S. Wang, M. Yang, W. Liu, J. Zhao and Y. Song, Investigation on the induction time of methane hydrate formation in porous media under quiescent conditions, J. Pet. Sci. Eng., 2016, 145, 565–572, DOI:10.1016/j.petrol.2016.06.003.
- D. Kashchiev and A. Firoozabadi, Induction time in crystallization of gas hydrates, J. Cryst. Growth, 2003, 250(3–4), 499–515, DOI:10.1016/s0022-0248(02)02461-2.
- X. F. Lv, B. H. Shi, Y. Wang, Y. X. Tang, L. Y. Wang and J. Gong, Experimental Study on Hydrate Induction Time of Gas-Saturated Water-in-Oil Emulsion using a High-Pressure Flow Loop, Oil Gas Sci. Technol., 2014, 70(6), 1111–1124, DOI:10.2516/ogst/2014032.
- P. Skovborg, H. J. Ng, P. Rasmussen and U. Mohn, Measurement of induction times for the formation of methane and ethane gas hydrates, Chem. Eng. Sci., 1993, 48(3), 445–453, DOI:10.1016/0009-2509(93)80299-6.
- P. J. Metaxas, V. W. Lim, C. Booth, J. Zhen, P. L. Stanwix, M. L. Johns, Z. M. Aman, G. Haandrikman, D. Crosby and E. F. May, Gas hydrate probability distributions: Induction times, rates of nucleation and growth, Fuel, 2019, 252, 448–457, DOI:10.1016/j.fuel.2019.04.131.
- E. F. May, V. W. Lim, P. J. Metaxas, J. Du, P. S. Stanwix, D. Rowland, M. L. Johns, G. Haandrikman, D. Crosby and Z. M. Aman, Gas Hydrate Formation Probability Distributions: The effect of shear & comparisons with nucleation theory, Langmuir, 2018, 34(10), 3186–3196, DOI:10.1021/acs.langmuir.7b03901.
- S. M. Babakhani, M. Bahmani, J. Shariati, K. Badr and Y. Balouchi, Comparing the capability of artificial neural network (ANN) and CSMHYD program for predicting of hydrate formation pressure in binary mixtures, J. Pet. Sci. Eng., 2015, 136, 78–87, DOI:10.1016/j.petrol.2015.11.002.
- B. Shi, L. Ding, Y. Liu, J. Yang, S. Song and H. Wu, et al., Hydrate slurry flow property in W/O emulsion systems, RSC Adv., 2018, 8, 11436–11445, 10.1039/c7ra13495a.
- J. D. Valiantzas, Explicit Power Formula for the Darcy–Weisbach Pipe Flow Equation: Application in Optimal Pipeline Design, J. Irrig. Drain. Eng., 2008, 134(4), 454–461, DOI:10.1061/(asce)0733-9437.
- M. Akhfash, Z. M. Aman, S. Y. Ahn, M. L. Johns and E. F. May, Gas hydrate plug formation in partially-dispersed water–oil systems, Chem. Eng. Sci., 2016, 140, 337–347, DOI:10.1016/j.ces.2015.09.032.
- G. Song, Y. Li, W. Wang, K. Jiang, Z. Shi and S. Yao, Investigation on the mechanical properties and mechanical stabilities of pipe wall hydrate deposition by modelling and numerical simulation, Chem. Eng. Sci., 2018, 192, 477–487, DOI:10.1016/j.ces.2018.07.055.
- N. Maeda, D. Wells, P. G. Hartley and K. A. Kozielski, Statistical Analysis of Supercooling in Fuel Gas Hydrate Systems, Energy Fuels, 2012, 26(3), 1820–1827, DOI:10.1021/ef201965z.
- P. Vijayamohan, Experimental investigation of gas hydrate formation, plugging and transportability in partially dispersed and water continuous systems, Dissertations & Theses – Gradworks, 2016, http://hdl.handle.net/11124/170016 Search PubMed.
- S. Jaffard, S. Seuret, H. Wendt, R. Leonarduzzi, S. Roux and P. Abry, Multivariate multifractal analysis, Appl. Comput. Harmon. Anal., 2019, 46(3), 653–663, DOI:10.1016/j.acha.2018.01.004.
- Z. Duan and R. Sun, An improved model calculating CO2 solubility in pure water and aqueous NaCl solutions from 273 to 533 K and from 0 to 2000 bar, Chem. Geol., 2003, 193(3), 257–271 CrossRef CAS.
| This journal is © The Royal Society of Chemistry 2019 |


