
 Open Access Article
 This Open Access Article is licensed under a Creative Commons Attribution-Non Commercial 3.0 Unported Licence
Giant surfactant-stabilized N2-foam for enhanced oil recovery after water flooding†
Yongqing
Bai
a,
Shaoqun
He
b,
Yue
Lian
a,
Caili
Dai
 b and
Huaihao
Zhang
*a
b and
Huaihao
Zhang
*a
aSchool of Chemistry and Chemical Engineering, Yangzhou University, Yangzhou 225002, P. R. China. E-mail: baiyongqing6@163.com
bSchool of Petroleum Engineering, China University of Petroleum, Qingdao 266580, P. R. China
First published on 4th October 2019
Abstract
A novel giant surfactant, APOSS-PS50, possessing good surface activity, and viscosifying and reinforcing ability as a foam stabilizer, was synthesized successfully to enhance the physical properties of foaming solutions and foam. APOSS-PS50 was widely distributed at the foam gas–liquid interface and adjacent liquid layers through diffusion and adsorption, obviously decreasing the surface tension and improving the foamability and stability of the foam. Furthermore, the aggregation of APOSS-PS50 in the foam films resulted in the formation of a self-assembled nano-sized network through supramolecular interactions (such as hydrogen bonding, π–π stacking, and van der Waals attraction), thus increasing the foam viscoelasticity, including its interfacial viscoelastic modulus and apparent viscosity. Meanwhile, from the sandpack flooding experiments, compared with HPAM/AOS (HPAM: partially hydrolyzed acrylamide and AOS: alpha olefin sulfonate), the differential pressure and final oil recovery after APOSS-PS50/AOS foam flooding increased by 23.5% and 23.2%, up to 2.68 MPa and 81.7%, respectively. In general, APOSS-PS50 significantly promoted the plugging, profile control and oil displacement performance of foam.
1. Introduction
Foam, with high apparent viscosity and excellent plugging and profile control capability, is extensively applied in EOR (enhanced oil recovery) projects. Specifically, its high viscosity, which is much larger than that of its own gas and liquid phases, effectively increases the mobility control capacity, and alleviates some problems from N2 flooding, such as low sweep efficiency and premature breakthrough caused by viscous fingering, gravity segregation and thief zone.1–3 On the other hand, in heterogeneous formation, foam tends to be generated in high-permeability layers and effectively block them, thus facilitating subsequent flooding fluid diversion into low-permeability layers and enlarging the sweep volume of high residual oil regions. In addition, the higher the permeability contrast between the formation layers, the better selective the plugging performance of foam.4–6 As is well-known, the EOR efficiency of foam flooding mainly depends on the foamability, stability and viscoelasticity of the foam. However, as the common foaming agent and foam stabilizer, traditional small-molecule surfactants have poor foam-stabilizing ability. Moreover, the rock surface adsorption and crude oil defoaming effect make their foam difficult to migrate stably in porous media under reservoir conditions.7 Besides, the weak viscoelasticity and mechanical strength of small-molecule surfactant foams make them easily ruptured under external shear stress during formation.8–10Considering the above problems, many researchers have added polymers with good viscosifying and thickening properties to the foaming solution to improve the foam stability and viscoelasticity. Nowadays, the commonly used polymer stabilizers can be divided into two types, namely, hydrophilic polymers (such as polyacrylamide,11 xanthan gum4,9 and guar gum12) and amphiphilic copolymers (hydrophobically modified polyacrylamide, such as B192 (ref. 11) and AVS13). Generally, polymer foam stabilizers have the following advantages: (1) they significantly decelerate foam film drainage by increasing film viscosity.14 (2) Polymer aqueous solutions exhibit great elasticity, enhances foam interfacial viscoelasticity, mechanical strength and shearing resistance.15 (3) They can efficiently thicken the foam film and form multi-layered film structures, thus impeding inter-bubble gas diffusion and foam coalescence by isolating gas.9 (4) Polymers can strengthen foam oil tolerance by forming a steady microemulsion with oil droplets, thus making oil uniformly dispersed in the foam film.16,17 However, polymers as foam stabilizers have some weaknesses: (1) they adsorb a vast amount of surfactant by supramolecular interactions, reducing the amount of surfactant at the foam air–water interface, and hence increase the interface tension and weaken the foamability and foam stability.18 Meanwhile, the adsorbed surfactant lessens the polymer molecule association, leading to a weak viscosifying performance.14 (2) For many types of polymers, their thickening, viscosifying and reinforcing abilities are reduced largely under relatively high formation temperatures.19 (3) The residual polymer concentration during formation can be enriched to 10–15 times of its original value, inevitably causing formation damage.20
Giant surfactants, a type of giant molecule with a small-molecule surfactant structure but polymer size (Fig. 1a), are usually synthesized by tethering hydrophilically modified molecular nanoparticles with hydrophobic polymer chains21–23 using efficient chemical methods (such as click reactions and atom transfer radical polymerization). Therefore, giant surfactants successfully possess the features of traditional surfactants and polymers, namely, high surface activity,21 strong viscosifying and reinforcing properties.24–26 In this work, to improve the foamability, foam stability and viscoelasticity, we synthesized a novel giant surfactant, APOSS-PS50, via a simple modular one-pot approach with multiple orthogonal click reactions. (1) The highly surface-active APOSS-PS50 can reduce the foam air–water interfacial tension (Fig. 1c), and thus promote foamability and foam stability. (2) APOSS-PS50, with highly incompatible segments, specific topology and microphase separation, can generate various supramolecular self-assembly structures (Fig. 1b) in the liquid phase,24,25 and obviously increase the foaming solution viscosity and viscoelasticity. Consequently, APOSS-PS50 enhances the foam due to its good elasticity, displacement ability and slow gravity drainage, showing an excellent EOR performance.
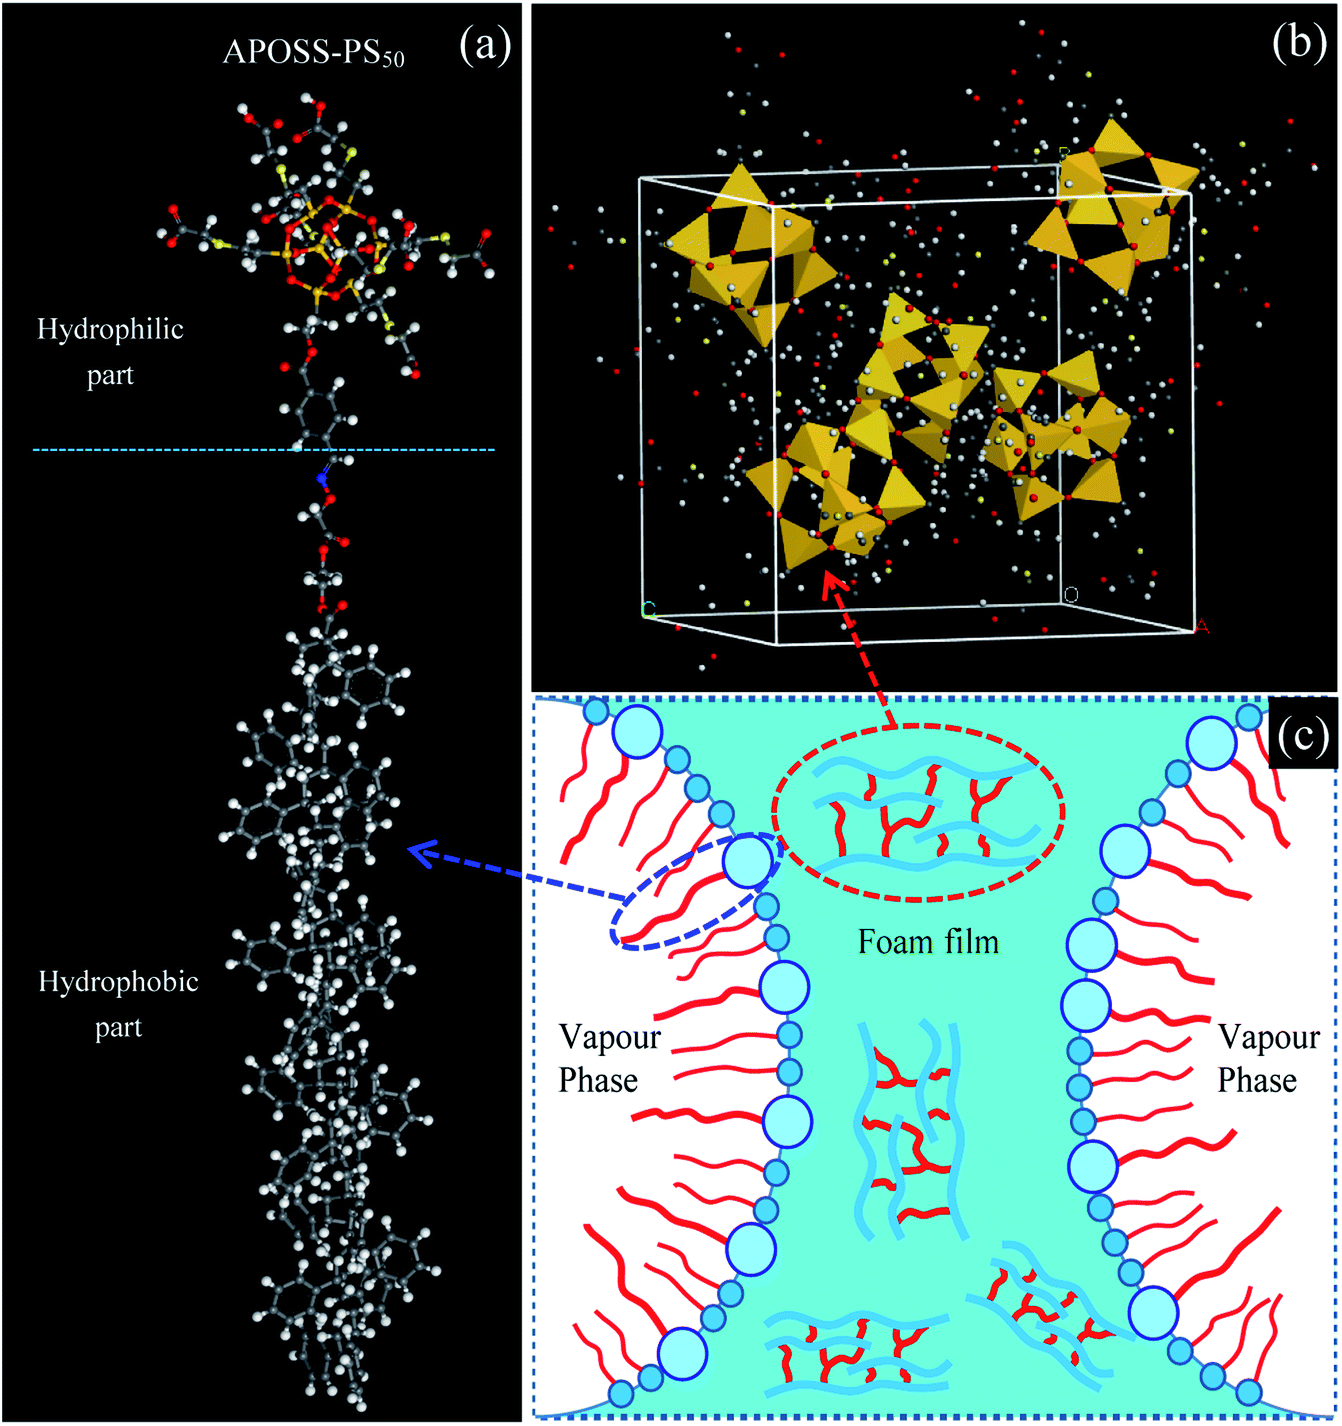 | ||
| Fig. 1 Molecule structure and foam stabilization mechanism of APOSS-PS50 (a) molecule structure, (b) self-assembly in aqueous phase and (c) foam stabilization mechanism of APOSS-PS50. | ||
2. Experimental
2.1 Materials
2,2-Dimethoxy-2-phenylacetophenone (DMPA) and p-toluenesulfonic acid (TsOH) both with a purity of 99.0% were supplied by Macklin (China). VPOSS-CHO and NH2-O-PS50 with purity ≥ 90% were synthesized, as shown in the ESI.† Mercaptoacetic acid (TGA) was purchased from ACMEC (China) with a purity of 98.0%. The anionic surfactant AOS (alpha olefin sulfonate, C14–C16) as the foaming agent was supplied by YNTC (China) with the active component content of ≥92.0%. HPAM (partially hydrolyzed acrylamide) from PYIHOO (China) has a molecular weight of 800 × 104 to 1000 × 104, a hydrolysis degree of 25% and purity >98.0%. Nitrogen was obtained from Xin Source (China) with a purity of 99.9%. The quartz sand used in the sand cores, with two average diameters of 355 μm (45 mesh) and 63 μm (230 mesh), was provided by Macklin (China). The crude oil from Shengli Oilfield, China had a density of 0.916 g cm−3 and viscosity of 54 mPa s at 50 °C.2.2 APOSS-PS50 synthesis and foaming solution preparation
50 mg POSS-based click-reaction precursor VPOSS-CHO, 230 mg “clickable” hydrophobic polymer tail NH2-O-PS50 and 75 mg POSS surface modifier TGA were dissolved in 5 mL tetrahydrofuran. Under TsOH catalysis (oxime ligation), DMPA photoinitiation (TECC, thiol–ene “click” coupling) and UV-light irradiation (wavelength 365 nm), the oxime ligation and TECC reactions occurred simultaneously, producing 273 mg APOSS-PS50 with a yield of 82% in one step. The reaction process is shown in Fig. 2.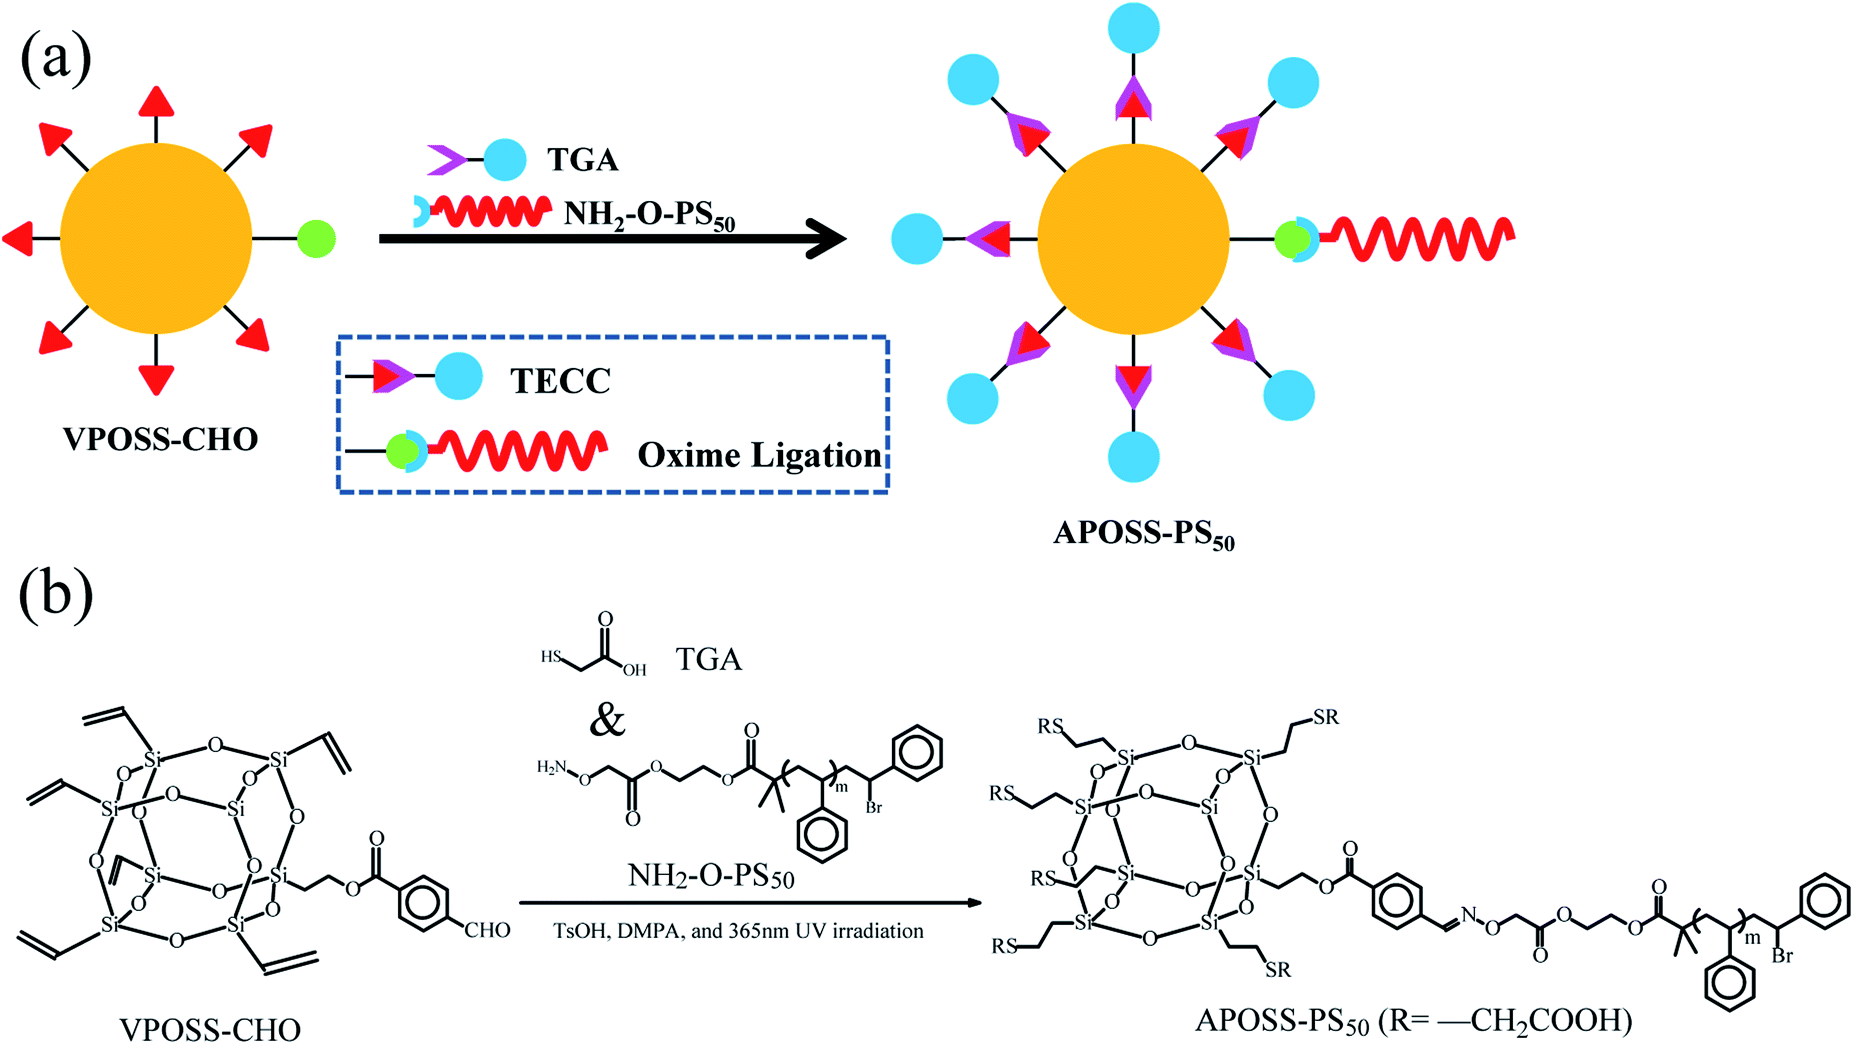 | ||
| Fig. 2 Synthesis procedure of APOSS-PS50. (a) Synthesis reaction mechanism and (b) equation. | ||
2.3 Characterization
Infrared spectra were acquired on an Antains II FTIR spectrometer (Thermo Fisher, USA) using the Omnic software. Herein, solid APOSS-PS50 was pulverized, mixed with KBr powder evenly and pressed into a tablet for analysis. 1H and 13C NMR spectra were obtained in CDCl3 using an AVANCE 600 NMR spectrometer (Bruker, Germany), and were referenced to CDCl3 at δ 7.27 ppm and 77.00 ppm, respectively.29 Si solid-state NMR spectra were acquired on an AVANCE III 400 MHz WB NMR spectrometer (Bruker, Germany) at 79.43 MHz with spin rates in the range of 3.56–5.56 kHz. Specifically, the sample in 5 mm pencil rotors under N2 atmosphere was sealed with paraffin wax. Normal one pulse magic angle spinning (MAS) and cross polarization (CP) MAS with a 30° pulse were performed by relaxation delays of 30 s and 10 s for one pulse MAS and CPMAS, respectively. Meanwhile, X-ray diffraction analysis was performed using a D8 ADVANCE powder X-ray diffractometer (Bruker, Germany) in the 2θ range of 1–40° at a scanning speed of 0.05° × 3 s−1. The ST (surface tension) and oil–water IFT (interfacial tension between simulated oil and aqueous solution) of the aqueous mixtures at 50 °C were determined with dodecane as simulated oil by the pendent-drop method using an OCA20 optical tensiometer and contact angle meter (Data Physics, Germany). The HLB (hydrophilic-lipophilic balance) of the foam stabilizers, evaluated through water number, was acquired using the cloud point methodology (Fig. S1 and Table S1, ESI†).The rheological properties of the foaming solution were evaluated using the modulus (including elastic modulus, G′ and viscous modulus, G′′) and viscosity (its calculation method is shown in ESI 2.6†) at a frequency of 0.01–100 s−1 and a shear rate of 0.1–120 s−1, respectively, which were measured using a DHR-2 rotary rheometer (TA instruments, USA). The microstructure and surface morphology of the foam stabilizers were observed using a Zeiss-Supra 55 field-emission scanning electron microscope (Carl Zeiss, Germany) and CM 100 transmission electron microscope (Philips, Netherlands). A DM2700P polarizing microscope (Leica, Germany) and TCS SP8 STED laser scanning confocal microscope (Leica, Germany) were employed to observe the foam texture and distribution patterns of the stabilizers.
The foaming time under a fixed foam volume of 200 mL and corresponding half-life were determined using an HP Foamscan high temperature and pressure foam analyzer (Teclis, France) at 50 °C. The foam interfacial viscoelastic modulus was measured using an OCA20 optical tensiometer and a contact angle meter (Data Physics, Germany) at 50 °C, with an oscillation frequency in the range of 0.01–0.1 s−1, injection volume of 10 μL and relative foam surface area change ΔA/A of 0.1. The foam apparent viscosity (its calculation method is shown in ESI 2.6†) at 50 °C was obtained from a DV3T rotary viscometer (Brookfield, USA) at a shear rate of 0.1–10 s−1.
2.4 Sandpack flooding experiments
The sandpack flooding experiment set-up is shown in Fig. 3. The sandpacks in these experiments, having almost the same permeability (2.3 ± 0.2 D) and porosity (33.7 ± 0.2%), were prepared by filling a quartz sand mixture into core holders with a fixed mass ratio (m335 μm![[thin space (1/6-em)]](https://www.rsc.org/images/entities/char_2009.gif) :m63 μm = 2:1). The oil displacement experimental procedure was as follows: (1) Sand core saturation: the sand core was first saturated with water, and then crude oil at injection rates of 1 mL min−1 and 0.5 mL min−1 successively. (2) Water flooding: water flooding was carried out at 1 mL min−1 until the oil production was negligible. (3) Foam flooding: foam flooding was performed by injecting a 1.0 PV foam slug, which was generated by simultaneous co-injection of foaming solution and N2 with a constant gas fraction of 0.75 (gas friction and gas–liquid ration screening experiments are shown in ESI 2.5†) and a total injection rate of 0.5 mL min−1. (4) Subsequent water flooding: subsequent water flooding was conducted at a rate of 1 mL min−1 until little oil was produced. Throughout the flooding process, the confining pressure and temperature were maintained at 6 MPa and 50 °C, and the displacement abilities of the foam were evaluated by ΔP (differential pressure) and ultimate oil recovery.
:m63 μm = 2:1). The oil displacement experimental procedure was as follows: (1) Sand core saturation: the sand core was first saturated with water, and then crude oil at injection rates of 1 mL min−1 and 0.5 mL min−1 successively. (2) Water flooding: water flooding was carried out at 1 mL min−1 until the oil production was negligible. (3) Foam flooding: foam flooding was performed by injecting a 1.0 PV foam slug, which was generated by simultaneous co-injection of foaming solution and N2 with a constant gas fraction of 0.75 (gas friction and gas–liquid ration screening experiments are shown in ESI 2.5†) and a total injection rate of 0.5 mL min−1. (4) Subsequent water flooding: subsequent water flooding was conducted at a rate of 1 mL min−1 until little oil was produced. Throughout the flooding process, the confining pressure and temperature were maintained at 6 MPa and 50 °C, and the displacement abilities of the foam were evaluated by ΔP (differential pressure) and ultimate oil recovery.
 | ||
| Fig. 3 Schematic of sandpack flooding experimental apparatus. | ||
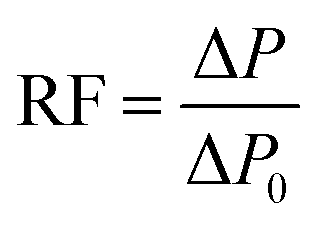
The foam flowing experiment was the same as the oil displacement experiment described above except for the saturation process. Moreover, RF (resistance factor), to evaluate foam plugging and profile control abilities, was calculated according to the ΔP data as follows:
3. Results and discussion
3.1 APOSS-PS50 characterization
The one-pot reaction included two steps: (1) the functionalization of the VPOSS head through TECC reaction, where the vinyl groups on the VPOSS surface were replaced by carboxyl groups. (2) One POSS head VPOSS-CHO was tethered with one polymer chain NH2-O-PS50 by an oxime ligation reaction. Specifically, compared with VPOSS-CHO, the disappearance of the vinyl protons (in the resonance range of δ 6.13–5.91 ppm in the 1H NMR spectrum in Fig. 4a) and sp2 carbon resonances (at δ 128.67 and 136.97 ppm in the 13C NMR spectrum in Fig. 4b), as well as the emergence of protons from the thiol–ether bond (at δ 2.78 and 3.61 ppm in the 1H NMR spectrum), carboxylic acid proton (at δ 12.09 ppm in the 1H NMR spectrum) and carbonyl carbon resonance (at δ 173.76 ppm in the 13C NMR spectrum) of APOSS-PS50 prove the successful TECC reaction. Also, this is evidenced in the FTIR spectrum (Fig. 4d) by the absence of the C![[double bond, length as m-dash]](https://www.rsc.org/images/entities/char_e001.gif) C vibration band (at 3068.63–2968.34 cm−1, triple peaks) of VPOSS-CHO and the appearance of the –OH (at 3000–2500 cm−1, broad peak) and CO vibration bands (at 1678.01 cm−1) of APOSS-PS50. Meanwhile, VPOSS-CHO exhibits two resonances at δ −68.38 ppm (–Si–CH2–CH2–) and −81.27 ppm (–Si–CHCH2), while APOSS-PS50 merely displays a single resonance at δ −67.52 ppm (–Si–CH2–CH2–) in their 29Si SSNMR spectra (Fig. 4c), further revealing the complete TECC reaction.27,28 On the other hand, the disappearance of the aldehyde proton resonance (at 10.04 ppm in VPOSS-CHO 1H NMR spectrum, Fig. 4a) and –NH2 vibration band (at 1571.93 cm−1 in NH2-O-PS50 FTIR spectrum, Fig. 4d), together with the enhanced resonances of the alkyl area of APOSS-PS50 (at 0.6–1.8 ppm in the 1H NMR spectrum, Fig. 4a), indicate the successful oxime ligation. Furthermore, the XRD patterns in Fig. 4e for VPOSS-CHO and APOSS-PS50 show three main characteristic diffraction peaks at 9.6°, 21.1° and 24.5°, attributed to the overall dimensions, body diagonal of POSS and the distance between opposite Si4O4 faces, respectively. Also, the FTIR spectra in Fig. 4d demonstrate a common Si–O–Si vibration band at 1172.68 cm−1, suggesting the integrity of the POSS cage during the one-pot synthesis process. Therefore, all the above results confirm that APOSS-PS50 was synthesized efficiently via the one-pot reaction with simultaneous oxime ligation and TECC reaction.
C vibration band (at 3068.63–2968.34 cm−1, triple peaks) of VPOSS-CHO and the appearance of the –OH (at 3000–2500 cm−1, broad peak) and CO vibration bands (at 1678.01 cm−1) of APOSS-PS50. Meanwhile, VPOSS-CHO exhibits two resonances at δ −68.38 ppm (–Si–CH2–CH2–) and −81.27 ppm (–Si–CHCH2), while APOSS-PS50 merely displays a single resonance at δ −67.52 ppm (–Si–CH2–CH2–) in their 29Si SSNMR spectra (Fig. 4c), further revealing the complete TECC reaction.27,28 On the other hand, the disappearance of the aldehyde proton resonance (at 10.04 ppm in VPOSS-CHO 1H NMR spectrum, Fig. 4a) and –NH2 vibration band (at 1571.93 cm−1 in NH2-O-PS50 FTIR spectrum, Fig. 4d), together with the enhanced resonances of the alkyl area of APOSS-PS50 (at 0.6–1.8 ppm in the 1H NMR spectrum, Fig. 4a), indicate the successful oxime ligation. Furthermore, the XRD patterns in Fig. 4e for VPOSS-CHO and APOSS-PS50 show three main characteristic diffraction peaks at 9.6°, 21.1° and 24.5°, attributed to the overall dimensions, body diagonal of POSS and the distance between opposite Si4O4 faces, respectively. Also, the FTIR spectra in Fig. 4d demonstrate a common Si–O–Si vibration band at 1172.68 cm−1, suggesting the integrity of the POSS cage during the one-pot synthesis process. Therefore, all the above results confirm that APOSS-PS50 was synthesized efficiently via the one-pot reaction with simultaneous oxime ligation and TECC reaction.
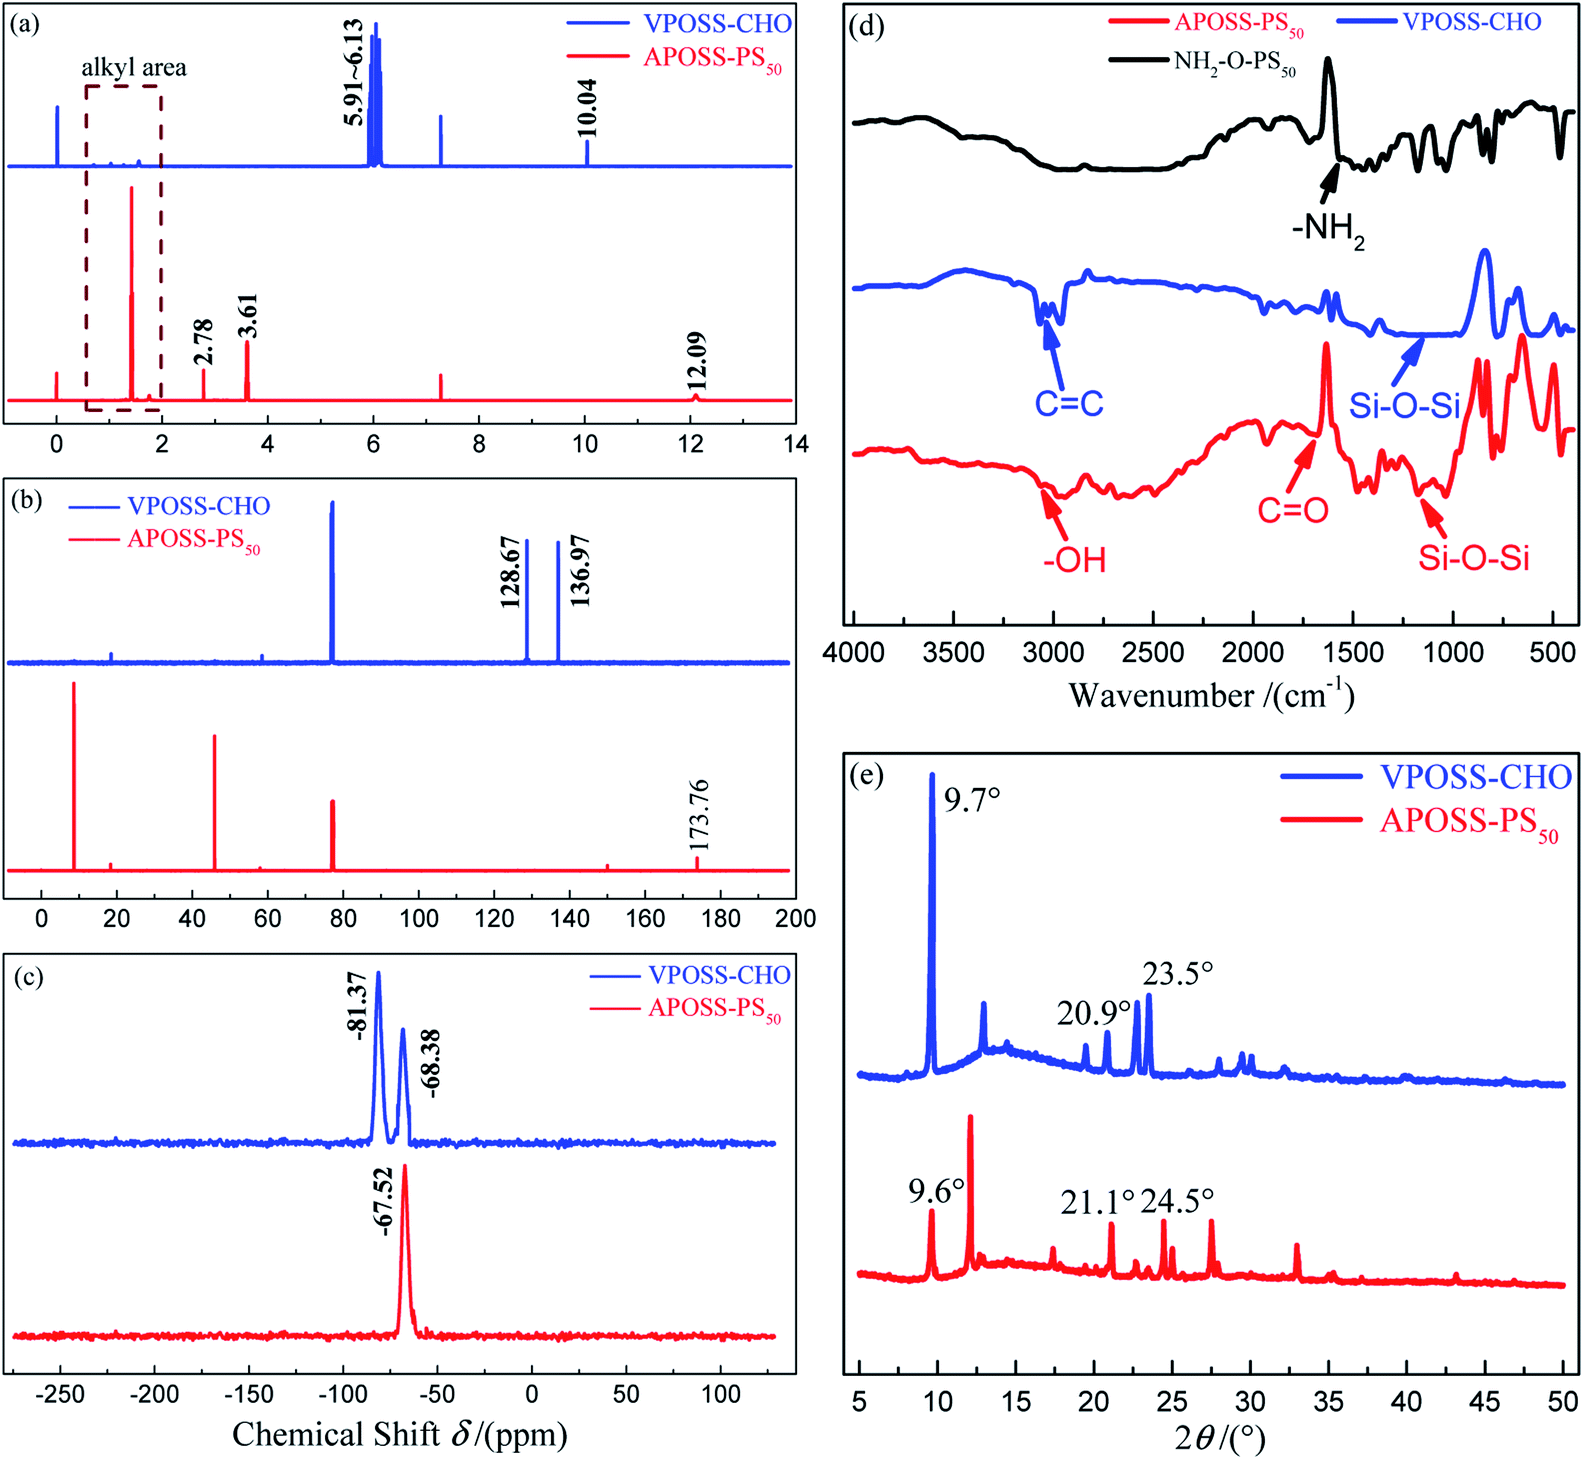 | ||
| Fig. 4 Molecular characterization of samples. (a) 1H NMR, (b) 13C NMR, (c) 29Si SSNMR spectra and (e) XRD patterns of VPOSS-CHO and APOSS-PS50; (d) FTIR spectra of VPOSS-CHO, APOSS-PS50. | ||
3.2 Foaming solution physical properties
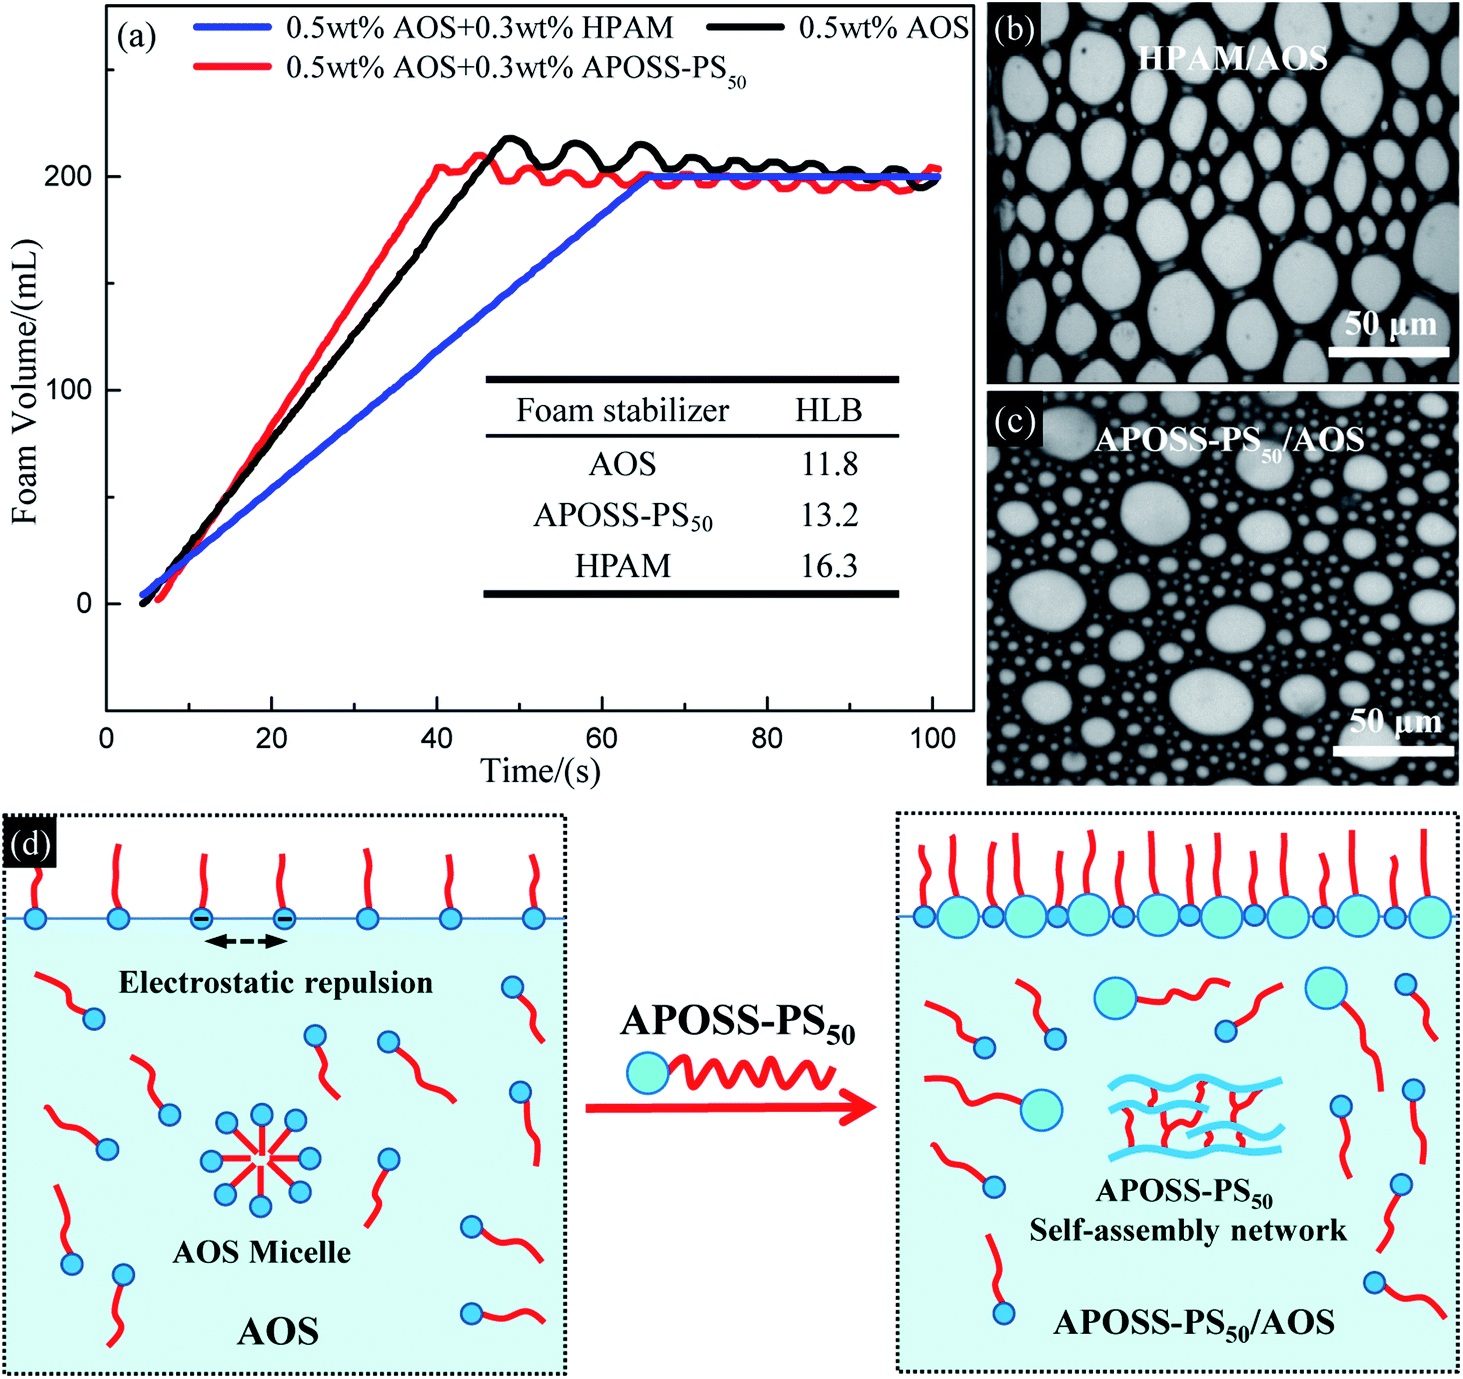 | ||
| Fig. 5 Foamability analysis. (a) Foam volume versus foaming time of foaming solutions; (b) and (c) foam pictures of APOSS-PS50/AOS and HPAM/AOS from Teclis foam analyzer; (d) schematic of APOSS-PS50 enhancing surface activity of foaming solution. | ||
According to Table 1 and the inset in Fig. 5a, the HLB value of APOSS-PS50, ST and IFT of its aqueous solution are similar to that of AOS, but significantly smaller than that of HPAM, indicating the relatively strong hydrophobicity and surface activity of APOSS-PS50. Meanwhile, from Table 1, in contrast to HPAM, the addition of APOSS-PS50 decreased the foaming solution ST and IFT, and strengthened its surface activity compared with that of the unique AOS system. The reasons for this are as follows: (1) different from HPAM, APOSS-PS50 does not adsorb AOS molecules in aqueous solution to avoid their unfavorable influence on foamability. (2) APOSS-PS50, due to its high surface activity, can migrate to the air–water and oil-water interfaces and reduce the ST and IFT of the foaming solution.29 (3) The carboxyl groups in the hydrophilic APOSS head are beneficial to produce strong supramolecular ion–dipole interactions between the AOS and APOSS-PS50 molecules, which causes APOSS-PS50 to be inserted into the electrostatic repulsive AOS molecules and weakens their electrostatic repulsion (Fig. 5d, namely, increases AOS quantity at the interface, and thus decreases the ST and IFT of the foaming solution, and enhances its surface activity and foamability).
| Solution | ST/(mN m−1) | IFT/(mN m−1) |
|---|---|---|
| a ST: surface tension and IFT: interfacial tension between simulated oil and aqueous solution. | ||
| 0.5 wt% AOS | 29.3 | 4.8 |
| 0.5 wt% APOSS-PS50 | 35.1 | 6.7 |
| 0.5 wt% HPAM | 68.5 | 18.3 |
| 0.5 wt% AOS + 0.3 wt% HPAM | 51.7 | 16.4 |
| 0.5 wt% AOS + 0.3 wt% APOSS-PS50 | 27.5 | 4.3 |
δ value from 2.14 to less than 1 (inset in Fig. 6b), indicating that the addition of APOSS-PS50 or HPAM can make the elastic modulus larger than the viscous modulus, leading to solid-like rheological behavior in the foaming solution and improved mechanical property.30 As shown in Fig. 6c–h, the viscosifying and reinforcing behaviors of AOS, HPAM and APOSS-PS50 originate from their individual micelle network (Fig. 6c and f), polymer network (Fig. 6d and g) and supramolecular self-assembly network (Fig. 6e and h) in aqueous solutions. However, the viscosifying and reinforcing performance of AOS was generally limited due to the requirement of a large amount of AOS molecules (5 wt%) to form a micelle network (Fig. 6c). Simultaneously, although HPAM can significantly improve the foaming solution viscoelasticity (Fig. 6a), the strong association among the molecules made it difficult to be dispersed evenly in solution. Namely, the excessive crosslinking of the polymer network in some solution regions led to the agglomeration and precipitation of HPAM.31,32 From the inset table in Fig. 6a, the χ value (Flory–Huggins interaction parameter, ESI†) of APOSS-PS50 was 0.25, indicating the high chemical incompatibility between the APOSS cage and PS tail segment.33–37 Meanwhile, APOSS-PS50, with χN = 14.8 > 10.5 (N is the overall degree of polymerization, ESI†), could form ordered self-assembly nanostructures (Fig. 6h). In addition, the APOSS carboxyl groups, around which the HOMO orbitals (the highest occupied molecular orbital, Fig. 6j) of the APOSS head are located, have the largest negative charge density (Fig. 6i), revealing its high reactivity28 with electrophiles by supramolecular interactions. Furthermore, according to Fig. 6k, as for the APOSS cage surface with carboxyl groups, its negative electrostatic potential shows weak attraction between the nuclei and lone pair electrons, resulting in the enrichment of these electrons and dispersive distribution of their aggregates.38 Therefore, these electrons have a higher energy level and activity, displaying the strong nucleophilicity of the carboxyl groups.38 On the other hand, the LUMO orbitals (the lowest unoccupied molecular orbital, Fig. 6k) of APOSS, located at its POSS skeleton, exhibit that the POSS cage with strong electrophilicity is vulnerable to external nucleophiles.39,40 In general, APOSS-PS50 with high reactivity could form high-strength self-assembly networks, and effectively improve the viscoelasticity of the foaming solution.
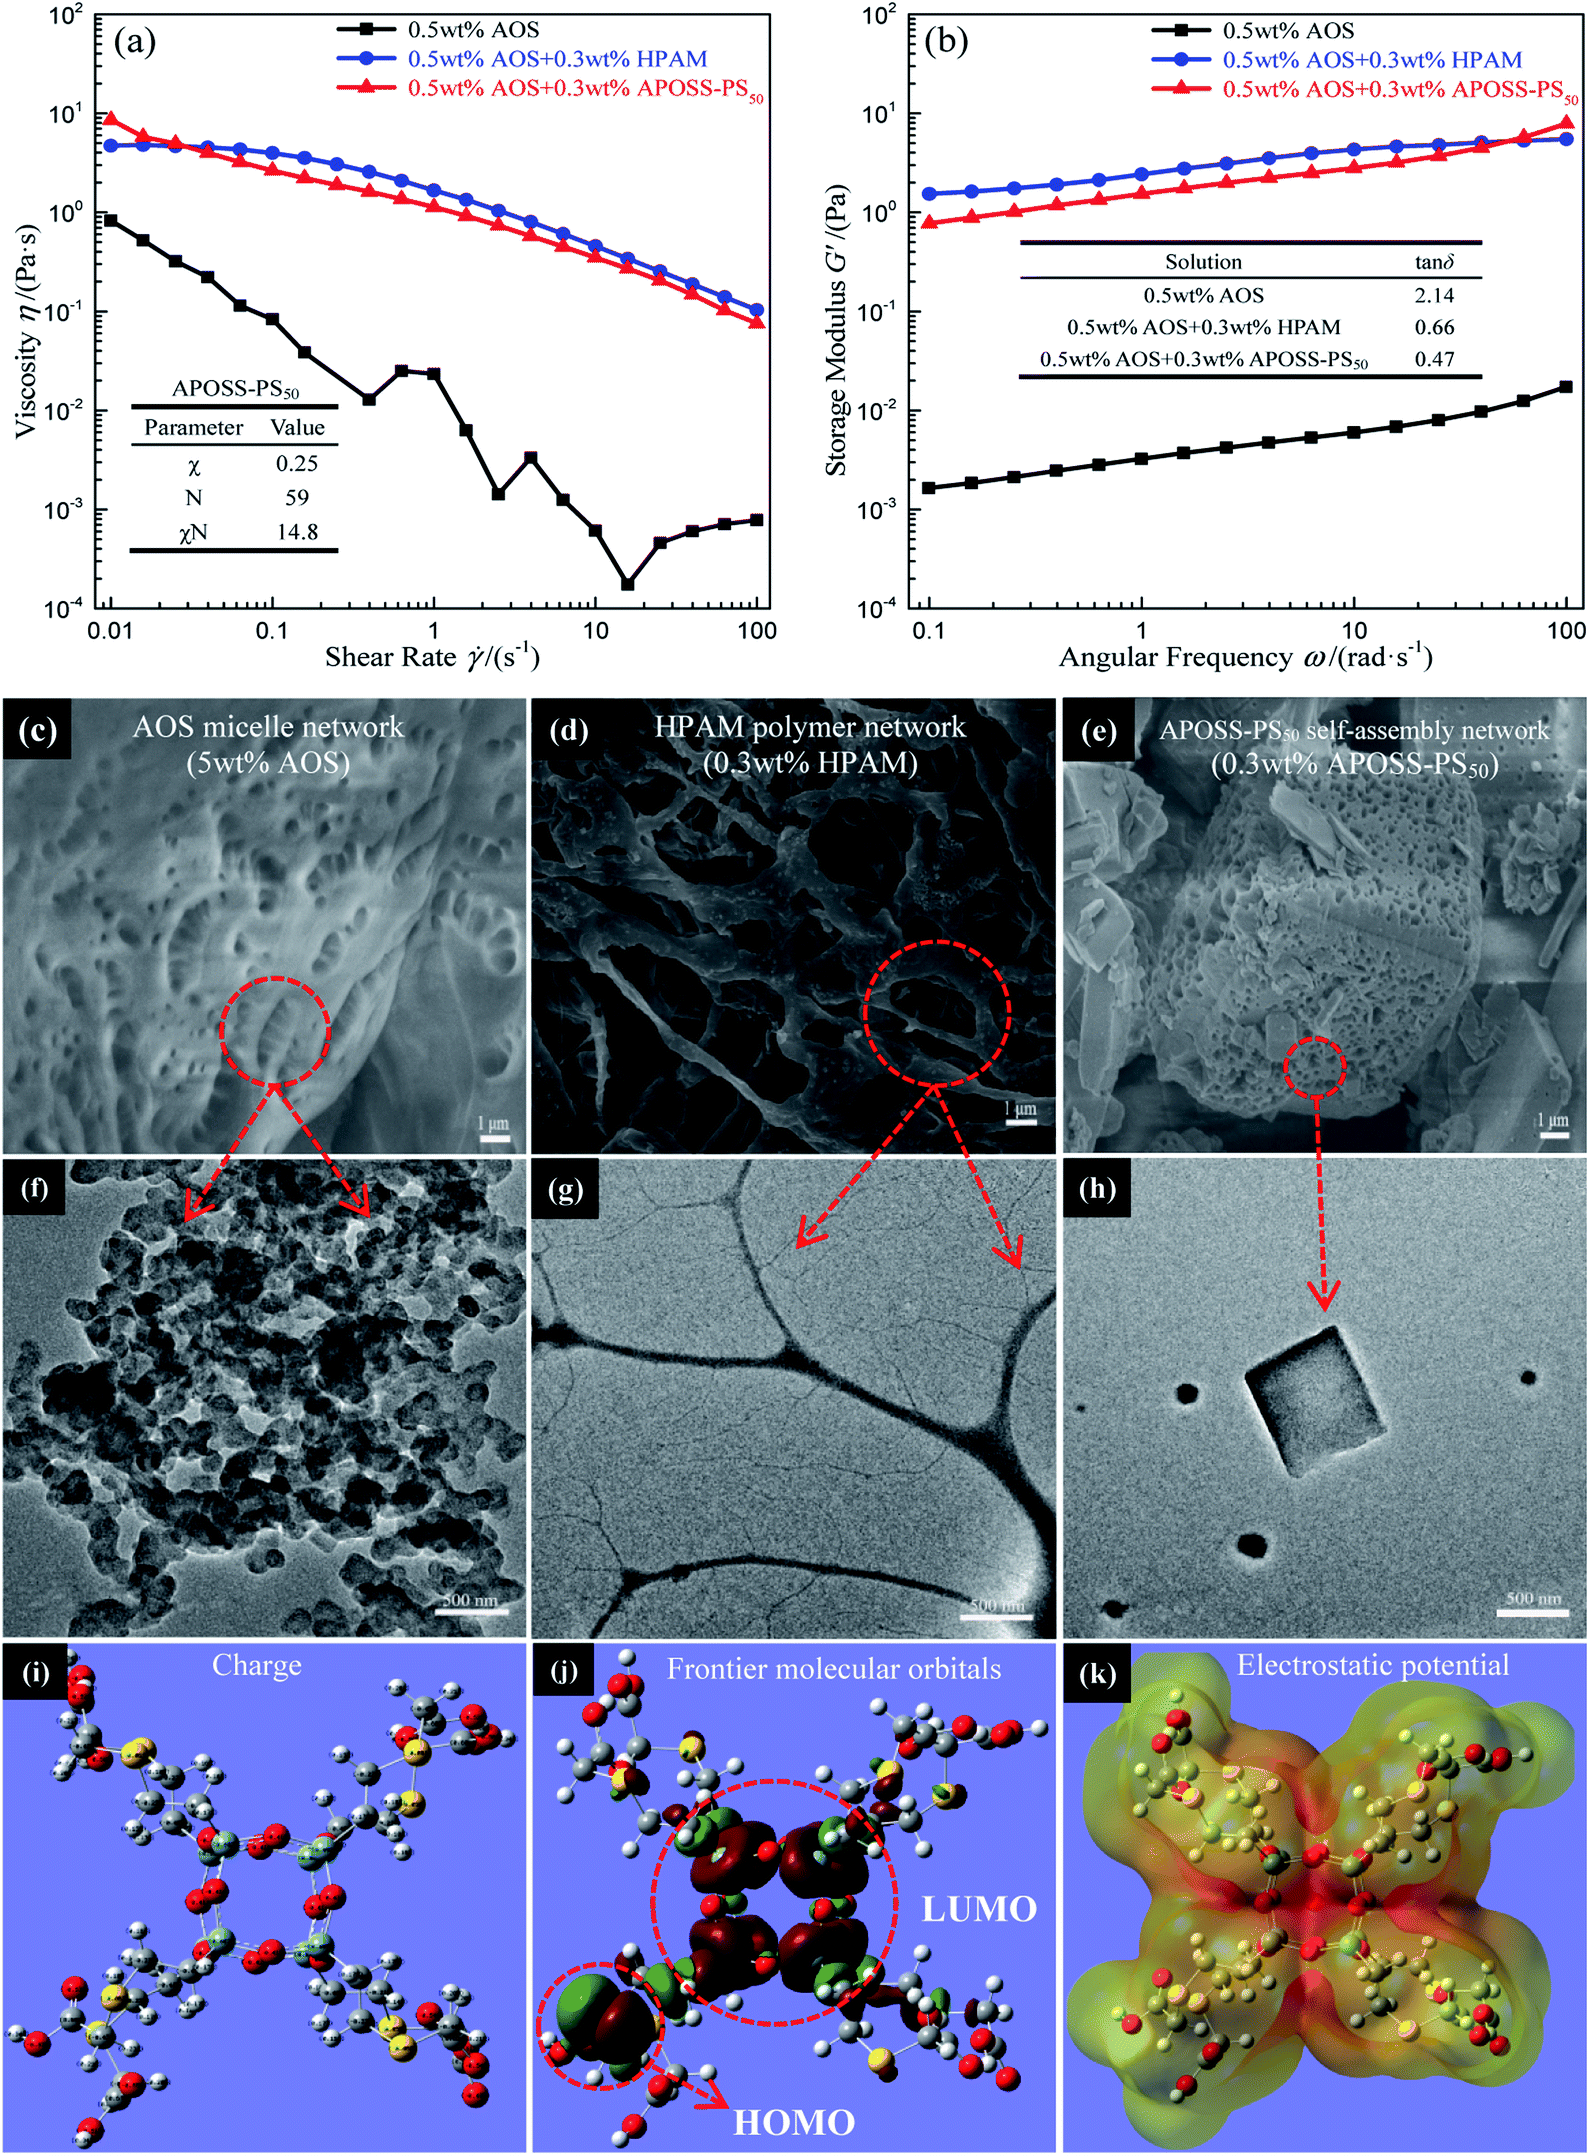 | ||
| Fig. 6 Foaming solution viscoelasticity analysis. (a) Viscosity versus shear rate and (b) G′ versus angular frequency. (c)–(e) SEM and (f)–(h) TEM images of solutions of 0.3 wt% HPAM, 0.3 wt% APOSS-PS50 and 5 wt% AOS, respectively. (i)–(k) Charge, frontier molecular orbitals and electrostatic potential distribution of the APOSS head, respectively. | ||
3.3 Foam physical properties
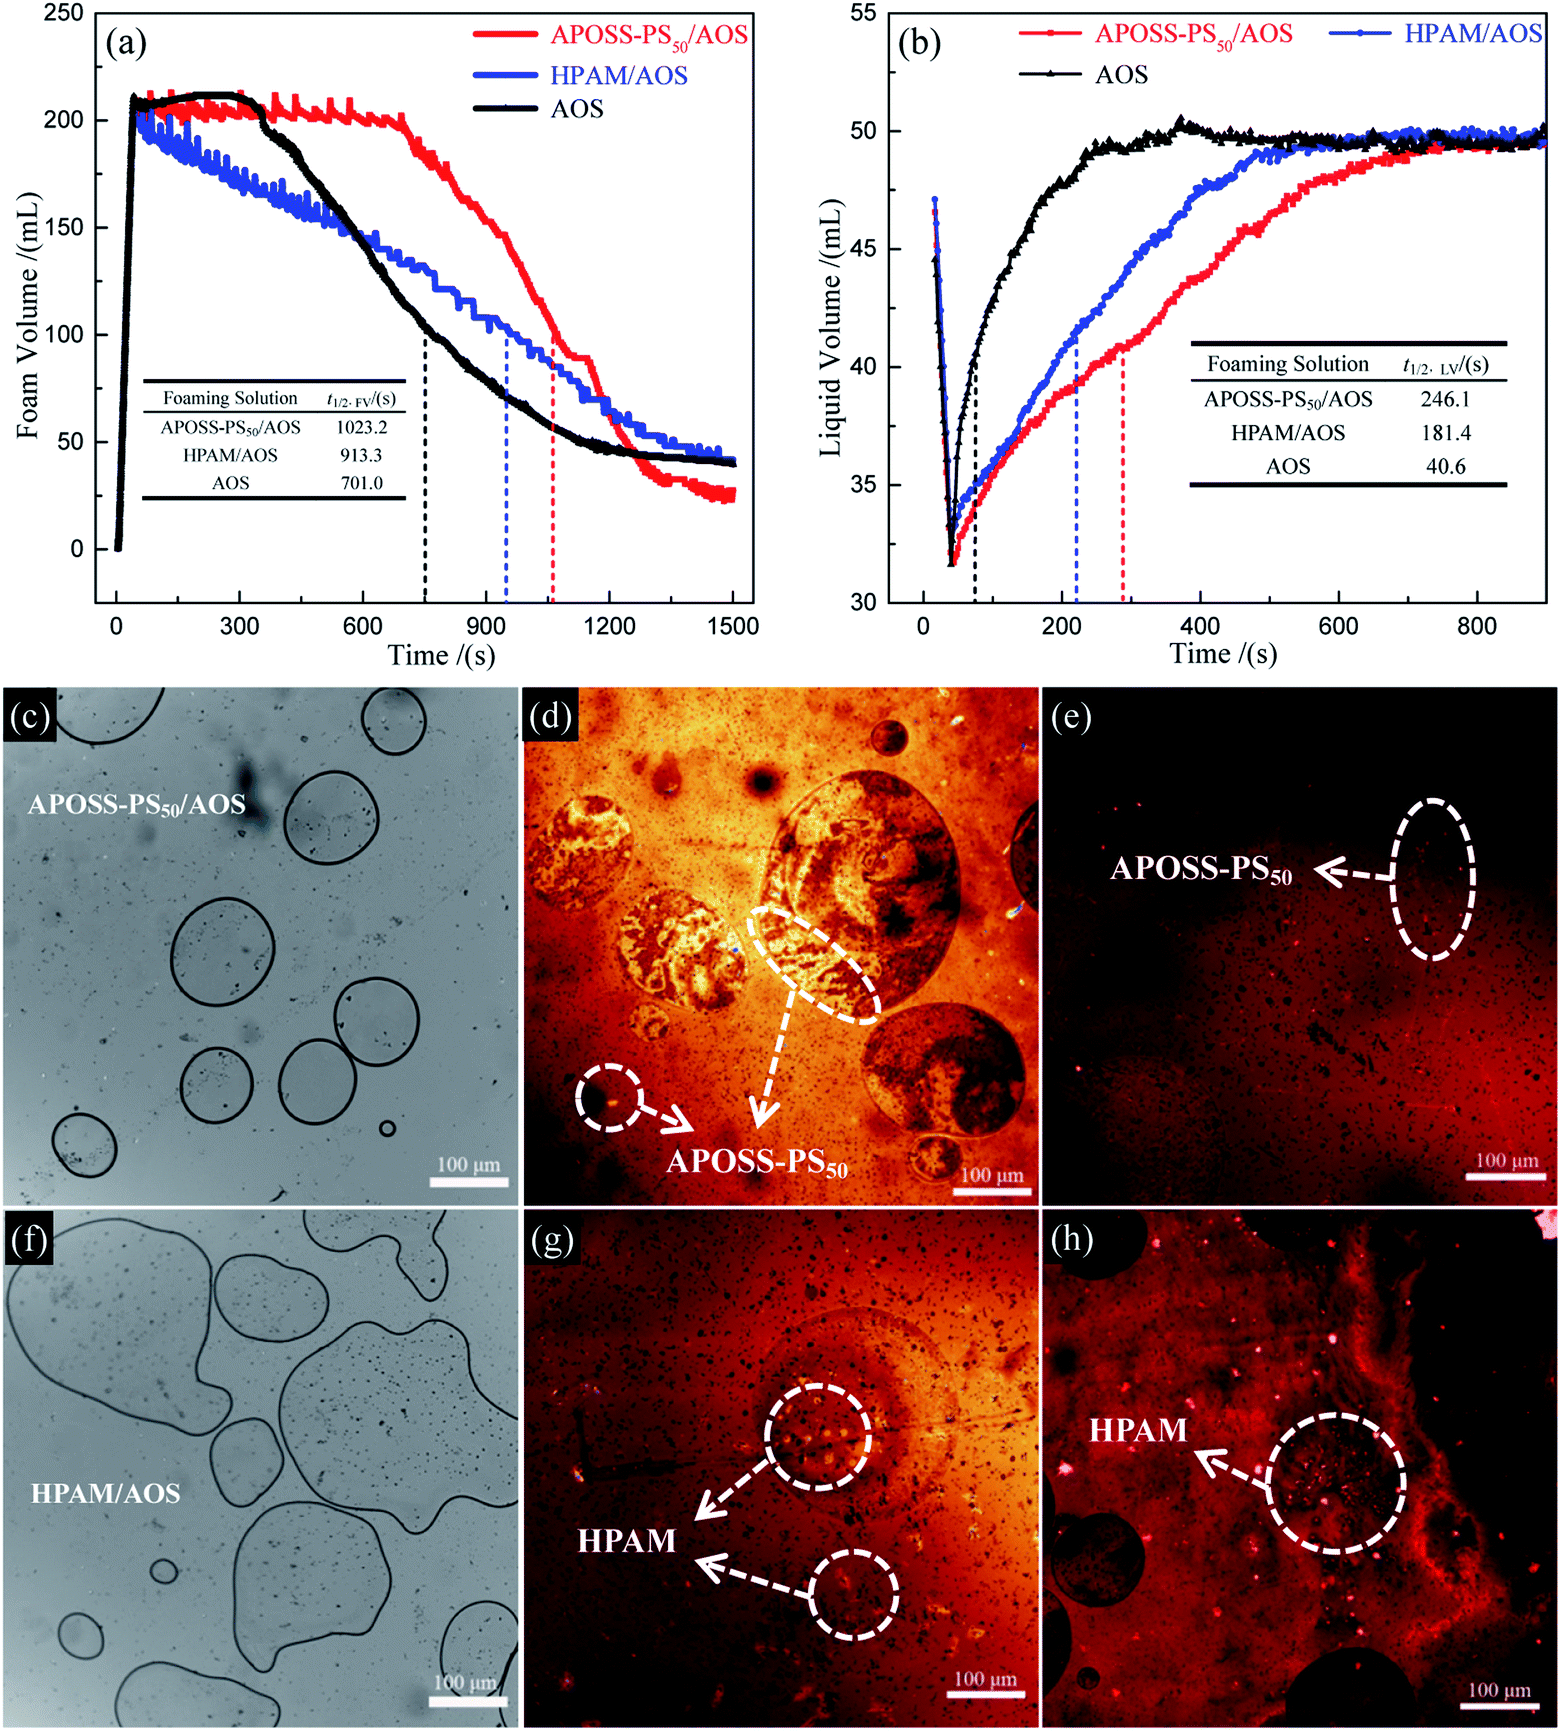 | ||
| Fig. 7 Foam stability analysis. (a) Foam volume and (b) drainage liquid volume versus time; APOSS-PS50/AOS, HPAM/AOS: (c) and (f) foam bright-field images, (d) and (g) foam fluorescence image and (e) and (h) foaming solution fluorescence image of laser scanning confocal microscope. | ||
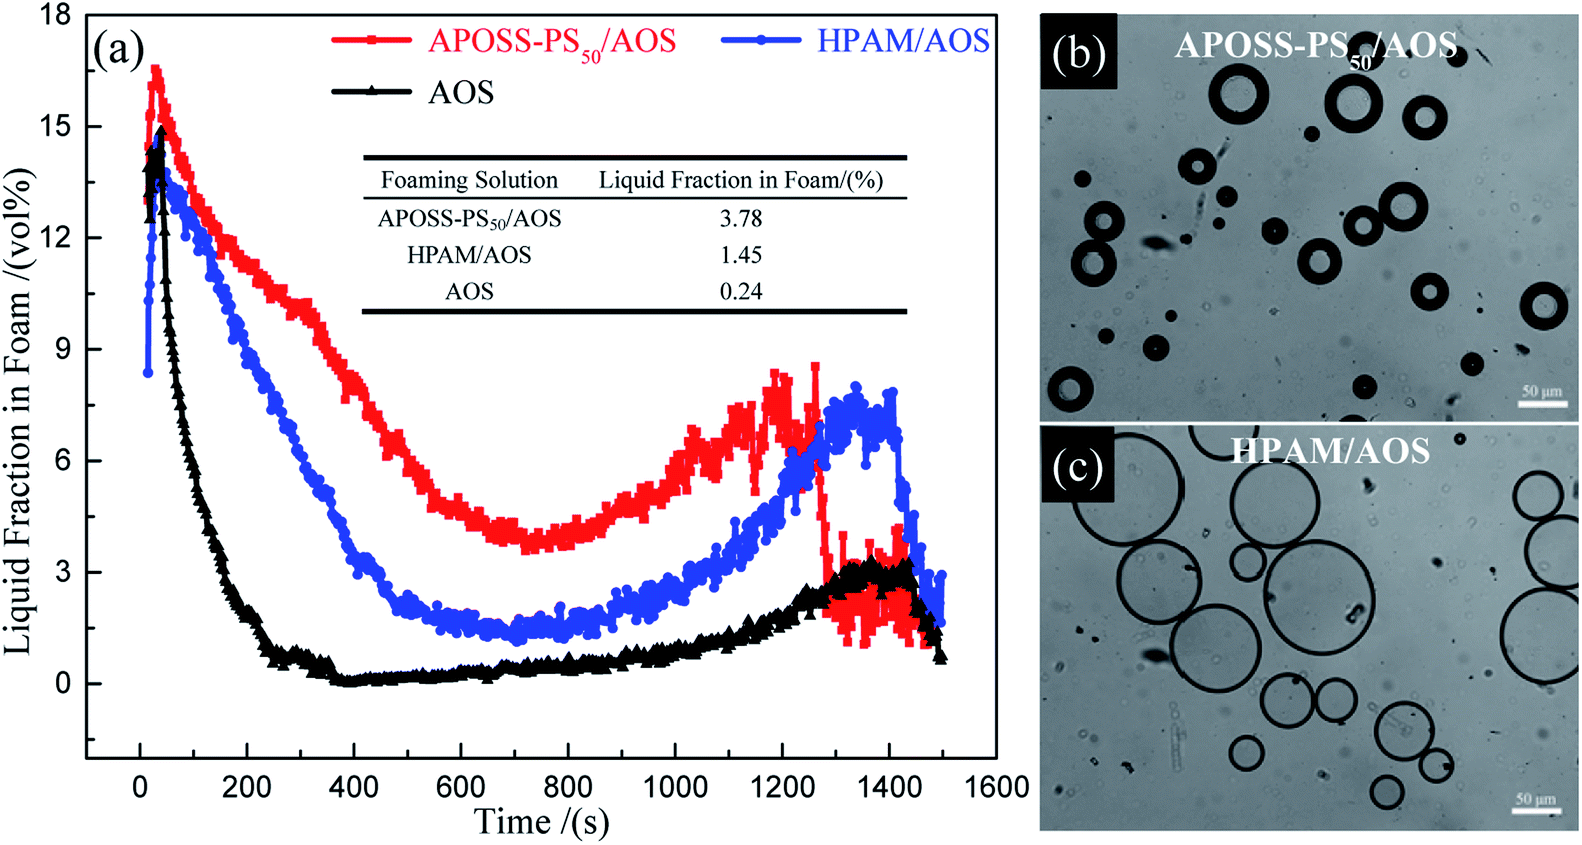 | ||
| Fig. 8 Liquid carrying capacity analysis of foam. (a) Liquid fraction in foam versus time, and (b) and (c) polarizing microscope images of APOSS-PS50/AOS and HPAM/AOS foam. | ||
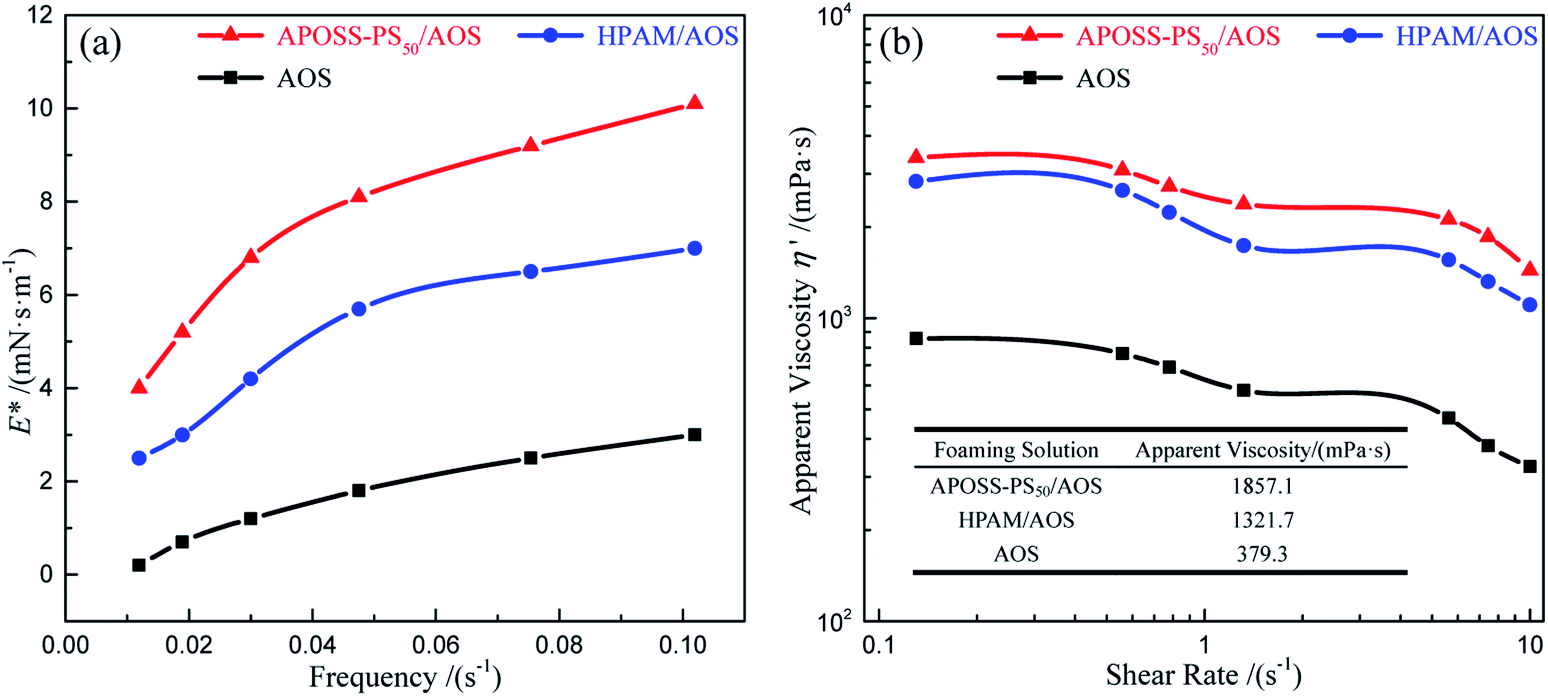 | ||
| Fig. 9 Foam viscoelasticity analysis. (a) E* versus frequency, and (b) η′ versus shear rate. | ||
3.4 Sandpack flooding experiments
According to Fig. 10a, after water flooding, ΔP increased rapidly up to a peak with the foam fluid injection, and then declined and remained constant in the subsequent water flooding process. Specifically, for the APOSS-PS50/AOS, HPAM/AOS and AOS foam flooding, the highest ΔP was 2.68, 2.17 and 0.87 MPa, and the final oil recovery (Fig. 10b) was 81.7%, 66.3% and 53.5%, respectively, indicating enhanced foam oil displacement ability from APOSS-PS50 compared with that of HPAM. Meanwhile, the highest ΔP (Fig. 10c) in the foam flowing experiment was 1.87, 1.53 and 0.36 MPa, and their RF (resistance factor, Fig. 10d) were 467.5, 383.6 and 91.8, respectively. Clearly, compared with HPAM, APOSS-PS50 largely increased the foam plugging and profile-control abilities, and oil displacement performance of foam flooding. Moreover, in the subsequent water flooding process, the ΔP descent rate for the APOSS-PS50/AOS system was obviously smaller than that of HPAM/AOS, indicating the stronger foam stabilizing ability of APOSS-PS50.41 In general, the stabilizer APOSS-PS50, with good viscosifying and reinforcing ability as well as high surface activity, enhanced the foam stability and viscoelasticity, and thus resulted in the outstanding plugging, profile-control and oil displacement ability of the foam.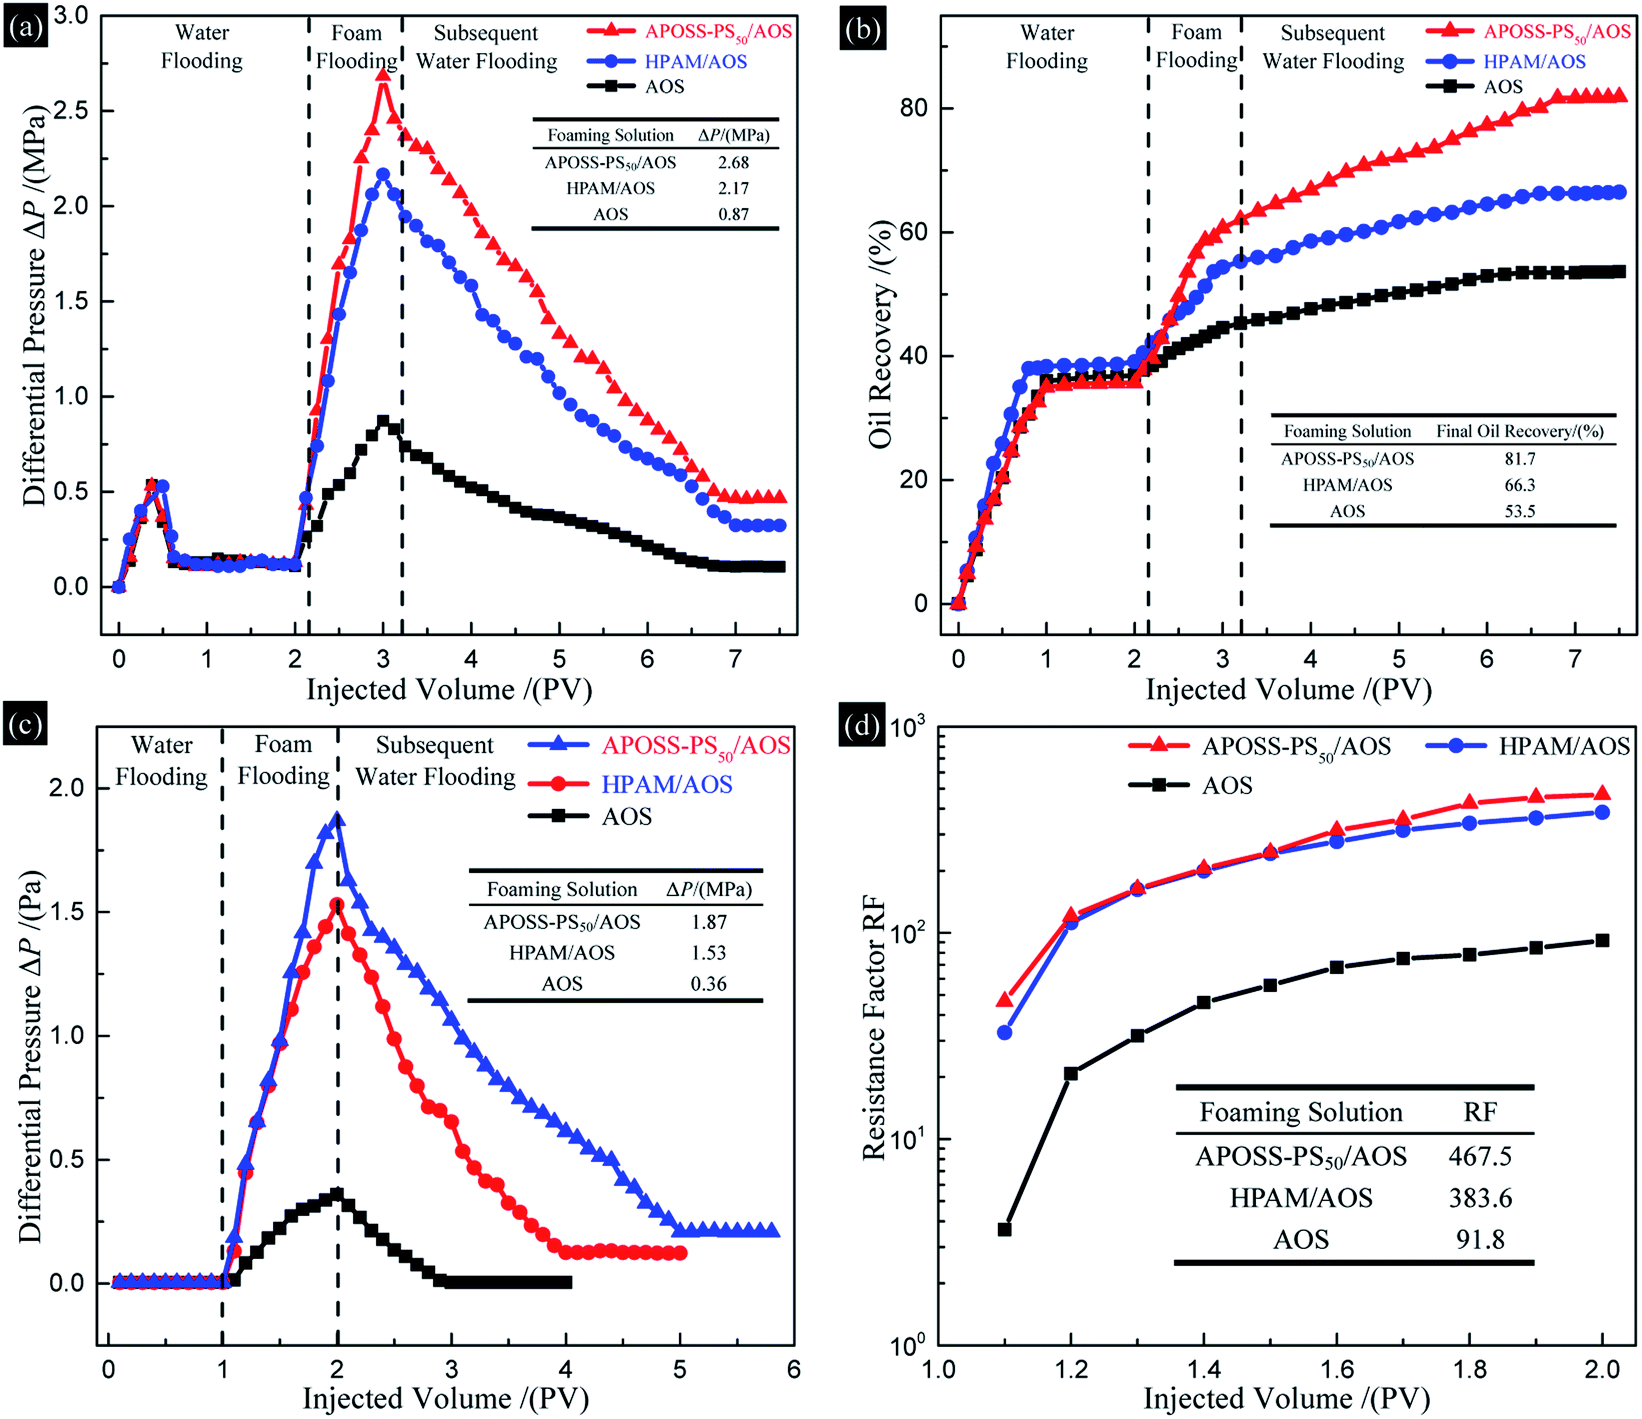 | ||
| Fig. 10 Sandpack flooding experiments. (a) Differential pressure and (b) oil recovery versus injected fluid volume in oil displacement experiments; (c) differential pressure and (d) RF versus injected fluid volume in foam flowing experiments. | ||
4. Conclusions
A novel giant surfactant, APOSS-PS50, was synthesized and its influence on foamability, foam stability and oil displacement was investigated in this study. The specific conclusions are as follows:(1) APOSS-PS50, which was well characterized via several techniques, such as FTIR, NMR spectroscopy and XRD, was synthesized successfully via a one-pot reaction with simultaneous oxime ligation and TECC reaction.
(2) APOSS-PS50, with good viscosifying, reinforcing ability and high surface activity, improved the foamability and viscoelasticity of the foaming solution. Specially, APOSS-PS50, consisting of two chemical incompatible segments, an APOSS head and PS polymer tail, has high amphiphilicity and surface activity. The foaming time of the APOSS-PS50/AOS foaming solution was 40.0 s, which was much shorter than that of the HPAM/AOS system.
(3) The APOSS-PS50/AOS foam exhibited excellent stability and viscoelasticity. Accordingly, APOSS-PS50, with high surface activity, aggregated at the foam surface, decreased the air–water IFT, thickened the foam film and enhanced the viscoelasticity of the foam. Compared with HPAM/AOS, the t1/2FV and t1/2LV of the APOSS-PS50/AOS foam were enhanced by 12.0% and 35.7%, up to 1023.2 s and 246.1 s, and its E* and η′ increased by 36.5% and 40.5%, up to 10.1 mN s m−1 and 1857.1 mPa s, respectively.
(4) The APOSS-PS50/AOS foam exhibited prominent plugging, profile-control and oil displacement ability. In comparison with HPAM/AOS, the highest ΔP, final oil recovery and RF were enhanced by 23.5%, 23.2% and 21.9%, up to 2.68 MPa, 81.7% and 467.5, respectively.
Conflicts of interest
There are no conflicts to declare.Acknowledgements
This work was financially supported by National Key Science and Technology projects of China of the 13th five-year plan (2016ZX05011), Key projects of SINOPEC (217024 and 218021) and the Priority Academic Program Development of Jiangsu Higher Education Institutions (PAPD). The related measure and analysis instrument for this work was supported by the Testing Center of Yangzhou University.Notes and references
- X. H. Dong, H. Q. Liu, Z. X. Chen, K. L. Wu, N. Lu and Q. C. Zhang, Appl. Energy, 2019, 239, 1190–1211 CrossRef CAS.
- Y. Zhang, M. W. Gao and Q. You, Fuel, 2019, 241, 442–450 CrossRef CAS.
- A. U. Rognmo, S. Heldal and M. A. Fernø, Fuel, 2018, 216, 621–626 CrossRef CAS.
- P. Wei, W. F. Pu, L. Sun, Y. Pu, D. B. Li and Y. Chen, J. Ind. Eng. Chem., 2018, 65, 280–289 CrossRef CAS.
- Q. Sun, Z. M. Li, S. Y. Li, L. Jiang, J. Q. Wang and P. Wang, Energy Fuels, 2014, 28, 2384–2394 CrossRef CAS.
- Y. R. Bai, X. S. Shang, Z. B. Wang, X. T. Zhao and C. Y. Dong, Energy Fuels, 2018, 32, 3163–3175 CrossRef CAS.
- C. K. Fu, J. J. Yu and N. Liu, Fuel, 2018, 234, 809–813 CrossRef CAS.
- Y. Y. Li, C. L. Dai, H. D. Zhou, X. K. Wang, W. J. Lv and M. W. Zhao, Energy Fuels, 2018, 32, 287–293 CrossRef CAS.
- W. F. Pu, P. Wei, L. Sun, F. Y. Jin and S. Wang, J. Ind. Eng. Chem., 2017, 47, 360–367 CrossRef CAS.
- P. Wang, Q. You, L. Han, W. B. Deng, Y. F. Liu, J. C. Fang, M. W. Gao and C. L. Dai, Energy Fuels, 2018, 32, 3709–3715 CrossRef CAS.
- L. Hernando, B. Satken, A. Omari and H. Bertin, J. Pet. Sci. Eng., 2018, 169, 602–609 CrossRef CAS.
- A. S. Emrani and H. A. Nasr-El-Din, Colloids Surf., A, 2017, 524, 17–27 CrossRef CAS.
- X. Xu, A. Saeedi and K. Liu, J. Pet. Sci. Eng., 2016, 138, 153–159 CrossRef CAS.
- A. Bureiko, A. Trybala, N. Kovalchuk and V. Starov, Adv. Colloid Interface Sci., 2015, 222, 670–677 CrossRef CAS.
- M. B. Dowling, I. C. MacIntire, J. C. White, M. Narayan, M. J. Duggan, D. R. King and S. R. Raghavan, ACS Biomater. Sci. Eng., 2015, 1, 440–447 CrossRef CAS.
- N. Hohn, A. E. Hetzenecker, M. A. Giebel, S. Geier, L. Biessmann, V. Korstgens, N. Saxena, J. Schlipf, W. Ohm, P. S. Deimel, F. Allegretti, J. V. Barth, S. V. Roth, T. F. Fassler and P. Muller-Buschbaum, Nanoscale, 2019, 11, 2048–2055 RSC.
- Y. Q. Yang, J. X. Guo, Z. F. Cheng, W. M. Wu, J. J. Zhang, J. W. Zhang, Z. G. Yang and D. S. Zhang, Energy Fuels, 2017, 31, 1159–1173 CrossRef CAS.
- W. P. Yang, T. F. Wang and Z. Fan, Energy Fuels, 2017, 31, 9016–9025 CrossRef CAS.
- D. A. Z. Wever, F. Picchioni and A. A. Broekhuis, Prog. Polym. Sci., 2011, 36, 1558–1628 CrossRef CAS.
- H. Y. Zhong, W. D. Zhang, J. Fu, J. Lu and H. J. Yin, Energies, 2017, 10, 454–473 CrossRef.
- X. F. Yu, W. B. Zhang, K. Yue, X. P. Li, H. Liu, Y. Xin, C. L. Wang, C. Wesdemiotis and S. Z. D. Cheng, J. Am. Chem. Soc., 2012, 134, 7780–7787 CrossRef CAS.
- W. B. Zhang, X. F. Yu, C. L. Wang, H. J. Sun, I. F. Hsieh, Y. W. Li, X. H. Dong, K. Yue, R. Van Horn and S. Z. D. Cheng, Macromolecules, 2014, 47, 1221–1239 CrossRef CAS.
- J. L. He, K. Yue, Y. Q. Liu, X. F. Yu, P. H. Ni, K. A. Cavicchi, R. P. Quirk, E. Q. Chen, S. Z. D. Cheng and W. B. Zhang, Polym. Chem., 2012, 3, 2112–2120 RSC.
- X. F. Yu, K. Yue, I. F. Hsieh, Y. W. Li, X. H. Dong, C. Liu, Y. Xin, H. F. Wang, A. C. Shi, G. R. Newkome, R. M. Ho, E. Q. Chen, W. B. Zhang and S. Z. D. Cheng, Proc. Natl. Acad. Sci. U. S. A., 2013, 110, 10078–10083 CrossRef CAS.
- X. F. Yu, S. Zhong, X. P. Li, Y. F. Tu, S. G. Yang, R. M. Van Horn, C. Y. Ni, D. J. Pochan, R. P. Quirk, C. Wesdemiotis, W. B. Zhang and S. Z. D. Cheng, J. Am. Chem. Soc., 2010, 132, 16741–16744 CrossRef CAS.
- Y. W. Li, H. Su, X. Y. Feng, K. Yue, Z. Wang, Z. W. Lin, X. L. Zhu, Q. Fu, Z. B. Zhang, S. Z. D. Cheng and W. B. Zhang, Polym. Chem., 2015, 6, 827–837 RSC.
- Y. W. Li, Z. Wang, J. K. Zheng, H. Su, F. Lin, K. Guo, X. Y. Feng, C. Wesdemiotis, M. L. Becker, S. Z. D. Cheng and W. B. Zhang, ACS Macro Lett., 2013, 2, 1026–1032 CrossRef CAS.
- D. B. Cordes, P. D. Lickiss and F. Rataboul, Chem. Rev., 2010, 110, 2081–2173 CrossRef CAS.
- Z. W. Lin, X. Yang and H. Xu, J. Am. Chem. Soc., 2017, 139, 18616–18622 CrossRef CAS.
- E. Esmaeilnezhad, H. J. Choi, M. Schaffie, M. Gholizadeh and M. Ranjbar, J. Cleaner Prod., 2018, 171, 45–56 CrossRef CAS.
- G. X. Zhao, H. X. Zhang, Q. H. Fan, X. M. Ren, J. X. Li, Y. X. Chen and X. K. Wang, J. Hazard. Mater., 2010, 173, 661–668 CrossRef CAS.
- Z. Yang, H. Yang, Z. W. Jiang, T. Cai, H. J. Li, H. B. Li, A. M. Li and R. S. Cheng, J. Hazard. Mater., 2013, 255, 36–45 CrossRef.
- X. M. Wang, Y. Shao, J. Xu, X. Jin, R. H. Shen, P. F. Jin, D. W. Shen, J. Wang, W. H. Li, J. L. He, P. H. Ni and W. B. Zhang, Macromolecules, 2017, 50, 3943–3953 CrossRef CAS.
- K. Yue, C. Liu, M. J. Huang, J. H. Huang, Z. Zhou, K. Wu, H. Liu, Z. W. Lin, A. C. Shi, W. B. Zhang and S. Z. D. Cheng, Macromolecules, 2017, 50, 303–314 CrossRef CAS.
- M. J. Huang, K. Yue, J. H. Huang, C. Liu, Z. Zhou, J. Wang, K. Wu, W. P. Shan, A. C. Shi and S. Z. D. Cheng, ACS Nano, 2018, 12, 1868–1877 CrossRef CAS.
- C. Sinturel, F. S. Bates and M. A. Hillmyer, ACS Macro Lett., 2015, 4, 1044–1050 CrossRef CAS.
- Y. Y. Wang, J. Cui and Y. Y. Han, Langmuir, 2019, 35, 468–477 CrossRef CAS.
- S. J. Murray and P. Politzer, Wiley Interdiscip. Rev.: Comput. Mol. Sci., 2011, 1, 153–163 Search PubMed.
- M. L. Tang, A. D. Reichardt, P. Wei and Z. N. Bao, J. Am. Chem. Soc., 2009, 131, 5264–5273 CrossRef CAS.
- D. H. Ess and K. N. Houk, J. Am. Chem. Soc., 2008, 130, 10187–10198 CrossRef CAS.
- W. P. Yang, T. F. Wang, Z. X. Fan, Q. Miao, Z. Y. Deng and Y. Y. Zhu, Energy Fuels, 2017, 31, 4721–4730 CrossRef CAS.
- K. O. Bonsu, N. Shokri and P. Grassia, J. Colloid Interface Sci., 2016, 462, 288–296 CrossRef.
- C. L. Zhang, P. Wang and G. L. Song, J. Pet. Sci. Eng., 2019, 177, 181–187 CrossRef CAS.
- P. Wei, W. F. Pu, L. Sun and B. Wang, J. Pet. Sci. Eng., 2017, 157, 27–38 CrossRef CAS.
Footnote |
| † Electronic supplementary information (ESI) available: Fig. S1 and Table S1. See DOI: 10.1039/c9ra06388a |
| This journal is © The Royal Society of Chemistry 2019 |