 Open Access Article
A novel quartz-crystal microbalance humidity sensor based on solution-processible indium oxide quantum dots†
Hao Kanab,
Min Lic,
Hui Lia,
Chong Lia,
Jian Zhoud,
Chen Fua,
Jingting Luo *a and
Yongqing Fu
 e
e
aShenzhen Key Laboratory of Advanced Thin Films and Applications, College of Physics and Optoelectronic Engineering, Shenzhen University, 518060, Shenzhen, China. E-mail: luojt@szu.edu.cn
bKey Laboratory of Optoelectronic Devices and Systems of Ministry of Education and Guangdong Province, College of Optoelectronic Engineering, Shenzhen University, 518060, Shenzhen, China
cSchool of Electrical Engineering, Nanjing Institute of Industry Technology, 210023, Nanjing, China
dState Key Laboratory of Advanced Design and Manufacturing for Vehicle Body, College of Mechanical and Vehicle Engineering, Hunan University, Changsha 410082, China
eFaculty of Engineering and Environment, Northumbria University, Newcastle Upon Tyne, Newcastle NE1 8ST, UK
First published on 26th November 2019
Abstract
Having a large surface area, like the quantum confinement effect also caused by the nano-level size of quantum dots (QDs), creates fantastic potential for humidity sensing. A high concentration of surface adsorption sites initiates an increased response. Porosity between QDs allows fast water vapor penetration and outflow. Here, a quartz-crystal microbalance (QCM) humidity sensor was prepared using indium oxide (In2O3) QDs, synthesized via a solvothermal method. After the In2O3 QDs were directly spin-coated onto the QCM, an annealing process removed organic long chains and exposed more moisture adsorption sites on the surfaces of the QDs. The annealed QCM humidity sensor exhibited high sensitivity (56.3 Hz per %RH at 86.3% RH), with a fast response/recovery time (14 s/16 s). Long carbon chains were broken down, and hydrogen-bonded hydroxyl groups were chemisorbed to the QDs. The chemical reaction was reduced by these chemisorbed hydrogen-bonded hydroxyl groups. Mass change was mostly caused by fast multilayer physisorption. Thus, the transducer can effectively and precisely monitor the moisture from a person's breath. In2O3 QD-modified QCM sensors demonstrate promising humidity-sensing applications in daily life.
Introduction
Humidity sensors have been widely used in the fields of chemistry, electronics, food storage, mining, meteorology, agriculture, medicine, and others.1–4 Accurate and real-time monitoring of humidity is also critical for human safety and social activities. Therefore, it is critically required to develop a high-performance, repeatable and low-cost humidity sensor. So far, various sensing technologies have been developed for humidity sensors, including resistance, optical, magnetic, acoustic capacitance and thermal sensing, among others.5–9 Among these, the quartz crystal microbalance (QCM) is one of the most promising and key technologies due to its merits such as low power consumption, easy operation, low cost, good sensitivity and extremely trace mass detection. By monitoring the shifts of the resonance frequency in real time, the mass change caused by water molecules can be precisely detected using the Sauerbrey equation.10 Therefore, QCM sensors have been extensively researched as humidity sensors by more and more researchers.11–18Based on the above advantages, various sensitive materials, such as 0-dimensional (0D) QDs, 1-dimensional (1D) nanowires, graphene, reduced graphene oxide (RGO), black phosphorus and many types of polymers have been applied on the surface of QCM humidity sensors.19–26 Obviously, these nanomaterials provide numerous reactive sites due to their larger specific surface areas, resulting in improved humidity sensing performance. Among them, 0D QDs exhibit wide-ranging potential applications in the field of humidity sensors due to their low cost, large specific surface areas and easy solution processing.27–29 For example, Sun et al. prepared well-crystallized black phosphorus QDs from bulk black phosphorus using a kitchen blender, and the sensor using the black phosphorus QDs showed outstanding humidity sensing performance.30 A flexible humidity sensor fabricated using graphene QDs was reported by Hosseini et al., and the response of the transducer was quite high, with good selectivity and flexibility.31 Another QCM humidity sensor based on ZnO QD sensitive film was reported by Sakly et al., and it exhibited high sensitivity, fast response/recovery speed and outstanding long-term stability.32 Therefore, QDs with high specific surface area are a very promising type of humidity-sensitive material.
Based on the discussion above, in the present work, we fabricated a QCM humidity sensor based on In2O3 QDs. The In2O3 QDs were spin-coated on the top of the electrodes of QCMs in the form of thin films, then the devices were annealed at 300 °C in air for one hour to remove long-chain carbons on the surface of the QDs. The humidity sensing performance of the QCM sensor was characterized at room temperature, from 11.3% to 84.3% relative humidity (RH). The sensor showed remarkable sensing characteristics, including high sensitivity (56.4 Hz per %RH), fast response/recovery time (14 s/16 s), good stability and excellent selectivity for moisture. We believe this work provides a simple and easy way to fabricate a novel QCM humidity sensor based on In2O3 QDs.
Experimental section
In2O3 QD synthesis and device preparation
The In2O3 QDs were synthesized via a modified method employing oleic acid (OA) and oleylamine (OLA) as the surfactants.33 Briefly, 0.146 g indium acetate, 12.5 mL OLA and 5 mL OA were mixed inside a three-necked flask. The mixture was heated under vacuum at 90 °C until the indium acetate was completely dissolved. Then, the solution was kept under nitrogen atmosphere and heated to 240 °C for 30 min. Finally, In2O3 QDs were washed with ethanol and toluene, and eventually dispersed in toluene with a concentration of 20 mg mL−1.The QCM devices with a resonant frequency of 8 MHz were purchased from Wuhan Hi-Trusty Electronics Co., Ltd., China. They consisted of an AT-cut quartz crystal (8 mm in diameter) and silver electrodes (5 mm in diameter) on both sides (Fig. 1a). Before preparing In2O3 QD film, all the QCM devices were washed with ethanol and deionized water, then dried with nitrogen. The film-coated QCM sensors were produced by spin-coating method and post-annealing process (Fig. 1b). Specifically, 20 μL In2O3 QD solution was spin-coated onto the QCM device at 1200 rpm for 45 s. To remove the organic long chains from the surface of the In2O3 QDs, an annealing process was carried out in air at 300 °C for 1 h. This procedure for fabricating the QCM humidity sensor is shown in Fig. 1b. To study the influence of the amount of deposited In2O3 QDs on sensing performance, three sensors with different deposition repeat cycles (2, 4, 6 times) were prepared, designated as QCM-1, QCM-2 and QCM-3, respectively. The resonant frequency and the frequency after coating with the film were measured, and the mass of the In2O3 QDs deposited on the electrode of QCMs was calculated using the Sauerbrey equation.10 All the detailed parameters of the samples are listed in Table 1.
 | ||
| Fig. 1 (a) A photograph of the QCM device. (b) The fabrication procedure of the QCM humidity sensor based on In2O3 QDs. | ||
| Sample | Fundamental frequency (Hz) | Frequency shift (Hz) | Load mass (ng) |
|---|---|---|---|
| QCM-1 | 7![[thin space (1/6-em)]](https://www.rsc.org/images/entities/char_2009.gif) 999 999![[thin space (1/6-em)]](https://www.rsc.org/images/entities/char_2009.gif) 890 890 |
−7266 | 9852 |
| QCM-2 | 7![[thin space (1/6-em)]](https://www.rsc.org/images/entities/char_2009.gif) 999 999![[thin space (1/6-em)]](https://www.rsc.org/images/entities/char_2009.gif) 867 867 |
−14955 | 19![[thin space (1/6-em)]](https://www.rsc.org/images/entities/char_2009.gif) 794 794 |
| QCM-3 | 7![[thin space (1/6-em)]](https://www.rsc.org/images/entities/char_2009.gif) 999 999![[thin space (1/6-em)]](https://www.rsc.org/images/entities/char_2009.gif) 799 799 |
−21004 | 28![[thin space (1/6-em)]](https://www.rsc.org/images/entities/char_2009.gif) 479 479 |
Sensing measurement
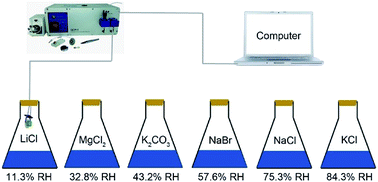
The schematic diagram of the experiment apparatus for the QCM humidity measurement is given in Fig. 2. It was composed of the QCM humidity sensor, humidity sources, a computer and QCM-I (Microvacuum Ltd., Hungary). Saturated solutions of LiCl, MgCl2, K2CO3, NaBr, NaCl and KCl were prepared, which could provide different humidity environments in a conical flask, with RH levels of 11.3%, 32.8%, 43.2%, 57.6%, 75.3% and 84.3% RH, respectively. The response time was defined as the time for the frequency change to approach 90% of the total frequency change, and the recovery time was defined as the time it returned to 10% of the total frequency change. All the tests were performed at the ambient temperature of 25 °C.Characterization
X-ray diffraction (XRD) analysis of the QD films was performed using a diffractometer (MAXima XXRD-7000, Shimadzu, Japan) with Cu Kα radiation. The optical absorption spectra of the QDs were measured using a PerkinElmer Lambda 950 UV/vis/NIR spectrometer. Surface morphologies of the QD samples were characterized using a scanning electron microscope (SEM, Zeiss Supra 55 microscope). High-resolution transmission electron microscopy (HR-TEM) was carried out using a JEOL-2100 microscope. The Fourier transform infrared (FTIR) spectroscopy was performed using a VERTEX 70 (Bruker, Germany).Results and discussion
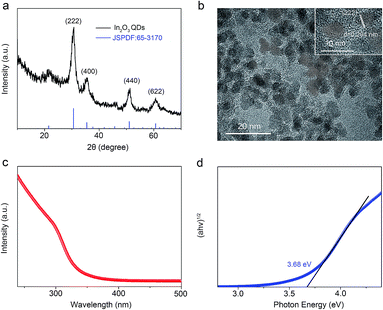
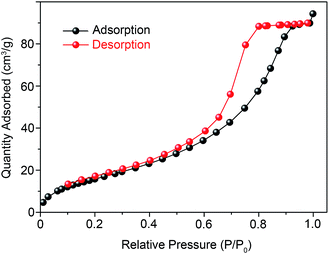
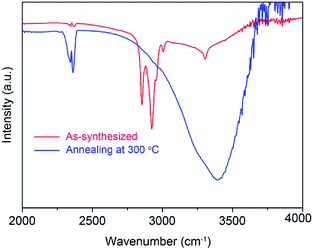
Fig. 3a shows the crystallization characteristics of the In2O3 QDs. The XRD pattern of the synthesized In2O3 QDs is in good agreement with the standard diffraction results listed in the JCPDS card (no. 65-3170), indicating the synthesized QDs have good crystallinity, and no other impurities appear. Fig. 3b shows a TEM image of In2O3 QDs. The In2O3 QDs were uniformly dispersed and had an average diameter of 3.9 nm. This indicates that the diameter of the as-synthesized In2O3 QDs is less than twice the Bohr exciton radius of In2O3 (2.14 nm), confirming that the as-synthesized In2O3 has quantum size.34,35 The transparent lattice fringes of atomic spacing associated with the (222) plane of the In2O3 phase can also be observed, as shown in the inset of Fig. 3b. This demonstrates that the In2O3 QDs have good crystallinity. Fig. 3c shows the absorption spectrum of as-synthesized In2O3 QDs in hexane. The band gap of as-synthesized In2O3 QDs calculated by the Tauc model is about 3.68 eV (shown in Fig. 3d), which is larger than that of bulk In2O3 (2.93 ± 0.15 eV). This result indicates that the as-synthesized In2O3 QDs have quantum confinement effect. As shown in Fig. 4, the nitrogen adsorption and desorption isotherm curves of In2O3 QDs were investigated. The surface area of In2O3 QDs is calculated to be about 63.9 m2 g−1 through the Brunauer–Emmett–Teller theory. As is known, high specific surface area can provide more active sites to promote the adsorption of water molecules, thus improving the humidity sensing.The as-synthesized In2O3 QDs were capped with organic long-chain OA and OLA, and these hydrophobic organic long-chain molecules can inhibit water molecules from being adsorbed onto the surface of In2O3 QDs.36,37 To remove the organic long chains, the In2O3 QD films should be annealed at 300 °C in air. In order to study the effect of the annealing process on the QDs, we use FTIR to analyse the In2O3 QD films before and after annealing, and the results are shown in Fig. 5. Compared to the as-prepared In2O3 QD film (red line), the characteristic absorption peaks of the aliphatic C–H stretching bands (2850–2920 cm−1) disappeared after annealing (blue line), indicating that most of the surface-capped OA and OLA ligands around the In2O3 QDs have been removed.18 As expected, after the annealing process, a very strong characteristic peak at around 3445 cm−1 appeared (blue line), which is attributed to the hydrogen-bonded hydroxyl groups adsorbed on the In2O3 QDs. Results indicate that the In2O3 QD film has outstanding hydrophilicity after annealing.
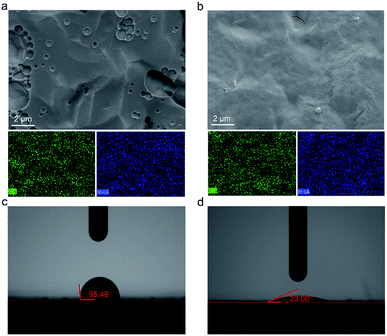
The SEM morphologies of the In2O3 QD films before and after annealing were compared (QCM-3). Fig. 6a is the SEM image of the as-deposited In2O3 QD film showing holes, which may be caused by the evaporation of solvent during the film formation process. The In2O3 QD film is shown after annealing at 300 °C for 1 h in Fig. 6b. The corresponding element mapping obtained from energy dispersive X-ray spectroscopy is shown in Fig. 6a and b. The elements of In and O were uniformly dispersed, which indicates that the QDs were uniformly deposited on top of the QCM electrode. To better understand the influence of the surface morphology of In2O3 QDs films before and after annealing (QCM-3), the high-magnification SEM of films is shown in Fig. S1e and f,† respectively. Before annealing, the film is rough and shows no obvious cracks. After the film was annealed at 300 °C for 1 h, the QD film became smoother, but with some tiny cracks, which were generated owing to the densification with stress relaxation and the removal of organic long-chain ligands during the annealing process. This porous film is beneficial for the adsorption and diffusion of water molecules.
Fig. 6c and d show the wettability behaviours of In2O3 QD film before and after annealing (QCM-3). The contact angle of the as-deposited QD film is 95.49° (Fig. 6c). This is due to the hydrophobicity of the surface-capped organic long chains. After the annealing process, the contact angle of the In2O3 QD sensing film is as low as 23.00° (Fig. 6d). This value verifies the excellent hydrophilicity of the In2O3 QD sensing film. These results are consistent with FTIR spectra. Also, the results of FTIR and contact angle measurements suggest that the prepared QCM humidity sensor based on In2O3 QDs will have good humidity sensitivity.
The humidity sensitivity of the In2O3 QD-based QCM sensor was quantified by changing the RH level in different saturated solutions in conical flasks and measuring the changes of resonance frequency. Fig. 7a shows the relationship between frequency shifts vs. RH for three sensors, with test RH between 11.3% and 84.3%. As seen in the figure, the resonant frequency of all the sensors decreased with the RH increase. The frequency shifts are 1550 Hz, 3100 Hz and 4750 Hz for the three QCM samples, respectively (with RH levels changing from 11.3% to 84.3%). The QCM-3 sensor has the highest frequency offset (sensitivity). To better understand the performance range of the three humidity sensors, the surface morphologies of the three sensors before and after annealing are given in ESI.† The high-magnification SEM images of QCM-1, QCM-2 and QCM-3 before annealing are shown in Fig. S1a, c and e,† respectively. As shown, the surface morphology of the In2O3 QDs film before annealing gradually become rough with the thickness of the film increasing. After the annealing process, the surface of all the In2O3 QD films turned smooth, with many small cracks (Fig. S1b, d and f†). This porous morphology provides a path for water molecules to diffuse into the interior of the film. Meanwhile, greater amounts of In2O3 QDs have more adsorption sites. Hence, the QCM-3 sensor has high sensitivity to humidity. As shown in Fig. 7b, the frequency response of the three sensors exhibit very good log relationship with humidity, which is consistent with the results of other reported humidity sensors.38,39 The regression coefficients (R2) of QCM-1, QCM-2 and QCM-3 sensors are 0.98411, 0.9899 and 0.97367, respectively.
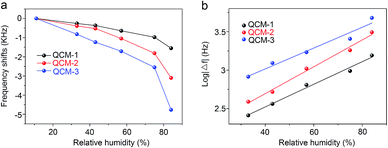 | ||
| Fig. 7 (a) The relationships between the frequency shifts of all the sensors. (b) The linear fitting curves of log |Δf| versus humidity for all the sensors. | ||
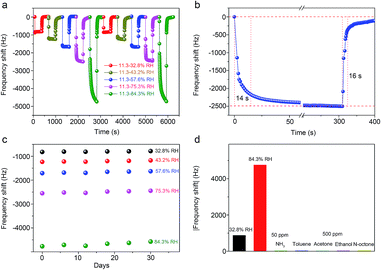
QCM-3, having the optimal humidity sensitivity, was chosen for further testing. Fig. 8a shows the dynamic frequency changes of the QCM-3 transducer. The sensor was tested twice, with the RH levels changed from 11.3% RH to 32.8% RH, 43.2% RH, 57.6% RH, 75.3% RH and 84.3% RH. The frequency responses did not change significantly under the same humidity conditions, indicating that the humidity sensor has excellent RH measurement repeatability. The response/recovery time is another crucial parameter for evaluating the humidity sensing performance. The response and recovery characteristic curves between the RH levels of 11.3% and 75.3% are shown in Fig. 8b. As can be seen, the response and recovery time of the QCM-3 transducer are 14 s and 16 s, respectively, which indicates the sensor based on In2O3 QD film has fast adsorption and desorption characteristics for water molecules. The response/recovery time of QCM-3 under different relative humidity conditions are shown in Fig. S2.† The response time of QCM-3 between 11.3% and 32.8%, 43.2%, 57.6%, 75.3% and 84.3%, were 3 s, 4 s, 3 s, 14 s and 82 s, respectively. Also, the recovery time of QCM-3 between 11.3% and 32.8%, 43.2%, 57.6%, 75.3% and 84.3%, were 19 s, 32 s, 15 s, 16 s and 16 s, respectively. At high relative humidity, physisorption of water molecules will take a longer time to reach equilibrium. Hence, the response time will increase as well. The long-term stability of the humidity sensor is very important for its practical application. Fig. 8c shows the long-term stability of the QCM humidity sensor based on In2O3 QDs. The frequency shifts of the sensor do not show apparent changes under different humidity conditions within 30 days. This result indicates that the sensor has good long-term stability. The selectivity testing results of the QCM device are shown in Fig. 8d. It demonstrates that the frequency shifts of the QCM sensor based on In2O3 QDs toward water molecules are much higher than those towards the commonly used target gases, including NH3, ethanol, acetone, toluene, and n-octane. Hence, the sensor has excellent selectivity toward water molecules at room temperature. Finally, we summarized the reported humidity sensing performance of QCM sensors from recent literature (Table 2). The results indicate that our sensor exhibits outstanding sensitivity.
| Material | RH range (%) | Sensitivity (Hz per %RH) | Response/recovery time | Ref. |
|---|---|---|---|---|
| ZnO/GO | 11–97 | 41.10 | 9/5 s (@63.2%) | 11 |
| GQDs–chitosan | 11–95 | 39.2 | 36/3 s (@95%) | 40 |
| SnO2–SiO2 | 11–96 | 9.4 | 14/16 s (@90%) | 41 |
| ZnO colloid spheres | 11–95 | 77 | 167.7/8 s (@95%) | 42 |
| GO/PEI | 11–97 | 27.3 | 53/18 s (@90%) | 43 |
| GO/SnO2/PANI | 0–97 | 29.1 | 7/2 s (@97%) | 44 |
| MWCNTs/GO | 10–80 | 9.8 | 4/3 s (@97%) | 45 |
| In2O3 QDs | 11.3–84.3 | 56.3 | 14/16 s (@74.3%) | This work |
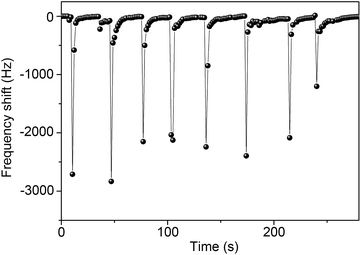
In order to demonstrate the application of QCM sensors based on In2O3 QDs for humidity detection, we further measure human breath from the mouth via these sensors. As shown in Fig. 9, breath from the mouth causes a sharp frequency decrease due to the sudden increase of RH level. Hence, the QCM sensor can detect human respiration. These results show that the In2O3 QD QCM sensor possesses outstanding sensitivity to humidity and can be used to locate human survivors of disasters.
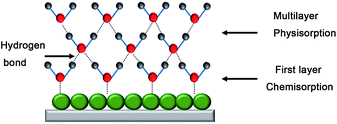
The humidity sensing mechanism of the In2O3 QD QCM humidity sensor depends on adsorption/desorption of water molecules (Fig. 10). Here, In2O3 QDs have abundant surface oxygen vacancies and a large specific surface area, which play an important role in improving the sensing performance. First, the chemical absorption of water molecules forms OH− on the surface of In2O3 QDs. Second, more water molecules will be physically adsorbed on the hydroxyl groups through van der Waals forces. As the ambient humidity increases, more water molecules will be adsorbed on the surface of the sensitive film, and the resonant frequency will decrease due to the mass gain of the QCM surface. In contrast, as the environmental RH decreases, water molecules on the surface of the sensitive film are desorbed and released into the environment. Then, the mass loading effect is decreased, and the resonant frequency is increased.
Conclusions
In summary, QCM humidity sensors were fabricated by employing In2O3 QDs synthesized using a solvothermal method. In2O3 QD films were prepared by spin-coating due to the good solution processing properties, then the films were annealed at 300 °C in order to increase their surface hydrophilicity. This sensor has outstanding sensitivity and short response/recovery times for humidity detection. Meanwhile, the sensor has been used to monitor breath from the mouth, showing its potential for fast humidity detection in practical applications. Furthermore, we discussed the humidity sensing mechanisms of this sensor. This study provides a new QD humidity sensing material and expands the application of QDs in QCM humidity sensors.Conflicts of interest
There are no conflicts to declare.Acknowledgements
The authors gratefully acknowledge the support of the National Key Research and Development Program of China (Grant no. 2016YFB0402705) and the China Postdoctoral Science Foundation (2019M653018). This work was also supported by the National Natural Science Foundation of China (Grant no. 11704261, 51605485, 11575118) and the Shenzhen Science & Technology Project (Grant no. JCYJ20170817100658231, JCYJ20180507182439574, JCYJ20180305124317872). Funding support was received from the UK Engineering Physics and Science Research Council (EPSRC EP/P018998/1).References
- S. Wei, D. D. Han, L. Guo, Y. Y. He, H. Ding, Y. L. Zhang and F. S. Xiao, J. Colloid Interface Sci., 2014, 431, 17–23 CrossRef CAS PubMed.
- E. Pál, V. Hornok, R. Kun, A. Oszkó, T. Seemann, I. Dékány and M. Busse, J. Colloid Interface Sci., 2012, 378, 100–109 CrossRef PubMed.
- P. Tian, X. Y. Gao, G. Wen, L. S. Zhong, Z. Wang and Z. Guo, J. Colloid Interface Sci., 2018, 532, 517–526 CrossRef CAS PubMed.
- H. Kaden, F. Königer, M. Strømme, G. A. Niklasson and K. Emmerich, J. Colloid Interface Sci., 2013, 411, 16–26 CrossRef CAS PubMed.
- S. Kano, K. Kim and M. Fujii, ACS Sens., 2017, 2, 828–833 CrossRef CAS PubMed.
- B. B. Du, D. X. Yang, X. Y. She, Y. Yuan, D. Mao, Y. J. Jiang and F. F. Lu, Sens. Actuators, B, 2017, 251, 180–184 CrossRef CAS.
- X. H. Le, X. Y. Wang, J. T. Pang, Y. J. Liu, B. Fang, Z. Xu, C. Gao, Y. Xu and J. Xie, Sens. Actuators, B, 2018, 255, 2454–2461 CrossRef CAS.
- S. Choi, H. Y. Yu, J. Jang, M. Kim, S. Kim, H. S. Jeong and D. Kim, Small, 2018, 14, 1703934 CrossRef PubMed.
- B. Chethan, Y. T. Ravikiran, S. C. Vijayakumari, H. G. Rajprakash and S. Thomas, Sens. Actuators, B, 2018, 280, 466–474 CrossRef CAS.
- Y. Dong and G. Feng, Sens. Actuators, B, 1995, 24, 62–64 CrossRef CAS.
- Z. Yuan, H. L. Tai, X. H. Bao, C. H. Liu, Z. B. Ye and Y. D. Jiang, Mater. Lett., 2016, 174, 28–31 CrossRef CAS.
- D. Z. Zhang, H. N. Chen, X. Y. Zhou, D. Y. Wang, Y. B. Jin and S. J. Yu, Sens. Actuators, A, 2019, 295, 687–695 CrossRef CAS.
- J. b. Lin, N. B. Gao, J. M. Liu, Z. X. Hu, H. Fang, X. H. Tan, H. Y. Li, H. Jiang, H. Liu, T. L. Shi and G. L. Liao, J. Mater. Chem. A, 2019, 7, 9068 RSC.
- D. Z. Zhang, C. X. Jiang and J. F. Wu, Sens. Actuators, B, 2018, 273, 176–184 CrossRef CAS.
- X. L. Cha, F. F. Yu, Y. Fan, J. F. Chen, L. Y. Wang, Q. Xiang, Z. M. Duan and J. Q. Xu, Sens. Actuators, B, 2018, 263, 436–444 CrossRef CAS.
- D. Z. Zhang, H. N. Chen, P. Li, D. Y. Wang and Z. M. Yang, IEEE Sens. J., 2019, 19, 2909–2915 CAS.
- E. S. Muckley, L. Collins, A. V. Ievlev, X. Y. Ye, K. Kisslinger, B. G. Sumpter, N. V. Lavrik, C. Y. Nam and I. N. Ivanov, ACS Appl. Mater. Interfaces, 2018, 10, 31745–31754 CrossRef CAS PubMed.
- N. B. Gao, H. Y. Li, W. H. Zhang, Y. Z. Zhang, Y. Zeng, Z. X. Hu, J. Y. Liu, J. J. Jiang, L. Miao, F. Yi and H. Liu, Sens. Actuators, B, 2019, 293, 129–135 CrossRef CAS.
- M. A. Mahjoub, G. Monier, C. R. Goumet, F. Reveret, M. Echabaane, D. Chaudanson, M. Petit, L. Bideux and B. Gruzza, J. Phys. Chem. C, 2016, 120, 11652–11662 CrossRef CAS.
- Z. Q. Wei, Z. K. Zhou, Q. Y. Li, J. C. Xue, A. D. Falco, Z. J. Yang, J. H. Zhou and X. H. Wang, Small, 2017, 13, 1700109 CrossRef PubMed.
- C. Melios, A. Centeno, A. Zurutuza, V. Panchal, C. E. Giusca, S. Spencer, S. P. Silva and O. Kazakova, Carbon, 2016, 103, 273–280 CrossRef CAS.
- L. T. Duy, T. Q. Trung, V. Q. Dang, B. Hwang, S. Siddiqui, I. Y. Son, S. K. Yoon, D. J. Chung and N. E. Lee, Adv. Funct. Mater., 2016, 26, 4329–4338 CrossRef CAS.
- P. Yasaei, A. Behranginia, T. Foroozan, M. Asadi, K. Kim, F. K. Araghi and A. S. Khojin, ACS Nano, 2015, 9, 9898–9905 CrossRef CAS PubMed.
- M. B. Erande, M. S. Pawar and D. J. Late, ACS Appl. Mater. Interfaces, 2016, 8, 11548–11556 CrossRef CAS PubMed.
- S. H. Wu, G. H. Wang, Z. Xue, F. Ge, G. B. Zhang, H. B. Lu and L. Z. Qiu, ACS Appl. Mater. Interfaces, 2017, 9, 14974–14982 CrossRef CAS PubMed.
- D. Z. Zhang, D. Y. Wang, P. Li, X. Y. Zhou, X. Q. Zong and G. K. Dong, Sens. Actuators, B, 2018, 255, 1869–1877 CrossRef CAS.
- T. Alizadeh and M. Shokri, Sens. Actuators, B, 2016, 222, 728–734 CrossRef CAS.
- Z. Lu, Y. Q. Gong, X. J. Li and Y. Zhang, Appl. Surf. Sci., 2017, 399, 330–336 CrossRef CAS.
- S. Yadav, P. Chaudhary, K. N. Uttam, A. Varma, M. Vashistha and B. C. Yadav, Nanotechnology, 2019, 30, 295501 CrossRef PubMed.
- C. Y. Zhu, F. Xu, L. Zhang, M. L. Li, J. Chen, S. H. Xu, G. G. Huang, W. H. Chen and L. T. Sun, Chem.–Eur. J., 2016, 22, 7357–7362 CrossRef CAS PubMed.
- Z. S. Hosseini, A. Iraji zad, M. A. Ghiass, S. Fardindoost and S. Hatamie, J. Mater. Chem. C, 2017, 5, 8966 RSC.
- N. Sakly, A. H. Said and H. B. Ouada, Mater. Sci. Semicond. Process., 2014, 27, 130–139 CrossRef CAS.
- E. Selishcheva, J. Parisi and J. Kolny-Olesiak, J. Nanopart. Res., 2012, 14, 711 CrossRef.
- Y. Yu, X. Guan, X. Li, W. Li, L. Jiang and D. Chen, J. Alloys Compd., 2016, 672, 265–270 CrossRef CAS.
- C. Liang, G. Meng, Y. Lei, F. Phillipp and L. Zhang, Adv. Mater., 2010, 13, 1330–1333 CrossRef.
- E. Selishcheva, J. Parisi and J. Kolny-Olesiak, J. Nanopart. Res., 2012, 14, 711 CrossRef.
- X. Xu, J. Zhuang and X. Wang, J. Am. Chem. Soc., 2008, 130, 12527–12535 CrossRef CAS PubMed.
- X. Zhou, J. Zhang, T. Jiang, X. Wang and Z. Zhu, Sens. Actuators, A, 2007, 135, 209–214 CrossRef CAS.
- X. Wang, B. Ding, J. Yu, M. Wang and F. Pan, Nanotechnology, 2010, 21, 055502 CrossRef PubMed.
- P. J. Qi, T. Zhang, J. R. Shao, B. Yang, T. Fei and R. Wang, Sens. Actuators, B, 2019, 287, 93–101 CrossRef CAS.
- Y. Zhu, J. C. Chen, H. M. Li, Y. H. Zhu and J. Q. Xu, Sens. Actuators, B, 2014, 193, 320–325 CrossRef CAS.
- J. Xie, H. Wang, Y. H. Lin, Y. Zhou and Y. P. Wu, Sens. Actuators, B, 2013, 177, 1083–1088 CrossRef CAS.
- Z. Yuan, H. Tai, Z. Ye, C. Liu, G. Xie, X. Du and Y. D. Jiang, Sens. Actuators, B, 2016, 234, 145–154 CrossRef CAS.
- D. Z. Zhang, D. Y. Wang, X. Q. Zong, G. K. Dong and Y. Zhang, Sens. Actuators, B, 2018, 262, 531–541 CrossRef CAS.
- X. Y. Li, X. D. Chen, Y. Yao, N. Li, X. P. Chen and X. Bi, IEEE Sens. J., 2013, 13, 4749–4756 CAS.
Footnote |
| † Electronic supplementary information (ESI) available. See DOI: 10.1039/c9ra06385d |
| This journal is © The Royal Society of Chemistry 2019 |

