 Open Access Article
Homogeneous coating of carbon nanotubes with tailored N-doped carbon layers for improved electrochemical energy storage
Yi Heab,
Hong Lia,
Qing Zhanga,
Chengen He *b,
Xiaofang Zhanga and
Yingkui Yang
 *ab
*ab
aKey Laboratory of Catalysis and Energy Materials Chemistry of Ministry of Education, Hubei Key Laboratory of Catalysis and Materials Science, South-Central University for Nationalities, Wuhan 430074, China. E-mail: ykyang@mail.scuec.edu.cn
bHubei Engineering Technology Research Centre of Energy Polymer Materials, School of Chemistry and Materials Science, South-Central University for Nationalities, Wuhan 430074, China. E-mail: cehe@scuec.edu.cn
First published on 11th December 2019
Abstract
The combination of activity-enriched heteroatoms and highly-conductive networks is a powerful strategy to craft carbon-based electrodes for high-efficiency electrochemical energy storage. Herein, N-doped carbon (N-C) coated carbon nanotubes (N-CNTs) were fabricated via a facile in situ synthesis of polyimide in the presence of carbon nanotubes (CNTs), followed by carbonization. The polyimide-divided N-C layers were uniformly covered on the surface of CNTs with a tailored layer thickness. The as-fabricated N-CNTs were further used as electrode active materials for energy storage. When employed as the electrodes for supercapacitors, the N-CNTs exhibited a specific capacitance of 63 F g−1 at 0.1 A g−1 (an energy density of 1.4 W h kg−1 at a power density of 20 W kg−1), which was much higher than that of pure N-C (5 F g−1) and CNTs (13 F g−1). The supercapacitor also retained 66.7% of its initial capacitance (42 F g−1 at 10 A g−1) after a 100-fold increase in the current density and nearly 100% of its initial capacitance after running 10![[thin space (1/6-em)]](https://www.rsc.org/images/entities/char_2009.gif) 000 cycles. Furthermore, functioning as an anode material for a Li-ion battery, the N-CNTs also delivered a larger reversible capacity (432 mA h g−1 at 50 mA g−1), higher rate capability, and better cycling stability compared to pure CNTs. The electrochemical performances of the N-CNTs were improved overall due to the synergistic effects of interconnected 3D networks and core–shell structures capable of facilitating electrolyte percolation and charge transportation, enhancing conductivity and surface/interface wettability, and contributing additional pseudocapacitance.
000 cycles. Furthermore, functioning as an anode material for a Li-ion battery, the N-CNTs also delivered a larger reversible capacity (432 mA h g−1 at 50 mA g−1), higher rate capability, and better cycling stability compared to pure CNTs. The electrochemical performances of the N-CNTs were improved overall due to the synergistic effects of interconnected 3D networks and core–shell structures capable of facilitating electrolyte percolation and charge transportation, enhancing conductivity and surface/interface wettability, and contributing additional pseudocapacitance.
1. Introduction
Due to the excessive consumption of traditional fossil energy with the ever serious environmental pollution, it is urgent to explore renewable energy options, such as solar and wind energy.1 However, the limitation of the natural conditions existing in these energy storage options forces us to probe sustainable energy storage devices. Supercapacitors and lithium-ion batteries (LIBs) offer the most promising routes to meet the ever-increasing demand.2 Currently, carbonaceous materials such as activated carbon and biomass-derived carbon have been recognized as leading electrode materials for supercapacitors and the anodes of LIBs due to their low cost, abundant resource, environmental friendliness, good chemical stability, and long cycling life.3 However, most carbonaceous materials have a relatively low capacitance as supercapacitor electrodes owing to the intrinsic energy storage mechanism of the electric double-layer capacitance (EDLC).4,5 In addition, commercial activated carbons offer a limited control over pore size distribution, effective surface area, and electric conductivity, leading to a low energy density. As for LIBs, classical graphite has a relatively low theoretical capacity (372 mA h g−1) and poor rate performance,6 which do not meet the requirement of a high energy density especially at high power density. Therefore, various carbonaceous nanomaterials were developed to possess a large specific surface area, hierarchical pore structures, and a high electrical conductivity, which are beneficial for providing additional storage sites, facilitating ion transport and electron conduction, thus improving the energy density and power density, simultaneously.7 As the most representative 1D carbon material, carbon nanotubes (CNTs) are highly conductive, chemically stable, and thus have been regarded as promising electrode materials for supercapacitors and LIBs.8,9 However, CNTs showed a low specific capacitance due to a relatively low specific surface area and serious entanglement issues. Nanoscaled carbon hybrids consisting of two or more carbon allotropes exhibited enhanced electrochemical properties compared to the simple mixtures.10 For example, Li et al.11 designed a flexible activated carbon/CNT/graphene film, which exhibited a greatly enhanced electrochemical performance compared to single-component electrodes due to the synergistic effects among the carbon allotropes. Nevertheless, it is still a challenge to connect these allotropes seamlessly on the nanometer scale.Introducing heteroatom groups into carbon materials has been proven to be an effective way to modulate their electronic and chemical characters.12,13 It was reported that N-doping could not only improve the wettability between the active material and the electrolyte, but also increase the pseudocapacitive effects and available active sites for lithium storage, thus enhancing the energy density.14,15 Therefore, numerous works have been reported to prepare nanostructured N-doped carbonaceous materials such as a nitrogen plasma treatment16 and thermal annealing with nitrogenous molecules (NH3, urea).17,18 However, the rigorously reactive condition and sufficient yield are still challenging tasks. The carbonization of nitrogen-containing organics such as an abundant biomass and renewable polymers provide another simple, efficient, and economical way to produce N-doped carbons.15,19 Among various organic precursors, polyimide (PI) has been widely used to engineer plastic due to its low-cost. Notably, the affluent imide skeletons made PI a promising candidate for producing N-doped carbon through a simple carbonization process.20,21 Nevertheless, a controllable N-doping level and optimized morphology are still essential for improving the electrochemical performance.22
In this work, N-doped carbon/CNT hybrids (N-CNTs) were successfully synthesized via the carbonization of polyimide/CNT precursors (PI@CNTs), which were prefabricated by an in situ hydrothermal polymerization approach in the presence of CNTs. The as-prepared N-CNTs exhibited a core–shell structure with a controllable N-content up to 3.2 wt%. In addition, the CNT core was beneficial for improving the electronic conductivity, while the N-doped carbon shell provided a high capacitance/capacity. Therefore, the synergistic effects validated the N-CNTs as promising electrode materials for supercapacitor and LIB applications.
2. Experimental
2.1 Materials
1,4,5,8-Naphthalenetetracarboxylic dianhydride (NTCDA) was purchased from Sigma-Aldrich. Ethylenediamine (EDA) was purchased from Sinopharm Chemical Reagent Co., Ltd. All of these chemicals were used as received without further purification. The CNTs were purchased from Chengdu Institute of Organic Chemistry and acidized in a nitric acid solution (15 mol L−1) at 120 °C for 12 h.2.2 Synthesis of N-doped carbon/CNT hybrids (N-CNTs)
The N-CNTs were synthesized via the hydrothermal polymerization of NTCDA and EDA on the surface of the CNTs, followed by carbonization. Typically, NTCDA and EDA monomers were dispersed in deionized water and reacted at 80 °C for 2 h, generating the amide salt precursor. Next, 270 mg of the above precursor was added into the CNT suspension (30 mg in 30 mL of water) and stirred for 15 min to give a homogeneous mixture, which was then transferred into a Teflon-lined autoclave and hydrothermally polymerized at 180 °C for 12 h. The generated sediments, named PI@CNT1, were washed and then dried at 80 °C for 12 h. In order to control the content of N-doped carbon in the hybrid, the masses of the reactants were decreased to 240 mg for the amide salt precursor and 60 mg for the CNTs, and the resulting powder was thus named PI@CNT2. Finally, the powders of PI@CNT1 and PI@CNT2 were annealed at a carbonization temperature of 900 °C for 2 h under argon protection with a heating rate of 5 °C min−1, and the resulting products were named N-CNT1 and N-CNT2, respectively. A pure polyimide was also prepared with a similar process without adding CNTs, and the corresponding product was N-doped carbon (N-C).2.3 General characterization
The morphologies were characterized by SU-8010 scanning electron microscope (SEM, Hitachi, Japan) and transmission electron microscope (TEM, TECNAI G220 S-TWIN). Fourier transform infrared (FTIR) spectra were investigated by a NEXUS 470 FTIR spectrometer (Thermo Nicolet, USA). X-ray diffraction (XRD) data were collected by a D/Max 2400 X-ray diffractometer (Rigaku, Japan) using a CuKα source with a diffraction angle ranging from 5 to 80°. Raman spectroscopy was recorded on a Renishaw Raman microscope using a 633 laser. The thermal stability was measured on a Diamond TG/F DTG analyzer (TGA, Mettler Toledo, Switzerland) at a rate of 10 °C min−1 between 30 and 900 °C. The chemical constitutions and the nitrogen content of the samples were analysed by X-ray photoelectron spectroscopy (XPS, Multilab 2000).2.4 Electrochemical measurements
The electrochemical performances were collected on a CHI 760E electrochemical workstation (Chenhua, Shanghai) and battery test system (CT2001A, LANHE). The supercapacitive performances of the N-CNTs were evaluated by a two-electrode system. The working electrodes were prepared by loading slurry containing N-CNTs (80 wt%), super P (10 wt%), and polyvinylidene fluoride (10 wt%) on stainless steel sheets, which were dried in a vacuum at 80 °C for 12 h, pressed under 10 MPa, and then immersed into the 1 mol L−1 H2SO4 electrolyte solution overnight. Afterwards, two of the as-prepared working electrodes with an identical weight were separated by a separator and assembled into a symmetrical supercapacitor in a CR2016 coin cell. Cycle voltammetry (CV), galvanostatic charge–discharge (GCD), and electrochemical impedance spectroscopy (EIS) measurements of the supercapacitors were preformed on the CHI 760E electrochemical workstation. The specific capacitance (C, F g−1), power density (P, W h kg−1), and energy density (E, W kg−1) of the supercapacitors were calculated based on the GCD data according to the following formulas:23where I, Δt, m, and ΔV represented the current density (A), discharge time (s), total mass of the two electrodes (g), and voltage window (V), respectively.
For the LIB tests, the working electrodes were prepared by scraping the slurry on the aluminum foil current collector and vacuum drying at 80 °C for 12 h. After being pressed by a rolling machine, the electrode sheet was punched into 10 mm diameter electrodes, and the mass of the active material on one electrode was about 0.8 to 1.2 mg. The as-prepared working electrodes were transferred into a glove box to construct the LIBs using lithium foil as the counter electrode and 1 mol L−1 LiPF6 in ethylene carbonate and dimethyl carbonate (EC/DMC = 1![[thin space (1/6-em)]](https://www.rsc.org/images/entities/char_2009.gif) :
:![[thin space (1/6-em)]](https://www.rsc.org/images/entities/char_2009.gif) 1, vol/vol) as the electrolyte. The CV curves were tested at 0.2 mV s−1. The GCD curves at various current densities and cycling stabilities for the LIBs were performed on LANHE instrument testing systems.
1, vol/vol) as the electrolyte. The CV curves were tested at 0.2 mV s−1. The GCD curves at various current densities and cycling stabilities for the LIBs were performed on LANHE instrument testing systems.
3. Results and discussion
3.1 Synthesis and structural characteristics
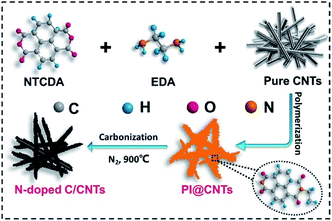
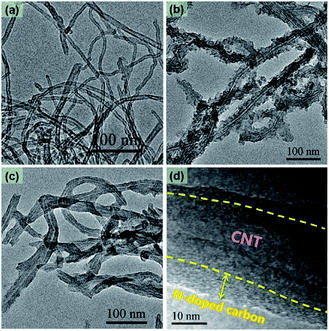
A graphical sketch of the synthetic process of the N-CNTs designed in this work is shown in Scheme 1. First, the NTCDA and EDA monomers were combined into an amide salt precursor, which was then hydrothermally polymerized into PI on the surface of the CNTs. Second, the generated PI@CNTs were carbonized at 900 °C, and thus the PI was transformed into N-doped carbon, generating the N-CNTs.The TEM images of the as-prepared products are shown in Fig. 1. The acidified CNTs (Fig. 1a) exhibited a bare nanotube structure with an average diameter about 10 nm. There were many carboxyl groups on the surface of the acidified CNTs, which acted as nucleation sites for the polymerization of the monomers. Therefore, PI was uniformly coated on the CNTs during the hydrothermal process.24 As shown in Fig. 1b, PI@CNT1 had a rough surface corresponding to the coating of PI. The average diameter was increased to ∼35 nm. In comparison, N-CNT1 presented a relatively smooth surface and the average diameter was decreased to ∼22 nm (Fig. 1c) due to the thermal transformation of PI during the carbonization process at a high temperature, generating a N-doped carbon shell on the surface of the CNTs. The high-resolution TEM image of N-CNT1 is shown in Fig. 1d. The PI derived N-doped carbon on the CNTs exhibited an amorphous structure with a measured thickness of ∼6 nm, which contributed an abundant number of micropores for the hybrids, thus enhancing the specific surface area and the capacitance accordingly. The electric conductivity of these samples were also tested with a four-probe resistivity measuring technique. The N-CNT1 and N-CNT2 exhibited electric conductivities of 67.7 and 57.1 S cm−1, respectively, which were higher than that of pure N-C (26.0 S cm−1) due to the highly conductive CNT cores within the composites.
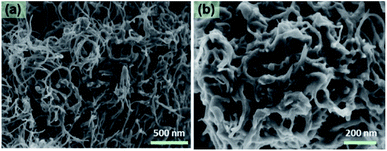
The SEM images of N-CNT1 (Fig. 2) showed that the 1D nanotube structures were constructed into a stable 3D interwoven network, which formed large quantities of communicated mesopores and was beneficial for electrolyte leakage, therefore, enhancing the available surface area and accelerating the ion diffusion rate of the electrodes. This finally lead to improvements in the specific capacitance and rate performance of the supercapacitor.6
The proportion of PI in the PI@CNTs was adjusted to control the N-doping content in the hybrids. Fig. 3a shows the TGA curves of the pure CNTs, PI, PI@CNT1, and PI@CNT2. The curve of the pure CNTs gave a total weight loss of 12% over 800 °C due to the dissociation of oxygen-containing groups introduced by acidification.6 In contrast, the pure PI, PI@CNT1 and PI@CNT2 gave a drastic weight loss at around 550 °C corresponding to the pyrolysis of PI, and retained 23%, ∼30%, and 34% of the weight over 800 °C, respectively. As a result, the weight proportions of PI in PI@CNT1 and PI@CNT2 were calculated to be 89% and 82%, respectively,25 which was close to the experimental design. FTIR measurements were also performed to determine the transformation of the PI@CNTs and the chemical composition of the N-CNTs. As shown in Fig. 3b, the absorption peaks of PI@CNT1 at around 1670 and 1150–1260 cm−1 were attributed to the C![[double bond, length as m-dash]](https://www.rsc.org/images/entities/char_e001.gif) O and C–N of PI in the hybrids, respectively. However, these characteristic peaks disappeared in the curves of N-CNT1 and N-CNT2, demonstrating the pyrolyzation of PI after the carbonization process. The residual peaks at around 1050 cm−1 were assigned to the C–O or C–N in the derived N-doped carbon.19,26
O and C–N of PI in the hybrids, respectively. However, these characteristic peaks disappeared in the curves of N-CNT1 and N-CNT2, demonstrating the pyrolyzation of PI after the carbonization process. The residual peaks at around 1050 cm−1 were assigned to the C–O or C–N in the derived N-doped carbon.19,26
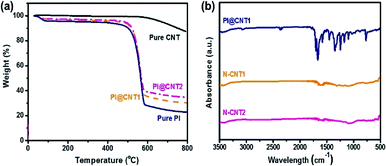 | ||
| Fig. 3 (a) TGA curves of pure PI, PI@CNT1, and PI@CNT2. (b) FTIR spectra of PI@CNT1, N-CNT1, and N-CNT2. | ||
To identify the crystal structure of the N-CNTs, the XRD patterns were also determined. All of the curves for the pure CNT, N-CNT1, and N-CNT2 had a broad diffraction peak at around 2θ = 25.6° (Fig. 4a), corresponding to the (002) diffraction. The broad peak reflected a characteristic of an amorphous carbon structure.27 Moreover, the additional peak at 2θ = 43° was assigned to the (100) diffraction, indicating a much less developed in-plane graphitic lattice. Moreover, the Raman spectra of the pure CNT, N-CNT1, and N-CNT2 (Fig. 4b) showed two prominent peaks at around 1341 and 1578 cm−1, which were attributed to the disordered carbonaceous structure (D band) and sp2 electron configuration in the imperfect graphite layer (G band), respectively. Normally, the intensity ratio of the D and G bands (ID/IG) is used to reflect the defects or disorder degree of carbonaceous materials.19 The calculated ID/IG value was 1.02 for pure CNT, and the defects were introduced from the acidization process. In comparison, the ID/IG value was increased to 1.05 and 1.06 for N-CNT1 and N-CNT2, respectively, due to the introduction of disorder N-doped carbon coated on the surface of the CNT.28,29
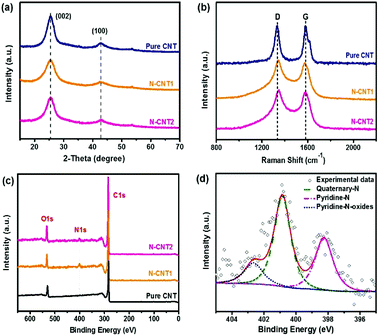 | ||
| Fig. 4 (a) XRD, (b) Raman, and (c) XPS spectra of pure CNT, N-CNT1 and N-CNT2. (d) High resolution N 1s XPS spectra of N-CNT1. | ||
XPS spectra were further recorded to analyze the nitrogen content of the N-CNTs. As shown in Fig. 4c, the XPS spectrum of pure CNT shows two main peaks at 284 eV (C 1s) and 531 eV (O 1s). The O element in the pure CNT comes from the oxygen-containing groups introduced by acidization, which can act as nucleation sites for the generation of the PI chains. In comparison, the curves of N-CNT1 and N-CNT2 present an additional peak at 400 eV, which is indexed to N 1s. The calculated N content was 3.2 wt% and 2.6 wt% for N-CNT1 and N-CNT2, respectively. The existence of the N element in the composites indicated the formation of N-doped carbon on the surface of the CNTs, which was verified by the TEM images of N-CNTs in Fig. 1. The high-resolution N 1s of N-CNT1 was further deconvoluted into three peaks at the binding energies of 398.3, 400.9, and 402.7 eV (Fig. 4d), corresponding to pyridine-N (N-6), quaternary-N (N-Q), and pyridine-N-oxide groups, respectively.30 Recent reports demonstrated that pyridine-N could contribute high pseudocapacitance, while quaternary-N could increase the electron transfer and electrical conductivity.31 Therefore, the N-CNTs were expected to show superior electrochemical performances compared to the pure CNTs.
3.2 Electrochemical performance of N-CNTs for supercapacitors
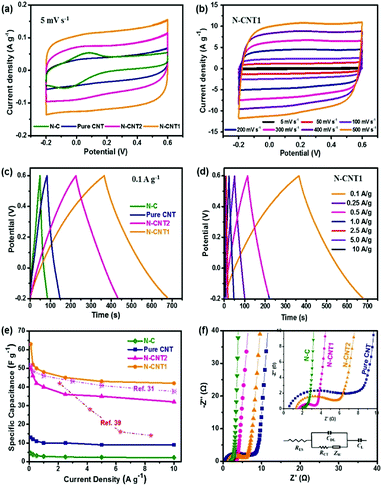
The electrochemical performances of N-CNTs as electrode materials for the supercapacitor were first evaluated. As shown in Fig. 5a, the pure CNT, N-CNT1, and N-CNT2 based supercapacitors presented nearly rectangular shapes in the potential range of −0.2 to 0.8 V, indicating a main double-layer capacitor (EDLC) characteristic.32 Noticeably, a slight hump increased at around 0 V in the curves of N-C, N-CNT1, and N-CNT2, which was attributed to the pseudocapacitance effect of the N-doping groups.33 Moreover, N-CNT1 and N-CNT2 exhibited a much larger response for the current densities than that of pure CNT and N-C, reflecting a significant increase in the capacitive performance that was attributed to the synergistic effects between the CNT core and the N-doped carbon shell. The former contributed a 3D conductive substrate for facilitating electrolyte percolation and charge transportation, while the latter enhanced the surface/interface wettability as well as the pseudocapacitance contribution. In addition, the CV curves of N-CNT1 maintained the rectangular-like shape, even at an extremely high scan rate up to 500 mV s−1 (Fig. 5b), indicating an excellent electrochemical reversibility and rate performance.GCD experiments were also performed at a current density range from 0.1 to 10 A g−1. Fig. 5c shows the GCD curves of the pure CNTs, N-C, N-CNT1, and N-CNT2 at 0.1 A g−1. All of the curves presented a quasi-triangular and symmetrical shape, representing the main EDLC nature and a good electrochemical reversibility.34 The slight bends from the linear GCD curves of the N-CNTs further implied the substantial pseudocapacitance contributions derived from the N-doping groups, which were in agreement with the CV results above. The calculated specific capacitance of N-CNT1 was 63 F g−1 at a current density of 0.1 A g−1, which was much higher than that of pure CNT (13 F g−1), N-C (5 F g−1), and N-CNT2 (50 F g−1). The great enhancement in the capacitance was attributed to the N-doped carbon shell, which not only enhanced the EDLC capacitance by improving the accessible surface area, but also contributed additional pseudocapacitance by participating in faradaic charge-transfer reactions.35 In addition, the CNT core acted as a conductive substrate to prevent the aggregation of PI during the in situ polymerization process, therefore improving the utilization of N-doped carbon and hence the specific capacitance. Furthermore, the GCD curve of N-CNT1 exhibited a negligible voltage drop, even at a high current density up to 10 A g−1 (Fig. 5d). This finding suggested a low instinct resistance, which was due to the interconnected pore structure and the high conductive CNT core that promoted ion diffusion and electron conduction at the same time. As a result, N-CNT1 achieved an excellent rate performance with 66.7% (42 F g−1 at 10 A g−1) capacitance retention when the current density increased by 100 times (Fig. 5e). The excellent capacitive performance of N-CNT1 was also superior or comparable to those of other N-doped carbonaceous materials.31,36,37
The Nyquist plots of the pure CNTs, N-C, N-CNT1, and N-CNT2 are shown in Fig. 5f. The intercept on the real axis is the intrinsic resistance (RS) containing the electrode resistance, electrolyte resistance, and contact resistance. The semicircle in the high frequency region stands for the interfacial charge-transfer resistance (RCT) between the electrode and electrolyte. The vertical line at the low frequency region represents the dominance of an ideal EDLC behavior (CDL), and the inclined line (∼45°) at the medium frequency region was ascribed to the Warburg impedance (ZW). An equivalent circuit model (inset of Fig. 5f) was used to fit the Nyquist plots.38 The fitted RS for the N-C, N-CNT1, and N-CNT2 electrodes are 2.0, 1.5, and 1.2 Ω, respectively, sharing a consistent trend with the above four-probe results. The reduced intrinsic resistances of the N-CNTs were attributed to the highly electric conductive CNT cores in the composite. Meanwhile, the RCT value for N-CNT1 was 1.7 Ω, which was much lower than that of pure CNT (6.7 Ω) and N-CNT2 (3.9 Ω). The enhanced ion conductivity of the composite-based electrodes was due to the N-doping that improved the wettability between the electrolyte and electrode, and therefore promoted the charge transport and enhanced electrochemical activity of the electrodes.
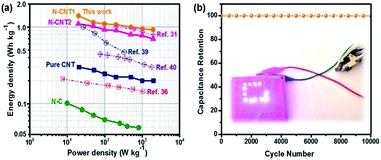
To evaluate the practical prospect of N-CNTs for broad applications in supercapacitors, the Ragone plots of the as-assembled supercapacitors are displayed in Fig. 6a. The N-CNT1 based supercapacitor achieved a high energy density of 1.4 W h kg−1 at a power density of 20 W kg−1. The energy density was suppressed with the increase in the power density due to the limited ion transfer within the electrode at a high current density. Nevertheless, the N-CNT1-based supercapacitor still maintained a power density of 0.93 W h kg−1 at a relatively high power density of 2000 W kg−1. Apparently, the energy storage property of N-CNT1 was superior to that of the pure.
CNTs, N-C, N-CNT2, and some other N-doped carbonaceous supercapacitors.31,36,39,40 The long-term cycling stability of N-CNT1 was also investigated by repeating GCD measurements at a current density of 10 A g−1 (Fig. 6b). It maintained almost 100% of the initial capacitance over 10![[thin space (1/6-em)]](https://www.rsc.org/images/entities/char_2009.gif) 000 cycles, indicating a prominent reversibility. In addition, after charging for 20 s, the N-CNT1 based supercapacitor lit twelve LED lamps brightly for 30 s as shown in the inserted Fig. 6b, which proved a promising prospect of the N-CNTS in energy storage applications.
000 cycles, indicating a prominent reversibility. In addition, after charging for 20 s, the N-CNT1 based supercapacitor lit twelve LED lamps brightly for 30 s as shown in the inserted Fig. 6b, which proved a promising prospect of the N-CNTS in energy storage applications.
3.3 Electrochemical performance of N-CNT1 as a LIB anode
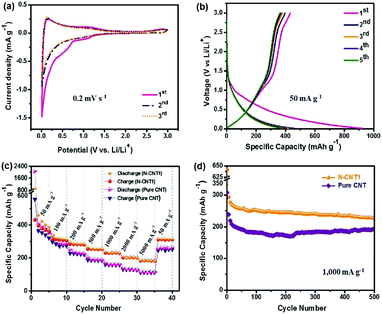
In order to further investigate the energy storage property of N-CNT1, a Li-ion half-cell was fabricated using N-CNT1 as an anode material. Fig. 7a shows the CV curves of the N-CNT1 electrode at a scan rate of 0.2 mV s−1 within a potential range of 0.01–3.0 V (vs. Li/Li+). A reduction peak appeared at around 0.7 V in the 1st cycle and disappeared in the following cycles, which corresponded to the formation of the solid electrolyte interface (SEI) layer.6 The peak near 0 V in the cathodic scan was ascribed to the Li+ intercalation into the N-CNT1 electrode, while the peak at around 0.14 V in the anodic scan corresponded to Li+ de-intercalation from the graphitic layers. Another peak at 1.1 V represented delithiation from the amorphous structures.10 Fig. 7b shows the GCD profiles of N-CNT1 in the initial three cycles at a current density of 50 mA g−1. The reversible capacity was 432 mA h g−1 during the first cycle, which was much higher than the theoretical capacity of graphite (372 mA h g−1).10,41 In addition, it also achieved a higher initial coulombic efficiency of 47% at 50 mA g−1, which was more than that of pure CNT (26%). Fig. 7c shows the rate capabilities of N-CNT1 and pure CNT. The current density was increased from 100 to 5000 mA g−1 and finally returned to 50 mA g−1. The N-CNT1 delivered average capacities of 312, 283, 255, 230, 201, and 184 mA h g−1 at 100, 200, 500, 1000, 2000, and 5000 mA g−1, respectively. After cycling at various rates, the specific capacity could still recover to 316 mA h g−1 when the current density returned to 50 mA g−1, indicating a high reversibility and good rate capability. In comparison, the pure CNT exhibited a comparable capacity of 354 mA h g−1 at 50 mA h g−1, while only 112 mA h g−1 was maintained at 5000 mA g−1. The LIB performance of N-CNT1 was also superior to some reported N-doping carbons.42,43 The excellent electrochemical performance of N-CNT1 was attributed to the N-doped carbon, which not only increased the capacity by contributing more active sites for Li+ adsorption, but also improved the ion-transfer efficiency via enhancing the wettability of the active material to the electrolyte.19,20 Moreover, the cycling stability of the N-CNT1 electrode was further tested at a high current density of 1000 mA h g−1 (Fig. 7d). It exhibited a high initial reversible capacity of 346 mA h g−1 and maintained 248 mA h g−1 after 500 cycles. However, the pure CNTs only maintained a low specific capacity of 187 mA h g−1 over 500 cycles.4. Conclusions
A N-doped carbon layer was successfully coated on the surface of CNTs through the carbonation of the PI@CNTs hybrids, which were synthesized via an in situ hydrothermal polymerization approach in the presence of CNTs. The as-obtained N-CNTs had a core–shell structure with a high nitrogen content (3.2 wt%). Consequently, N-CNTs were used as an electrode material for the supercapacitor, which exhibited the highest specific capacitance of 63 F g−1 at 0.1 A g−1 and retained 66.7% of the capacitance when the current density increased by 100 times. It also maintained almost 100% of the initial capacitance over 10![[thin space (1/6-em)]](https://www.rsc.org/images/entities/char_2009.gif) 000 cycles. Furthermore, the N-CNT1 also acted as the anode material of the LIBs and achieved a high reversible capacity of 432 mA h g−1 at 50 mA h g−1 as well as an excellent rate capability and good cycling stability. The results indicated that the N-CNTs are promising electrode materials for high-performance energy storage devices.
000 cycles. Furthermore, the N-CNT1 also acted as the anode material of the LIBs and achieved a high reversible capacity of 432 mA h g−1 at 50 mA h g−1 as well as an excellent rate capability and good cycling stability. The results indicated that the N-CNTs are promising electrode materials for high-performance energy storage devices.
Conflicts of interest
There are no conflicts to declare.Acknowledgements
This work was supported by the National Natural Science Foundation of China (51273057 and 51673061) and the Fundamental Research Funds for the Central Universities (CZP19001).References
- C. P. Grey and J. M. Tarascon, Nat. Mater., 2016, 16, 45–56 CrossRef CAS.
- D. Larcher and J. M. Tarascon, Nat. Chem., 2015, 7, 19–29 CrossRef CAS PubMed.
- W. Zhong-Li, X. Dan, W. Heng-Guo, W. Zhong and Z. Xin-Bo, ACS Nano, 2013, 7, 2422 CrossRef PubMed.
- D. C. Guo, F. Han and A. H. Lu, Chem.–Eur. J., 2015, 21, 1520–1525 CrossRef CAS PubMed.
- Y. Yang, C. Han, B. Jiang, J. Iocozzia, C. He, D. Shi, T. Jiang and Z. Lin, Mater. Sci. Eng., R, 2016, 102, 1–72 CrossRef.
- J. H. Kim, M. Byeon, Y. C. Jeong, J. Y. Oh, Y. Jung, N. Fechler, S. J. Yang and C. R. Park, J. Mater. Chem. A, 2017, 5, 20635–20642 RSC.
- K. Mi, Y. Jiang, J. Feng, Y. Qian and S. Xiong, Adv. Funct. Mater., 2016, 26, 1571–1579 CrossRef CAS.
- T. T. Ye, Y. Sun, X. Zhao, B. P. Lin, H. Yang, X. Q. Zhang and L. X. Guo, J. Mater. Chem. A, 2018, 6, 18994–19003 RSC.
- Z. Zhang, L. Wang, Y. Li, Y. Wang, J. Zhang, G. Guan, Z. Pan, G. Zheng and H. Peng, Adv. Energy Mater., 2017, 7, 1601814 CrossRef.
- S. Zhu, K. Xu, S. Sui, J. Li, L. Ma, C. He, E. Liu, F. He, C. Shi, L. Miao, J. Jiang and N. Zhao, J. Mater. Chem. A, 2017, 5, 19175–19183 RSC.
- X. Li, Y. Tang, J. Song, W. Yang, M. Wang, C. Zhu, W. Zhao, J. Zheng and Y. Lin, Carbon, 2018, 129, 236–244 CrossRef CAS.
- Y. Ba, W. Pan, S. Pi, Y. Zhao and L. Mi, RSC Adv., 2018, 8, 7072–7079 RSC.
- H. Luo, Z. Liu, L. Chao, X. Wu, X. Lei, Z. Chang and X. Sun, J. Mater. Chem. A, 2015, 3, 3667–3675 RSC.
- Y. Lu, C. He, P. Gao, S. Qiu, X. Han, D. Shi, A. Zhang and Y. Yang, J. Mater. Chem. A, 2017, 5, 23513–23522 RSC.
- J. Hou, C. Cao, F. Idrees and X. Ma, ACS Nano, 2015, 9, 2556–2564 CrossRef CAS PubMed.
- Y. Miao, Y. Ma and Q. Wang, ACS Sustainable Chem. Eng., 2019, 7, 7597–7608 CrossRef CAS.
- Q. Wu, G. Zhang, M. Gao, L. Huang, L. Li, S. Liu, C. Xie, Y. Zhang and S. Yu, J. Alloys Compd., 2019, 786, 826–838 CrossRef CAS.
- Y. Cheng, Q. Zhang, C. Fang, Z. Huang, J. Chen, L. Wu and H. Wang, J. Electrochem. Soc., 2019, 166, A1231–A1238 CrossRef CAS.
- Q. Wu, J. Liu, C. Yuan, Q. Li and H.-g. Wang, Appl. Surf. Sci., 2017, 425, 1082–1088 CrossRef CAS.
- L. Qie, W. M. Chen, Z. H. Wang, Q. G. Shao, X. Li, L. X. Yuan, X. L. Hu, W. X. Zhang and Y. H. Huang, Adv. Mater., 2012, 24, 2047–2050 CrossRef PubMed.
- W. Liu, J. Mei, G. Liu, Q. Kou, T. Yi and S. Xiao, ACS Sustainable Chem. Eng., 2018, 6, 11595–11605 CrossRef CAS.
- M.-J. Kwak, A. Ramadoss, K.-Y. Yoon, J. Park, P. Thiyagarajan and J.-H. Jang, ACS Sustainable Chem. Eng., 2017, 5, 6950–6957 CrossRef CAS.
- Z. B. Fang, S. U. Rehman, M. Z. Sun, Y. P. Yuan, S. W. Jin and H. Bi, J. Mater. Chem. A, 2018, 6, 21131–21142 RSC.
- N. Wang, Y. Wang, Z. Yu and G. Li, Composites, Part A, 2015, 78, 341–349 CrossRef CAS.
- Y. Zhang, W. Fan, H. Lu and T. Liu, Electrochim. Acta, 2018, 283, 1763–1772 CrossRef CAS.
- Y. Hu, X. Tong, H. Zhuo, L. Zhong and X. Peng, ACS Sustainable Chem. Eng., 2017, 5, 8663–8674 CrossRef CAS.
- J. Niu, R. Shao, J. Liang, M. Dou, Z. Li, Y. Huang and F. Wang, Nano Energy, 2017, 36, 322–330 CrossRef CAS.
- D. K. Kim, N. D. Kim, S. K. Park, K. D. Seong, M. Hwang, N. H. You and Y. Piao, J. Power Sources, 2018, 380, 55–63 CrossRef CAS.
- W. Yang, W. Yang, A. Song, G. Sun and G. Shao, Nanoscale, 2018, 10, 816–824 RSC.
- Y. Feng, B. Wang, X. Li, Y. Ye, J. Ma, C. Liu, X. Zhou and X. Xie, Carbon, 2019, 146, 650–659 CrossRef CAS.
- M. Sevilla, L. Yu, L. Zhao, C. O. Ania and M.-M. Titiricic, ACS Sustainable Chem. Eng., 2014, 2, 1049–1055 CrossRef CAS.
- G. Lin, Y. Jiang, C. He, Z. Huang, X. Zhang and Y. Yang, Dalton Trans., 2019, 48, 5773–5778 RSC.
- B. Chang, H. Yin, X. Zhang, S. Zhang and B. Yang, Chem. Eng. J., 2017, 312, 191–203 CrossRef CAS.
- X. Zhang, H. Li, W. Zhang, Z. Huang, C. P. Tsui, C. Lu, C. He and Y. Yang, Electrochim. Acta, 2019, 301, 55–62 CrossRef CAS.
- T. Zhu, J. Zhou, Z. Li, S. Li, W. Si and S. Zhuo, J. Mater. Chem. A, 2014, 2, 12545 RSC.
- G. Wang, H. Wang, X. Lu, Y. Ling, M. Yu, T. Zhai, Y. Tong and Y. Li, Adv. Mater., 2014, 26, 2676–2682 CrossRef CAS PubMed.
- J. Kim, C. Young, J. Lee, M. S. Park, M. Shahabuddin, Y. Yamauchi and J. H. Kim, Chem. Commun., 2016, 52, 13016–13019 RSC.
- C. He, S. Qiu, S. Sun, Q. Zhang, G. Lin, S. Lei, X. Han and Y. Yang, Energy Environmental Materials, 2018, 1, 88–95 CrossRef CAS.
- K. Xiao, L. X. Ding, G. Liu, H. Chen, S. Wang and H. Wang, Adv. Mater., 2016, 28, 5997–6002 CrossRef CAS.
- C. Zhu, T. Liu, F. Qian, T. Y. Han, E. B. Duoss, J. D. Kuntz, C. M. Spadaccini, M. A. Worsley and Y. Li, Nano Lett., 2016, 16, 3448–3456 CrossRef CAS.
- R. Mukherjee, A. V. Thomas, D. Datta, E. Singh, J. Li, O. Eksik, V. B. Shenoy and N. Koratkar, Nat. Commun., 2014, 5, 3710 CrossRef CAS.
- L. G. Bulusheva, A. V. Okotrub, A. G. Kurenya, H. K. Zhang, H. J. Zhang, X. H. Chen and H. H. Song, Carbon, 2011, 49, 4013–4023 CrossRef CAS.
- W. Ren, D. J. Li, H. Liu, R. Mi, Y. Zhang, L. Dong and L. Dong, Electrochim. Acta, 2013, 105, 75–82 CrossRef CAS.
| This journal is © The Royal Society of Chemistry 2019 |


