DOI:
10.1039/C9RA06265C
(Paper)
RSC Adv., 2019,
9, 33607-33616
Platinum nanoparticles decorating a biomass porous carbon nanocomposite-modified electrode for the electrocatalytic sensing of luteolin and application
Received
12th August 2019
, Accepted 3rd October 2019
First published on 18th October 2019
Abstract
A sensitive electrochemical method was proposed for the determination of luteolin based on platinum (Pt) nanoparticles decorating a biomass porous carbon (BPC) composite-modified carbon ionic liquid electrode (CILE). For Pt–BPC/CILE, a pair of well-defined redox peaks of luteolin appeared with enhanced peak currents and the positive movement of peak potentials, proving the electrocatalytic activity of the Pt–BPC nanocomposite for redox reaction. The results can be ascribed to the porous structure of BPC, the catalytic activity of Pt nanoparticles and their synergistic effects. Electrochemical parameters were calculated via cyclic voltammetry and differential pulse voltammetry. The results showed that the oxidation peak currents increased linearly with the concentration of luteolin in the range from 0.008 to 100.0 μmol L−1, with a detection limit of 2.6 ± 0.054 nmol L−1. The analytical performance of this sensor was checked by the detection of luteolin contents in a real Duyiwei capsule sample with satisfactory results.
1 Introduction
Luteolin (3′,4′,5,7-tetrahydroxyflavone) belongs to a family of bioactive flavonoids found widely in food, such as celery, green pepper, perilla leaf, seeds and chamomile.1 It has attracted considerable public attention due to functions such as cardiovascular protection, anti-cancer, anti-ulcer, anti-viral, anti-inflammatory, anti-allergy and cataract prevention.2,3 Various methods have been reported for the determination of luteolin in flavonoids, including gas chromatography,4 high-performance liquid chromatography,5,6 capillary electrophoresis7,8 spectrophotometry9 and electrochemistry.10 Luteolin is an electroactive compound with hydroxyl groups on its structure, therefore electrochemical methods can be used for luteolin analysis with high sensitivity, simple operation and low cost. Tesio et al.11 described an electrochemical sensor for the direct quantification of luteolin based on the use of glassy carbon electrodes modified with multi-walled carbon nanotubes dispersed in a low molecular weight polyethylenimine.
Carbon-based nanomaterials have attracted wide attention in various fields, including energy, sensors, environmental and supercapacitors.12,13 Various types of biomass, such as coconut shell, mango leaves, guava leaves, water hyacinth, water bamboo, pumpkin stems and eggplants, have been used to synthesize porous carbon materials14–20 that exhibit large specific surface area, high conductivity, adjustable pore structure and low cost. In general, the preparation of biomass porous carbon (BPC) needs to undergo an activation and carbonization process, which can improve the material's performance. In the case of chemical activation, NaOH and KOH are frequently used as activators, which is a facile approach to develop porous structures with the generation of abundant pores.21 The applications of BPC in the fields of electrochemical sensors have been reported. Veeramani et al.22 reported heteroatom-enriched activated carbon derived from the renewable banana-stems for electrochemical glucose sensors. Kim et al.23 reported a two-step activation of biomass-derived carbon for the electrochemical determination of acetaminophen. Veerakumar et al.24 prepared Pd nanoparticles on porous-activated carbons derived from waste biomass feedstock for the detection of toxic metal ions. Chen et al.25 synthesized biomass-derived 3D hierarchical N-doped porous carbon for the simultaneous determination of dihydroxybenzene isomers.
Compared with the bare electrode, electrode modification with precious metal nanoparticles shows specific properties for the development of sensing platforms with strong surface plasmon resonance,26 fast electron transfer rate27 and outstanding catalytic activities.28 Recently, platinum (Pt) nanoparticle-modified electrodes have been explored to develop effective electrochemical sensors. For example, Rong et al.29 constructed a non-enzymatic glucose sensor using highly dispersed Pt nanoparticles supported on carbon nanotubes as the sensing interface. Han et al.30 prepared mesoporous silica particles incorporated with poly(amidoamine) dendrimer-encapsulated Pt nanoparticle-modified electrodes for the determination of glucose. Xu et al.31 reported an electrochemical glucose biosensor based on a Pt-modified Au nanowire array.
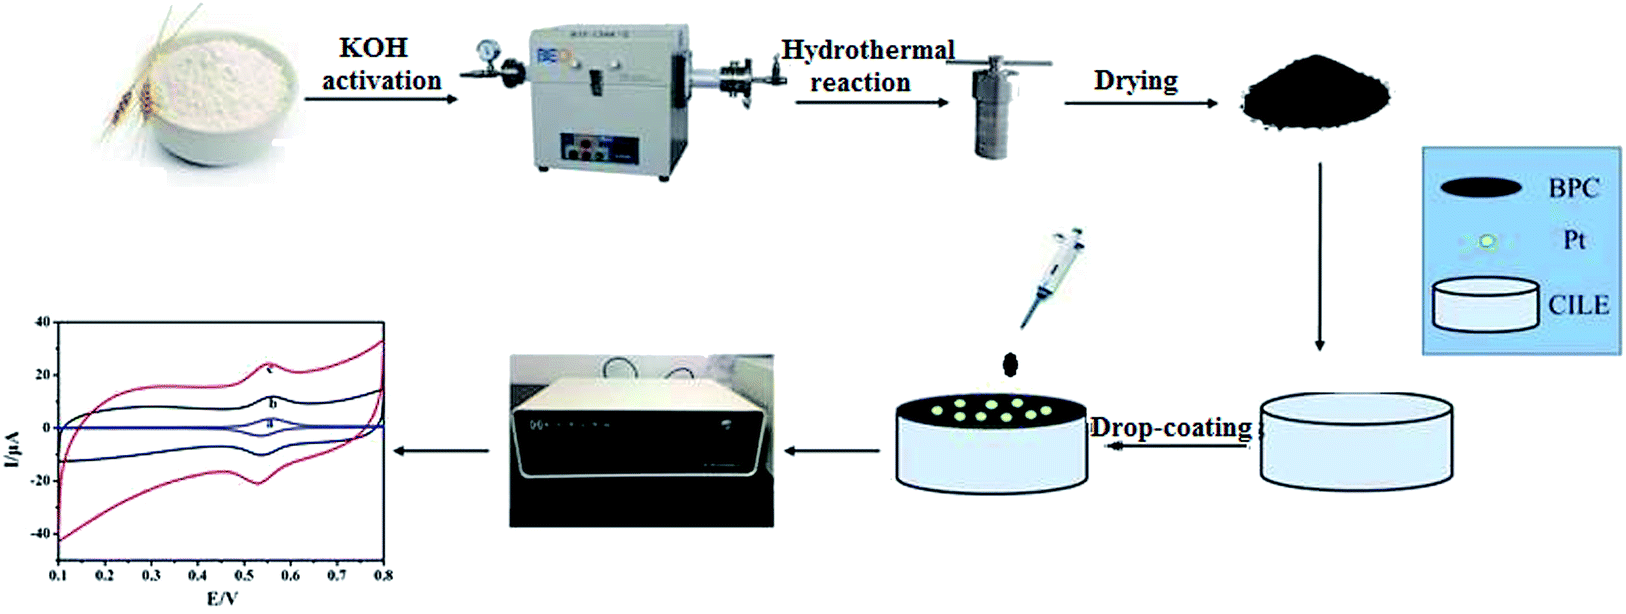
In this study, we present a method for synthesizing BPC via a carbonization and activation process using wheat flour as the raw material. Then, Pt–BPC nanocomposites were prepared via a hydrothermal method and were further applied on the surface of a carbon ionic liquid electrode (CILE) to get an electrochemical sensing platform. The CILE was prepared using a high-conductive ionic liquid as the modifier and was used as the basic electrode due to its specific characteristics such as high conductivity, good anti-pollution ability, excellent detection sensitivity, specific electrocatalytic behaviors.32,33 Various kinds of CILEs or modified CILEs have been used in the fields of electroanalysis and electrochemical sensors.34–37 Therefore, CILE is used as the bare electrode with the Pt–BPC nanocomposite as the modifier. BPC exhibits larger surface area, higher conductivity and porous structure, which can enhance the electrochemical responses of luteolin through adsorbing more luteolin on the electrode surface. Pt nanoparticles have excellent conductivity, higher surface energy and catalytic effects, which are beneficial for the electron transfer of luteolin. The Pt nanoparticles and BPC were combined to form a hybrid material with synergistic effects, which can prevent the agglomeration of Pt nanoparticles, reduce the electron transfer resistance, and exhibit catalytic effects in luteolin electrooxidation. The electrochemical behaviors of luteolin were further investigated in detail on Pt–BPC/CILE with calculated electrochemical parameters. The flow diagram of this experiment is shown in Scheme 1, which elucidates the fabrication process of the Pt–BPC nanocomposite and the construction of the electrochemical sensor with Pt–BPC/CILE for luteolin analysis.
 |
| | Scheme 1 The flow diagram for the synthesis of the Pt–BPC nanocomposite and the construction procedure of the electrochemical sensor for luteolin analysis. | |
2 Experimental section
2.1 Chemicals and solutions
1-Hexylpyridinium hexafluorophosphate (HPPF6, Lanzhou Yulu Fine Chemical Co. Ltd., China), graphite powder (average particle size 30 μm, Shanghai Colloid Chemical Plant, China), wheat flour (purchased from local supermarket), K2PtCl6 (Tianjin Biochemical Reagent Co., China), luteolin (Xian Yuquan Biotechnology Co. Ltd., China) and Duyiwei capsule (Gansu Duyiwei Pharmaceutical Co. Ltd., China) were used as received. The supporting electrolyte was pH 3.0 phosphate buffer solution (PBS). All the chemicals were of analytical reagent grade, and ultrapure water (Milli-Q, IQ-7000, USA) was used throughout the experiment.
2.2 Apparatus
Electrochemical experiments were performed on a CHI 660E electrochemical workstation (Shanghai CH Instruments, China) using a traditional three-electrode system, including Pt–BPC/CILE as the working electrode, Ag/AgCl (sat. KCl) electrode as the reference electrode and a platinum wire electrode as the auxiliary electrode. Cyclic voltammetry (CV) and differential pulse voltammetry (DPV) were performed in pH 3.0 PBS containing a certain amount of luteolin or sample. DPV parameters were as follows: pulse amplitude of 0.05 V, pulse width of 0.02 s, pulse period of 0.2 s, and quiet time of 0.5 s. The surface morphologies, EDX and mapping of the as-prepared materials were characterized using a JSM-7100F scanning electron microscope (SEM, JEOL, Japan). X-ray photoelectron spectra (XPS) were obtained by using an AXIS HIS 165 spectrometer (Kratos Analytical, UK). Raman spectra with 532 nm lasers were obtained on a LabRAM HR system (Horiba, France).
2.3 Preparation of BPC and Pt–BPC
The synthesis of BPC was performed by activation with alkali-treatment and carbonization according to a previous report.17 Briefly, 5.0 g of wheat flour and 5.0 g of KOH were dissolved in 55 mL of distilled water with stirring. After drying at 80 °C for 24 h, the dried sample was pyrolyzed under Ar flow at 700 °C (5 °C min−1) for 2 h in a KMTF-100 tube furnace (Anhui Kemi Instruments, China). Finally, the carbonized sample was washed with water and 3.0 mol L−1 hydrochloric acid, and the products were dried at 80 °C for 12 h to obtain BPC.
The Pt–BPC nanocomposite was prepared by adding 40.0 mg of BPC to 20 mL of 1.0 mg mL−1 K2PtCl6 solution; the mixture was ultrasonicated and stirred for homogeneity and then transferred to a Teflon-lined stainless-steel autoclave (50 mL capacity), heated at 180 °C for 12 h and cooled to room temperature naturally. The product was filtered, washed several times with ultrapure water, and dried at 80 °C for 12 h to obtain the Pt–BPC nanocomposite.
2.4 Construction of the modified electrode
CILE was prepared according to a previous report;10 it was hand-made by mixing HPPF6 and graphite powder, using a glass electrode tube (Φ = 4 mm), and smoothing the mixture on a piece of polishing paper just before use. Then, 8.0 μL of a 1.5 mg mL−1 Pt–BPC suspension was dropped on the top of CILE and dried at room temperature to obtain Pt–BPC/CILE. For comparison, BPC/CILE was constructed with a similar procedure.
3 Results and discussion
3.1 Characterization of BPC and Pt–BPC
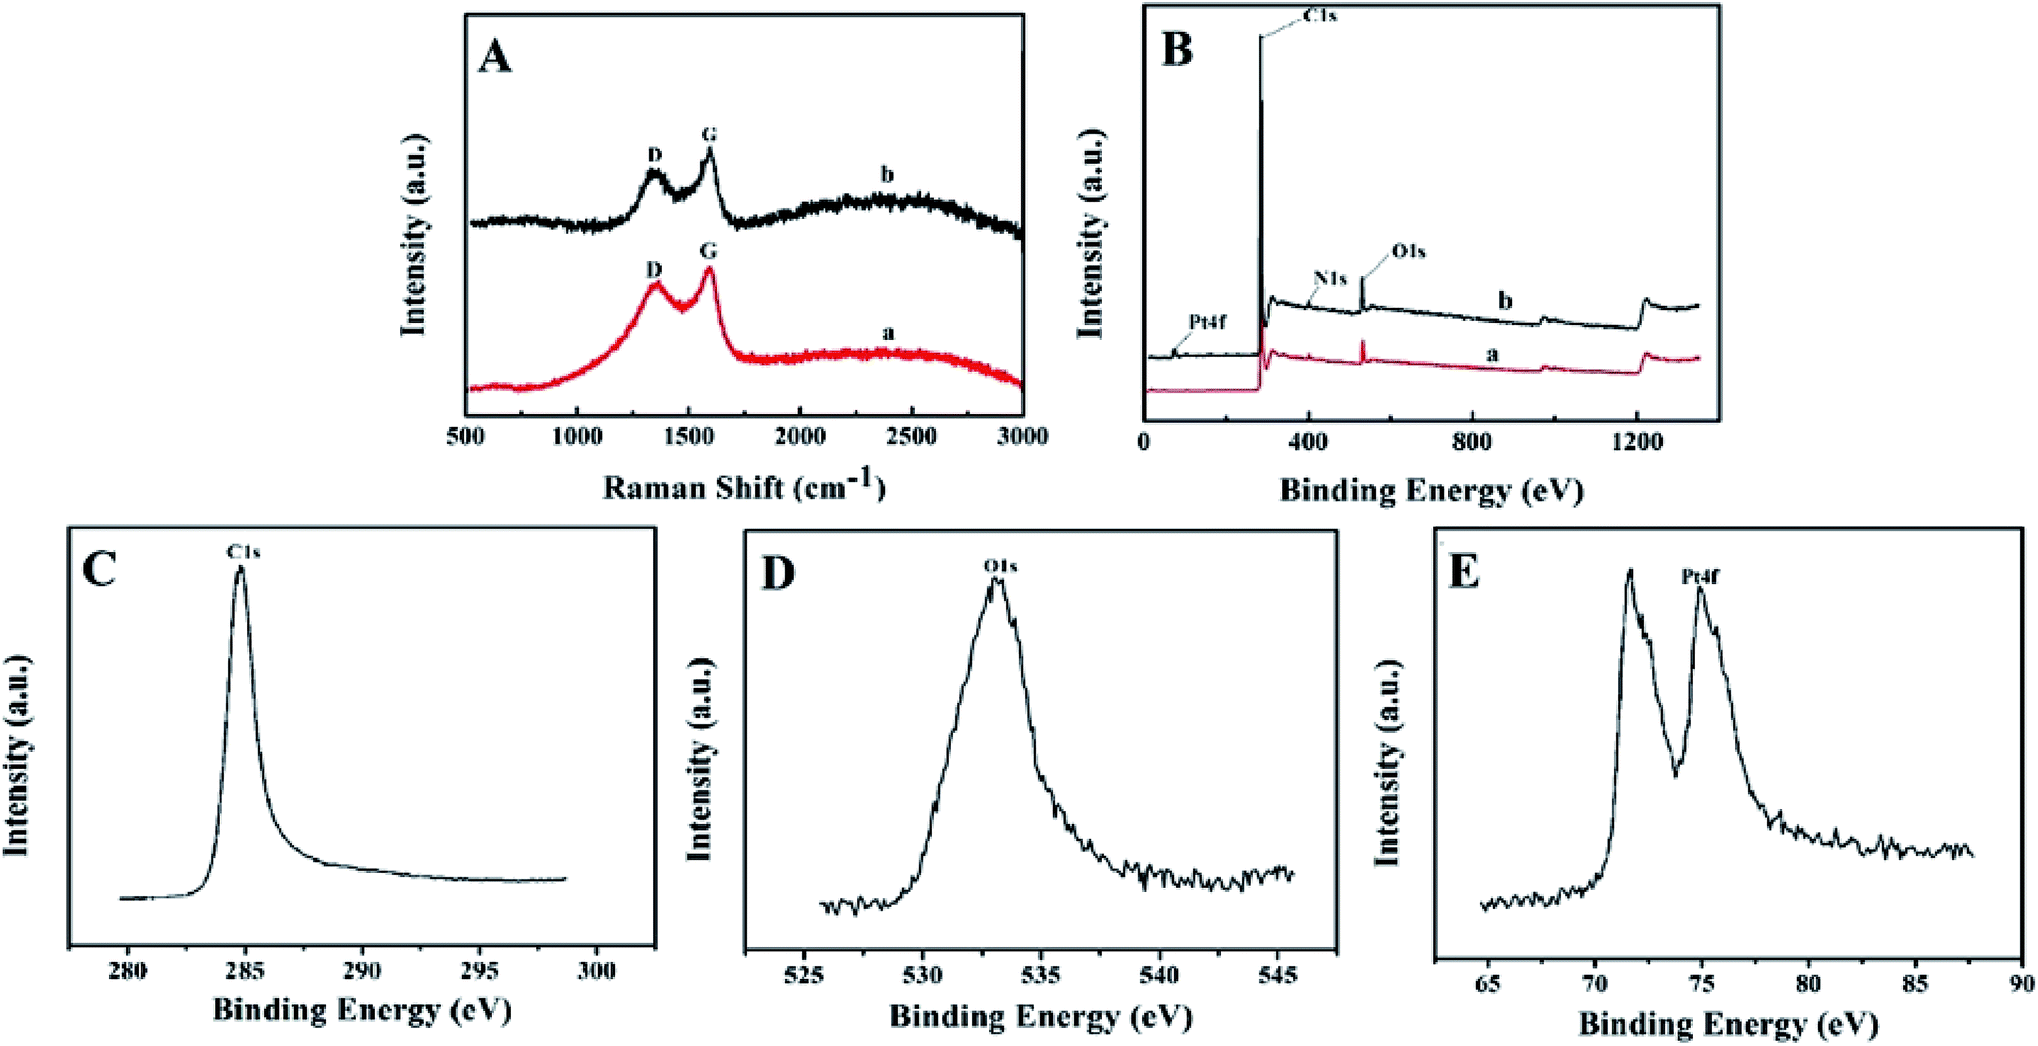
SEM images of BPC and Pt–BPC were recorded and exhibited in Fig. 1. For BPC, a highly interconnected porous structure was observed (Fig. 1A), which was mainly due to the KOH activation and high-temperature pyrolysis of the biomass raw material. As for the Pt–BPC nanocomposite (Fig. 1B and inset), the porous structure remained, with the Pt nanoparticles being uniformly dispersed on the surface of the BPC. The porous structure of the biomass-derived carbon can facilitate the loading of Pt nanoparticles during the hydrothermal synthesis, with the Pt nanoparticles being successfully modified on the surface of BPC. The elements and their relative contents in the Pt–BPC nanocomposite were further determined by EDS, with the results shown in Fig. 1C. As can be seen in Fig. 1D to G, the nanocomposite is mostly composed of carbon (C), oxygen (O), nitrogen (N) and platinum (Pt), which proves the formation of the Pt–BPC nanocomposite.
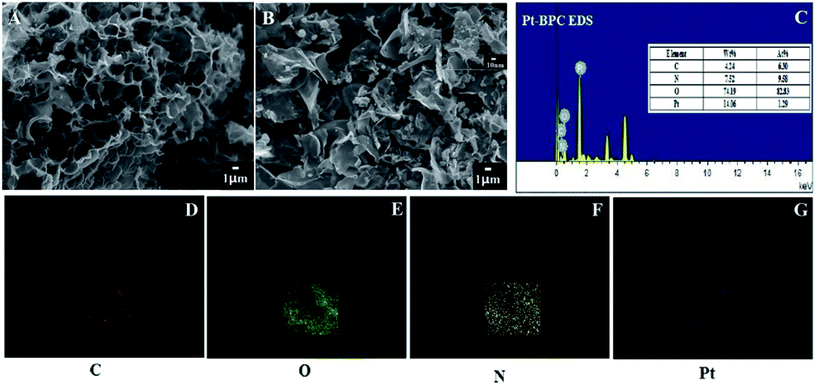 |
| | Fig. 1 SEM images of (A) BPC and (B) Pt–BPC, (C) EDS results for Pt–BPC, (D)–(G) mapping results for Pt–BPC. | |
The Raman spectroscopic results of BPC and Pt–BPC are shown in Fig. 2A with the disordered carbon (D band) and graphitic carbon (G band) bands observed at 1348 cm−1 and 1592 cm−1, respectively. Typically, the relative intensity ratio of ID/IG is used to judge the disorder/defect degree for carbon materials;38 the ID/IG values of BPC and Pt–BPC were 0.89 and 0.75, respectively. Obviously, the ID/IG value decreased with the presence of Pt nanoparticles, indicating a relatively high degree of graphitization.
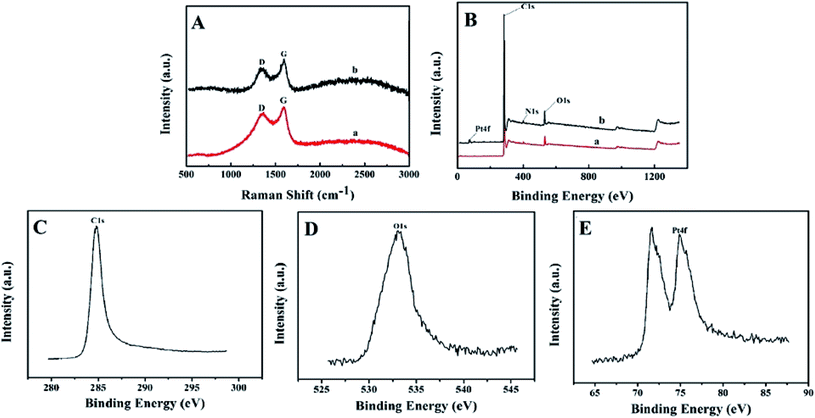 |
| | Fig. 2 (A) Raman spectra of BPC (a) and Pt–BPC (b), (B) XPS survey spectra, (C) C1s XPS spectrum, (D) O1s XPS spectrum, (E) Pt4f XPS spectrum. | |
XPS was performed to study the elemental composition and content of BPC and Pt–BPC. As shown in Fig. 2B, three different peaks appeared at 284.8, 400.65 and 533.05 eV (curve a), which correspond to C1s, N1s and O1s, respectively. The symmetrical XPS peaks of C1s and O1s are shown in Fig. 2C and D. A new peak of Pt4f appeared in curve b, as compared with curve a; the XPS peak of Pt4f, as exhibited in Fig. 2E, indicated that Pt nanoparticles were successfully introduced into BPC, and the atomic ratios of different elements are shown in Table 1.
Table 1 Atomic percentage of different elements in the Pt–BPC nanocomposite
| Matrix |
C1s |
N1s |
O1s |
Pt4f |
| Pt–BPC |
90.87 |
2.02 |
6.86 |
0.24 |
3.2 Electrochemical investigations
By using 1.0 mmol L−1 [Fe(CN)6]3−/4− solution as the electrochemical probe, the cyclic voltammetric responses of different electrodes were recorded and the results are shown in Fig. 3A. A pair of redox peaks appeared on the bare CILE (curve a) with the peak currents of 37.78 μA (Ipc) and 33.38 μA (Ipa), respectively. On BPC/CILE (curve b) the redox peaks increased with the peak currents being 51.25 μA (Ipc) and 45.84 μA (Ipa), respectively. The peak currents were further enhanced to 72.36 μA (Ipc) and 46.29 μA (Ipa) on Pt–BPC/CILE (curve c), which increased by 1.92 times for Ipc and 1.39 times for Ipa as compared with that of CILE. Therefore, the presence of Pt–BPC on the electrode surface can greatly enhance the electrochemical responses. According to the Randles–Sevcik formula: Ipa (A) = (2.69 × 10⁵)n3/2AD1/2C0υ1/2,39 the effective area (A) of Pt–BPC/CILE was 0.434 cm2, which was 2.4 times larger than that of CILE (0.181 cm2), indicating that the presence of the Pt–BPC nanocomposite on the electrode increased the effective surface area and provided more active sites on the electrode surface. Also, the high conductivity of the Pt nanoparticles and BPC on the electrode was beneficial for electron transfer with synergistic effects. Therefore, the electrode performance was greatly improved on Pt–BPC/CILE.
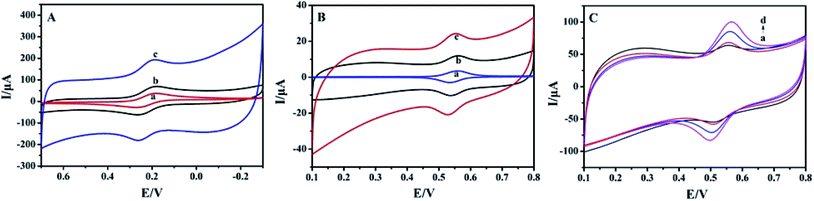 |
| | Fig. 3 (A) Cyclic voltammetric curves of CILE (a), BPC/CILE (b) and Pt–BPC/CILE (c) in 1.0 mmol L−1 [Fe(CN)6]3−/4− and 0.5 mol L−1 KCl solution at the scan rate of 100 mV s−1. (B) Cyclic voltammetric curves of 5.0 × 10⁻⁶ mol L−1 luteolin on CILE (a), BPC/CILE (b) and Pt–BPC/CILE (c) in PBS (pH 3.0) at the scan rate of 100 mV s−1. (C) Cyclic voltammetric curves of different concentrations of luteolin on Pt–BPC/CILE (a to d: 10.0, 20.0, 40.0, 60.0 μmol L−1) at the scan rate of 100 mV s−1. | |
Electrochemical behaviors of 5.0 × 10⁻⁶ mol L−1 luteolin on different electrodes were investigated and shown in Fig. 3B. A pair of redox peaks appeared on different working electrodes, which was the typical electrochemical reaction of luteolin. Luteolin includes the hydroxyl group and easily undergoes an oxidation reaction on the electrode with the oxidation of the hydroxyl group to the quinone group.40 The electrochemical data for luteolin on these electrodes are summarized in Table 2. It can be seen that the redox peak currents gradually increased in the presence of BPC and Pt–BPC as the modifier. The formal peak potentials (E0′) moved in the positive direction, indicating the electrocatalytic effects. The oxidation peak current of Pt–BPC/CILE was increased by 2.81 times as compared with that of CILE. This was due to the presence of the Pt–BPC nanocomposite with the properties including the large surface area of BPC, the high conductivity of BPC and Pt nanoparticles, and the electrocatalytic effects of Pt nanoparticles, which could accelerate the electrochemical reaction of luteolin. Pt–BPC/CILE was used as the working electrode for the following luteolin analysis.
Table 2 Electrochemical data of 5.0 × 10⁻⁶ mol L−1 luteolin on different electrodes
| Electrodes |
Epa (V) |
Epc (V) |
Ipa (μA) |
Ipc (μA) |
ΔE (mV) |
E0′(V) |
| CILE |
0.559 |
0.534 |
3.110 |
2.892 |
25 |
0.550 |
| BPC/CILE |
0.561 |
0.536 |
4.740 |
3.429 |
25 |
0.549 |
| Pt–BPC/CILE |
0.553 |
0.529 |
8.746 |
3.924 |
24 |
0.541 |
Cyclic voltammetric curves of different concentrations of luteolin on Pt–BPC/CILE are shown in Fig. 3C. It can be observed that the redox peak currents of luteolin gradually increased with the decrease in the charging currents along with the increase in luteolin concentration. The electrochemical reaction of luteolin on Pt–BPC/CILE is an adsorption-controlled process, in which electroactive luteolin can be adsorbed on the porous structure of BPC with decreased interfacial capacitance and the corresponding decrease in charging current.
3.3 Effect of pH
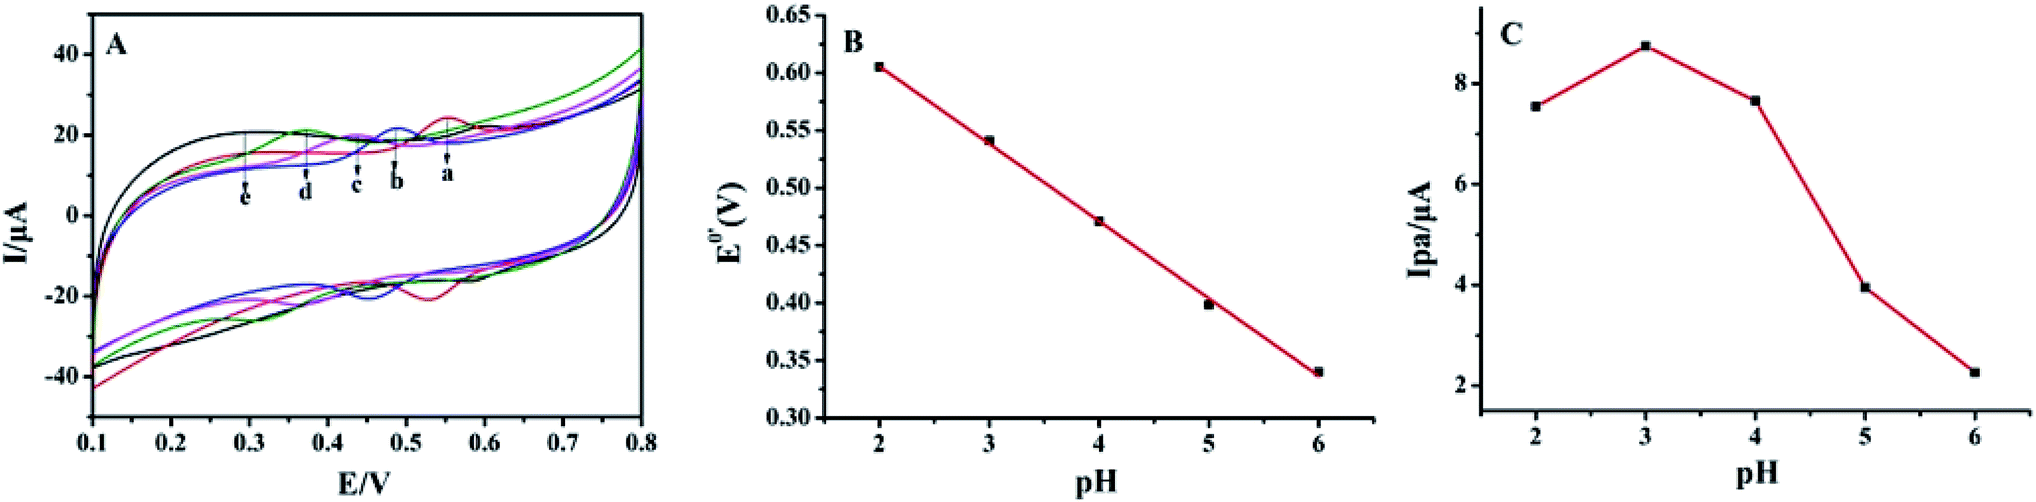
As shown in Fig. 4A, the effect of buffer pH on the electrochemical responses of luteolin at Pt–BPC/CILE was investigated from pH 2.0 to pH 6.0. In Fig. 4B, the formal peak potentials (E0′) shifted towards the negative direction with the pH increase, and a good linear relationship was obtained with the regression equation as E0′ (V) = −(0.067 ± 0.001)pH + (0.740 ± 0.005) (V) (n = 5, γ = 0.998). This indicates that the protons took part in the electrochemical reaction. The slope of −67 mV pH−1 suggested that equal numbers of electrons and protons were involved in the electrode reaction. As shown in Fig. 4C, the maximum value of the oxidation peak current (Ipa) appeared at pH 3.0; therefore, pH 3.0 was chosen as the optimal supporting electrolyte for luteolin determination in this experiment, which could provide enough protons for the electro-oxidation of luteolin.
 |
| | Fig. 4 (A) Cyclic voltammograms of 5.0 × 10⁻⁶ mol L−1 luteolin on Pt–BPC/CILE in PBS with different pH values (a to e: 2.0, 3.0, 4.0, 5.0, 6.0) at the scan rate of 100 mV s−1. (B) The relationship of E0′ with pH; (C) the relationship of Ipa with pH. | |
3.4 Effect of scan rate
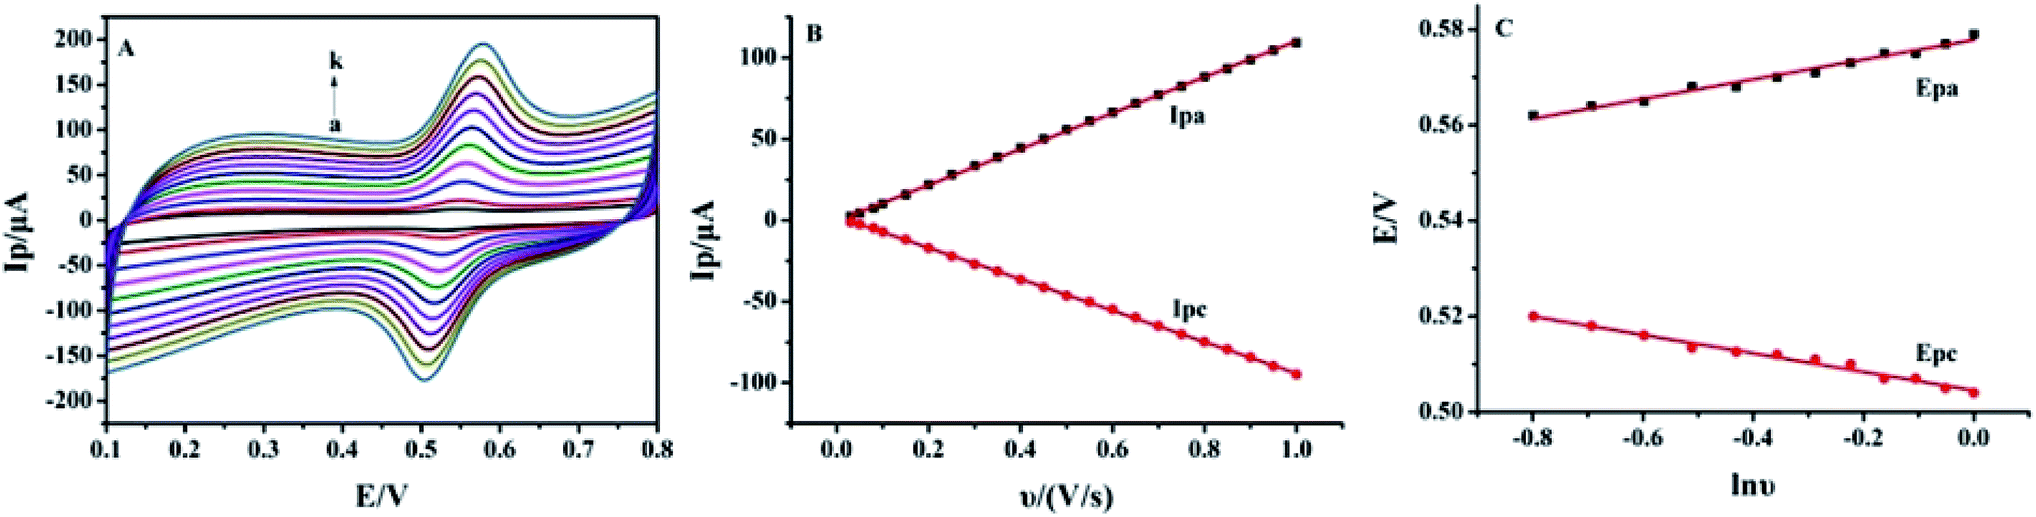
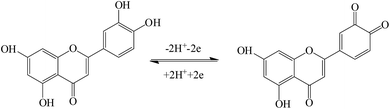
The effect of the scan rate on the redox process of 5.0 × 10⁻⁶ mol L−1 luteolin was recorded from 30 mV s−1 to 800 mV s−1, with the results shown in Fig. 5A. With the increase in the scan rate, the redox peak currents gradually increased with two linear regression equations: Ipa (μA) = (110.63 ± 0.40)υ (V s−1) − (0.42 ± 0.23) (μA) (n = 10, γ = 0.999) and Ipc (μA) = −(96.56 ± 0.30)υ (V s−1) + (2.36 ± 0.17) (μA) (n = 10, γ = 0.999) (Fig. 5B). These indicated that the adsorption-controlled surface kinetics played an important role in the electrode process. After cyclic voltammetric scans in the luteolin solution, Pt–BPC/CILE was taken out, washed and placed in a pH 3.0 buffer solution with a subsequent multi-cyclic voltammetric scan. The redox peaks of luteolin still appeared and remained unchanged in 50 cycles, which could be ascribed to the porous BPC that adsorbed luteolin inside the pore structure. The linear relationship between the redox peak potential and ln![[thin space (1/6-em)]](https://www.rsc.org/images/entities/char_2009.gif) υ was investigated, with the regression equations as follows: Epa (V) = (0.021 ± 0.003)lnυ (V s−1) + (0.578 ± 0.008) (V) (n = 12, γ = 0.991) and Epc (V) = −(0.019 ± 0.008)lnυ (V s−1) + (0.504 ± 0.003) (V) (n = 12, γ = 0.991) (Fig. 5C). According to Laviron's formula,41 the electron transfer coefficient (α), electron transfer number (n) and electron transfer rate constant (ks) were calculated as 0.59, 2.2, and 6.3 s−1, respectively. The value indicated that two electrons and two protons were involved in the redox reaction of luteolin, and the reaction mechanism was proposed as the following Scheme 2, which involved the oxidation of the hydroxyl group to the quinone group with the following reduction reaction.10
υ was investigated, with the regression equations as follows: Epa (V) = (0.021 ± 0.003)lnυ (V s−1) + (0.578 ± 0.008) (V) (n = 12, γ = 0.991) and Epc (V) = −(0.019 ± 0.008)lnυ (V s−1) + (0.504 ± 0.003) (V) (n = 12, γ = 0.991) (Fig. 5C). According to Laviron's formula,41 the electron transfer coefficient (α), electron transfer number (n) and electron transfer rate constant (ks) were calculated as 0.59, 2.2, and 6.3 s−1, respectively. The value indicated that two electrons and two protons were involved in the redox reaction of luteolin, and the reaction mechanism was proposed as the following Scheme 2, which involved the oxidation of the hydroxyl group to the quinone group with the following reduction reaction.10
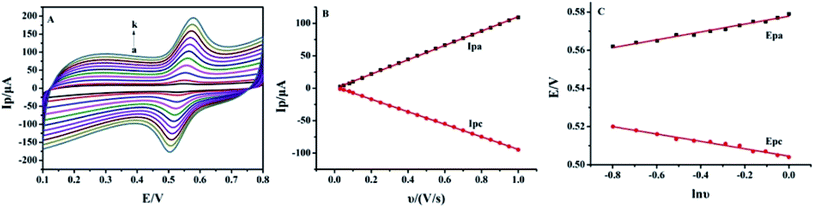 |
| | Fig. 5 (A) Cyclic voltammograms of 5.0 × 10⁻⁶ mol L−1 luteolin on Pt–BPC/CILE in 0.1 mol L−1 PBS (pH 3.0) at different scan rates (from a to k: 30, 50, 80, 100, 200, 300, 400, 500, 600, 700, 800 mV s−1). (B) The linear relationship of Ip with υ. (C) The linear relationship of Ep with lnυ. | |
 |
| | Scheme 2 The electrochemical reaction mechanism of luteolin. | |
3.5 Effects of accumulation conditions
Due to the adsorption-controlled electrode reaction process, the effects of accumulation time and potential on the DPV oxidation peak current of 5.0 × 10⁻⁶ mol L−1 luteolin was investigated. The peak current of luteolin increased with the accumulation time within the range from 0 s to 350 s and remained steady when the accumulation time was more than 350 s. Moreover, the influence of the accumulation potential on the peak current was also studied. The peak current increased when the accumulation potential was varied in the range of −0.1 V to 0.4 V, and then it decreased when the potential further increased to 0.5 V and 0.6 V. Therefore, 350 s and 0.4 V of the accumulation time and potential were selected, which led to the saturated adsorption of luteolin on the electrode surface.
3.6 Calibration curve
As shown in Fig. 6, different concentrations of luteolin were electrochemically detected by DPV in 0.1 mol L−1 PBS (pH 3.0), and the oxidation peak currents were recorded since the oxidation reaction took place first. The luteolin oxidation peak currents (Ipa) increased with concentration in the range of 0.008–0.40 μmol L−1 (Fig. 6A) and 0.40–100.0 μmol L−1 (Fig. 6B). The linear regression equations were as follows: Ipa (μA) = (6.647 ± 0.162)C (μmol L−1) + (3.023 ± 0.031) (μA) (n = 6, γ = 0.997) (Fig. 6C) and Ipa (μA) = (1.167 ± 0.043)C (μmol L−1) + (8.741 ± 1.776) (μA) (n = 11, γ = 0.990) (Fig. 6D). The two different slopes of the calibration curves could be attributed to the difference in the activity of the modified electrode surface at low and high luteolin concentrations. In the low concentration range, a high slope of the first calibration curve was obtained for the relatively high ratio of active sites to the total number of luteolin molecules. In the high concentration range, the active sites decreased in comparison to the total number of luteolin molecules (mainly at the modified electrode surface), resulting in a small slope value for the second calibration curve. The limit of detection (LOD) was calculated as (2.6 ± 0.054) nmol L−1 (3σ/S, where σ is the standard deviation of 6 blank solution measurements, and S is the slope of the calibration curve for the lower concentrations). This was due to the large surface area of Pt–BPC/CILE, the adsorption of luteolin, and the electrocatalytic effect of Pt nanoparticles on the electrode. A comparison of this method with other reported results is given in Table 3, which shows that a lower LOD value and wider linear range for luteolin detection could be obtained by using Pt–BPC/CILE as the working electrode.
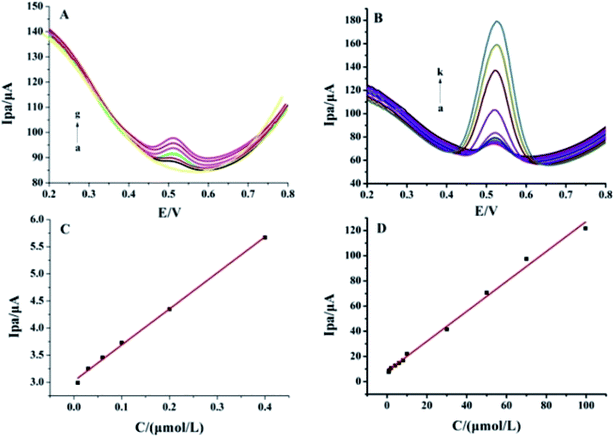 |
| | Fig. 6 Differential pulse voltammetric curves of different concentrations of luteolin on Pt–BPC/CILE. (A) a to g: 0, 0.008, 0.010, 0.016, 0.1, 0.2, 0.4 μmol L−1. (B) a to k: 0.8, 1.0, 2.0, 4.0, 6.0, 8.0, 10.0, 30.0, 50.0, 70.0, 100.0 μmol L−1. (C) and (D) Linear relationships between Ipa and luteolin concentrations in different ranges. | |
Table 3 Comparison of various modified electrodes for luteolin detection
| Electrodes |
Linear range (μmol L−1) |
LOD (nmol L−1) |
Ref. |
| Multi-walled carbon nanotubes. Polyethyleneimine. Graphene nanosheets. Hydroxyapatite. Hydroxyapatite–carbon nanotube. Poly (diallyldimethylammonium chloride)–graphene sheets–multiwalled carbon nanotubes. β-Cyclodextrin. 1-Butyl-3-methylimidazolium hexafluorophosphate. Carbon paste electrode. Poly (crystal violet). |
| GCE |
0.01–1.0 |
5.0 |
42 |
| AuNCs/CILE |
0.001–1.0 |
0.4 |
10 |
| MWCNTsa–PEIb/GCE |
0.0024–1.75 |
0.5 |
11 |
| GNsc/HAd/GCE |
0.2–10.0 |
10.0 |
43 |
| HAP–CNTe/GCE |
0.4–12.0 |
80.0 |
44 |
| PDDA–G–CNTsf/β-CDg/GCE |
0.05–60.0 |
20.0 |
45 |
| Au–BMIPF6h–CPEi |
0.1–5.8 |
28.0 |
46 |
| PCVj/MWCNTs/GCE |
0.2–10.0 |
5.0 |
47 |
| Pt–BPC/CILE |
0.008–100.0 |
2.6 |
This study |
3.7 Analytical application
To verify the practical application of the modified electrode, Pt–BPC/CILE was applied to the determination of luteolin content in a Duyiwei capsule by the calibration curve method and the standard addition method. Five capsules were soaked and ultrasonicated for several hours with 5 mL ethanol. The extract was then diluted to 10 mL with pH 3.0 PBS to obtain the sample solution. As shown in Table 4, the recovery ranged from 98.33% to 103.75%, which indicated that Pt–BPC/CILE was suitable and sensitive for luteolin determination in drug samples.
Table 4 Detection of luteolin content in Duyiwei capsule with Pt–BPC/CILE (n = 3)
| Sample |
Detected (μmol L−1) |
Added (μmol L−1) |
Total (μmol L−1) |
Recovery (%) |
RSD (%) |
| 1601042301 |
11.74 |
2.00 |
13.75 |
100.50 |
6.35 |
| 4.00 |
15.89 |
103.75 |
5.95 |
| 6.00 |
17.64 |
98.33 |
2.96 |
3.8 Interferences, stability and repeatability
The effects of some common coexisting substances such as inorganic metal ions, amino acids and some flavonoid drugs were investigated by the DPV method for the determination of 5.0 × 10⁻⁶ mol L−1 luteolin. As shown in Table 5, the presence of 100-fold concentrations of metal ions and amino acids showed no significant effect on the determination of luteolin with the relative deviation being less than 5.0%. However, the presence of 10-fold concentrations of flavonoid drugs such as quercetin, baicalin and rutin resulted in large relative deviations due to the similar molecular structure and close oxidation peak potential to luteolin. The same or lower concentrations of these drugs led to small interferences, with a relative deviation of about 5.0%. Therefore this method may be used for detection in drug or biological samples that contain small concentrations of other flavonoids.
Table 5 Influence of coexistent substances on 5.0 μmol L−1 luteolin analysis
| Interfering substances |
Concentration (μmol L−1) |
Relative deviation (%) |
| Na+ |
500.0 |
1.36 |
| Cl− |
500.0 |
−1.58 |
| K+ |
500.0 |
3.49 |
| Fe3+ |
500.0 |
2.40 |
| Ca2+ |
500.0 |
2.39 |
| Alanine |
500.0 |
4.09 |
| Glutamine |
500.0 |
1.5 |
| Glucose |
500.0 |
2.5 |
| Quercetin |
50.0 |
12.42 |
| Quercetin |
5.0 |
2.46 |
| Baicalin |
50.0 |
55.1 |
| Baicalin |
5.0 |
3.76 |
| Rutin |
50.0 |
68.6 |
| Rutin |
1.0 |
5.42 |
To estimate the repeatability of Pt–BPC/CILE, the same modified electrode was used to measure 5.0 × 10⁻⁶ mol L−1 luteolin solution five times by using the DPV method, and the obtained relative standard deviation (RSD) of the oxidation peak current was 9.72%. Six different modified electrodes were simultaneously prepared under the same conditions with the RSD value of 3.47%. All results indicated that the prepared sensor had good repeatability. The stability of Pt–BPC/CILE was determined by continuous scanning for 100 cycles, and the peak current remained at 98.2% of the initial value. The long-term stability of Pt–BPC/CILE was checked after being stored at the 4 °C refrigerator for a week, and the current value decreased to less than 10% of its original value for the same luteolin solution. Therefore, the prepared sensor showed good repeatability and stability for the determination of luteolin.
4 Conclusions
In this study, we report an electrochemical sensing electrode (Pt–BPC/CILE) with high sensitivity and selectivity for luteolin detection using a Pt–BPC nanocomposite as the modifier, which has a large surface area and good conductivity. The Pt–BPC composite effectively facilitated the adsorption and the electron transfer of luteolin with the increase in the current response. Under the optimized conditions, the sensor exhibited good performance in terms of sensitivity, detection limit, linear range, stability and repeatability in luteolin determination. Therefore, an electroanalytical method for the detection of luteolin was established based on Pt–BPC/CILE as the working electrode, which was used for detection of luteolin in a Duyiwei capsule with satisfactory results.
Conflicts of interest
There are no conflicts to declare.
Acknowledgements
This work was supported by the financial support of the National Natural Science Foundation of Hainan Province of China (2017CXTD007), the Key Science Technology Program of Haikou City (2017042), and Foundation of Key Laboratory of Optic-electric Sensing and Analytical Chemistry for Life Science of Ministry of Education of Qingdao University of Science and Technology (STAM201808).
References
- J. S. Kim and C. Jobin, The flavonoid luteolin prevents lipopolysaccharide-induced NF-kappaB signalling and gene expression by blocking IkappaB kinase activity in intestinal epithelial cells and bone-marrow derived dendritic cells, Immunology, 2005, 115, 375–387 CrossRef CAS.
- L. Fu, B. T. Xu, X. R. Xu, R. Y. Gan, Y. Zhang, E. Q. Xia and H. B. Li, Antioxidant capacities and total phenolic contents of 62 fruits, Food Chem., 2011, 129, 345–350 CrossRef CAS.
- H. Kikuzaki, M. Hisamoto, K. Hirose, K. Akiyama and H. Taniguchi, Antioxidant properties of ferulic acid and its related compounds, J. Agric. Food Chem., 2002, 50, 2161–2168 CrossRef CAS PubMed.
- C. S. Liu, Y. S. Song, K. J. Zhang, J. C. Ryu, M. Kim and T. H. Zhou, Gas chromatographic/mass spectrometric profiling of luteolin and its metabolites in rat urine and bile, J. Pharm. Biomed. Anal., 1995, 13, 1409–1414 CrossRef CAS.
- L. I. Liping, H. Jiang, W. U. Haohao and S. U. Zeng, Simultaneous determination of luteolin and apigenin in dog plasma by RP-HPLC, J. Pharm. Biomed. Anal., 2005, 37, 615–620 CrossRef.
- S. A. O. Santos, C. S. R. Freire, M. R. M. Domingues, A. J. D. Silvestre and P. N. Carlos, Characterization of phenolic components in polar extracts of eucalyptus globulus Labill. bark by high-performance liquid chromatography-mass spectrometry, J. Agric. Food Chem., 2011, 59, 9386–9393 CrossRef CAS.
- Y. Y. Li, Q. F. Zhang, H. Sun, N. K. Cheung and H. Y. Cheung, Simultaneous determination of flavonoid analogs in Scutellariae barbatae herba by β – cyclodextrin and acetonitrile modified capillary zone electrophoresis, Talanta, 2013, 105, 393–402 CrossRef CAS.
- Y. Peng, J. Ye and J. Kong, Determination of phenolic compounds in Perilla frutescens L. by capillary electrophoresis with electrochemical detection, J. Agric. Food Chem., 2005, 53, 8141–8147 CrossRef CAS.
- I. Baranowska and D. Raróg, Application of derivative spectrophotometry to determination of flavonoid mixtures, Talanta, 2001, 55, 209–212 CrossRef CAS.
- X. B. Li, R. Y. Zou, Y. Y. Niu, W. Sun, T. M. Shao and X. Q. Chen, Gold nanocage-based electrochemical sensing platform for sensitive detection of luteolin, Sensors, 2018, 18, 2309 CrossRef PubMed.
- A. Y. Tesio, A. M. Granero, N. R. Vettorazzi, N. F. Ferreyra, G. A. Rivas, H. Fernández and M. A. Zon, Development of an electrochemical sensor for the determination of the flavonoid luteolin in peanut hull samples, Microchem. J., 2014, 115, 100–105 CrossRef CAS.
- Z. H. Bi, Q. Q. Kong, Y. F. Cao, G. H. Sun, F. Y. Su, X. X. Wei, X. M. Li, A. Ahmad, L. J. Xie and C. M. Chen, Biomass-derived porous carbon materials with different dimensions for supercapacitor electrodes: a review, J. Mater. Chem. A, 2019, 7, 16028–16045 RSC.
- P. Ramnani, N. M. Saucedo and A. Mulchandani, Carbon nanomaterial-based electrochemical biosensors for label-free sensing of environmental pollutants, Chemosphere, 2016, 143, 85–98 CrossRef CAS.
- Z. Hu, M. P. Srinivasan and Y. Ni, Preparation of mesoporous high-surface-area activated carbon, Adv. Mater., 2000, 12, 62–65 CrossRef CAS.
- R. Madhu, K. V. Sankar, S. M. Chen and R. K. Selvan, Eco-friendly synthesis of activated carbon from dead mango leaves for the ultrahigh sensitive detection of toxic heavy metal ions and energy storage applications, RSC Adv., 2013, 4, 1225–1233 RSC.
- R. Madhu, V. Veeramani, S. M. Chen, P. Veerakumar and S. B. Liu, Functional porous carbon/nickel oxide nanocomposites as binder-free electrodes for supercapacitors, Chemistry, 2015, 21, 8200–8206 CrossRef CAS.
- X. Liu, Y. Zhou, W. Zhou, L. Li, S. Huang and S. Chen, Biomass-derived nitrogen self-doped porous carbon as effective metal-free catalysts for oxygen reduction reaction, Nanoscale, 2015, 7, 6136–6142 RSC.
- Y. Wei, X. Zhang, J. Zhao, Q. Li, C. Ao, X. Tian, Z. Wei and C. Lu, Ultra-lightweight and highly porous carbon aerogels from bamboo pulp fibers as an effective sorbent for water treatment, Results Phys., 2017, 7, 2919–2924 CrossRef.
- S. Bai, G. Tan, X. Li, Q. Zhao, Y. Meng, Y. Wang, Y. Zhang and D. Xiao, Pumpkin-derived porous carbon for supercapacitors with high performance, Chem.–Asian J., 2016, 11, 1828–1836 CrossRef CAS.
- Z. Li, L. Wei, Z. Chen, B. Li, F. Kang and Q. H. Yang, A sheet-like porous carbon for high-rate supercapacitors produced by the carbonization of an eggplant, Carbon, 2015, 92, 11–14 CrossRef CAS.
- P. Chao, X. B. Yan, R. T. Wang, J. W. Lang, Y. J. Ou and Q. J. Xue, Promising activated carbons derived from waste tea-leaves and their application in high performance supercapacitors electrodes, Electrochim. Acta, 2013, 87, 401–408 CrossRef.
- V. Veeramani, R. Madhu, S. M. Chen, P. Veerakumar, C. T. Hung and S. B. Liu, Heteroatom-enriched porous carbon/nickel oxide nanocomposites as enzyme-free highly sensitive sensors for detection of glucose, Sens. Actuators, B, 2015, 221, 1384–1390 CrossRef CAS.
- D. Kim, J. M. Kim, Y. Jeon, J. Lee, J. Oh, W. H. Antink, D. Kim and Y. Piao, Novel two-step activation of biomass-derived carbon for highly sensitive electrochemical determination of acetaminophen, Sens. Actuators, B, 2018, 259, 50–58 CrossRef CAS.
- P. Veerakumar, V. Veeramani, S. M. Chen, R. Madhu and S. B. Liu, Palladium nanoparticles incorporated porous activated carbon: electrochemical detection of toxic metal ions, ACS Appl. Mater. Interfaces, 2016, 8, 1319–1326 CrossRef CAS.
- D. Chen, H. Zhou, H. Li, J. Chen, S. Li and F. Zheng, Self-template synthesis of biomass-derived 3D hierarchical N-doped porous carbon for simultaneous determination of dihydroxybenzene isomers, Sci. Rep., 2017, 7, 14985 CrossRef.
- S. Takenaka, D. Mikami and E. Tanabe, Modification of carbon nanotube surfaces with precious metal and transition metal oxide nanoparticles using thin silica layers, Appl. Catal., A, 2015, 492, 60–67 CrossRef CAS.
- C. H. Yen, H. L. Lien and J. S. Chung, Adsorption of precious metals in water by dendrimer modified magnetic nanoparticles, J. Hazard. Mater., 2016, 322, 215–222 CrossRef.
- L. Wang, Z. Zeng and C. Ma, Plating precious metals on nonprecious metal nanoparticles for sustainable electrocatalysts, Nano Lett., 2017, 17, 3391–3395 CrossRef CAS.
- L. Q. Rong, C. Yang, Q. Y. Qian and X. H. Xia, Study of the nonenzymatic glucose sensor based on highly dispersed Pt nanoparticles supported on carbon nanotubes, Talanta, 2007, 72, 819–824 CrossRef CAS.
- H. Xiao, Y. Zhu, X. Yang, J. Zhang and C. Li, Dendrimer-encapsulated Pt nanoparticles on mesoporous silica for glucose detection, J. Solid State Electrochem., 2011, 15, 511–517 CrossRef.
- X. Kang, G. Xu, J. Cui and Y. Wu, Pt nanoparticles modified Au nanowire array for amperometric and potentiometric detection of glucose, J. Solid State Electrochem., 2013, 17, 2381–2389 CrossRef.
- M. Opallo and A. Lesniewski, A review on electrodes modified with ionic liquids, J. Electroanal. Chem., 2011, 656, 2–16 CrossRef CAS.
- W. Sun, R. F. Gao and K. Jiao, Research and application of ionic liquids in analytical chemistry, Chin. J. Anal. Chem., 2007, 35, 1813–1819 CAS.
- X. Y. Li, X. L. Niu, W. S. Zhao, C. Wei, C. X. Yin, Y. L. Men, G. J. Li and W. Sun, Black phosphorene and PEDOT:PSS-modified electrode for electrochemistry of hemoglobin, Electrochem. Commun., 2017, 86, 68–71 CrossRef.
- X. L. Niu, W. Chen, X. L. Wang, Y. L. Men, Q. Wang, W. Sun and G. J. Li, A graphene modified carbon ionic liquid electrode for voltammetric analysis of the sequence of the Staphylococcus aureus nuc gene, Microchim. Acta, 2018, 185, 167 CrossRef.
- X. L. Niu, X. Y. Li, W. Chen, X. B. Li, W. J. Weng, C. X. Yin, R. X. Dong, W. Sun and G. J. Li, Three-dimensional reduced graphene oxide aerogel modified electrode for the sensitive quercetin sensing and its application, Mater. Sci. Eng. C, 2018, 89, 230–236 CrossRef CAS.
- W. Chen, W. J. Weng, X. L. Niu, X. Y. Li, Y. L. Men, W. Sun, G. J. Li and L. F. Dong, Boron-doped grapHene quantum dots modified electrode for electrochemistry and electrocatalysis of hemoglobin, J. Electroanal. Chem., 2018, 823, 137–145 CrossRef CAS.
- H. L. Wang, Z. W. Xu, A. Kohandehghan, Z. Li, K. Cui, X. H. Tan, T. J. Stephenson, C. K. King'Ondu, C. M. B. Holt and B. C. Olsen, Interconnected carbon nanosheets derived from hemp for ultrafast supercapacitors with high energy, ACS Nano, 2013, 7, 5131–5141 CrossRef CAS.
- K. B. Oldham, Analytical expressions for the reversible Randles–Sevcik function, J. Electroanal. Chem., 1979, 105, 373–375 CrossRef CAS.
- Š. Ramešová, R. Sokolová, J. Tarábek and I. Degano, The oxidation of luteolin, the natural flavonoid dye, Electrochim. Acta, 2013, 110, 646–654 CrossRef.
- E. Laviron, General expression of the linear potential sweep voltammogram in the case of diffusionless electrochemical systems, J. Electroanal. Chem., 1979, 101, 19–28 CrossRef CAS.
- A. Liu, S. Zhang, L. Huang, Y. Cao, H. Yao, W. Chen and X. Lin, Electrochemical oxidation of luteolin at a glassy carbon electrode and its application in pharmaceutical analysis, Chem. Pharm. Bull., 2008, 56, 745–748 CrossRef CAS.
- P. Pang, Y. Liu, Y. Zhang, Y. Gao and Q. Hu, Electrochemical determination of luteolin in peanut hulls using graphene and hydroxyapatite nanocomposite modified electrode, Sens. Actuators, B, 2014, 194, 397–403 CrossRef CAS.
- G. Feng, X. Chen, H. Tanaka, A. Nishitani and Q. Wang, Alkaline phosphatase mediated synthesis of carbon nanotube hydroxyapatite nanocomposite and its application for electrochemical determination of luteolin, Adv. Powder Technol., 2016, 27, 921–928 CrossRef.
- D. Lu, S. Lin, L. Wang, L. Tong, C. Wang and Z. Yan, Sensitive detection of luteolin based on poly(diallyldimethylammonium chloride)-functionalized graphene-carbon nanotubes hybrid/β-cyclodextrin composite film, J. Solid State Electrochem., 2014, 18, 269–278 CrossRef CAS.
- A. C. Franzoi, I. C. Vieira, J. Dupont, C. W. Scheeren and L. F. de Oliveira, Biosensor for luteolin based on silver or gold nanoparticles in ionic liquid and laccase immobilized in chitosan modified with cyanuric chloride, Analyst, 2009, 134, 2320–2328 RSC.
- T. Jing and B. Jin, Poly (crystal violet) – Multi-walled carbon nanotubes modified electrode for electroanalytical determination of luteolin, J. Electroanal. Chem., 2016, 780, 46–52 CrossRef.
|
| This journal is © The Royal Society of Chemistry 2019 |
Click here to see how this site uses Cookies. View our privacy policy here. 
 Open Access Article
 This Open Access Article is licensed under a Creative Commons Attribution-Non Commercial 3.0 Unported Licence
 a,
Hui Chenga,
Hui Xieb,
Guiling Luob,
Yanyan Niub,
Shuyao Zhangb,
Guangjiu Li*a and
Wei Sun
a,
Hui Chenga,
Hui Xieb,
Guiling Luob,
Yanyan Niub,
Shuyao Zhangb,
Guangjiu Li*a and
Wei Sun