 Open Access Article
A simple sensor based on 1,8-naphthalimide with large Stokes shift for detection of hypochlorous acid in living cells†
Chunpeng
Jiao
abcd,
Yuanyuan
Liu
abcd,
Wenjuan
Lu
abcd,
Pingping
Zhang
 abcd,
Xia
Ma
ae and
Yanfeng
Wang
 *abcd
*abcd
aSchool of Medicine and Life Sciences, University of Jinan-Shandong Academy of Medical Sciences, Jinan 250200, Shandong, China. E-mail: wyfshiwoya@126.com
bInstitute of MateriaMedica, Shandong Academy of Medical Sciences, Jinan 250062, Shandong, China
cKey Laboratory for Biotech-Drugs Ministry of Health, Jinan 250062, Shandong, China
dKey Laboratory for Rare & Uncommon Diseases of Shandong Province, Jinan 250062, Shandong, China
eShandong Institute of Medicine and Health Information, Shandong First Medical University, Shandong Academy of Medical Sciences, Jinan 250062, Shandong, China
First published on 1st October 2019
Abstract
Hypochlorous acid (HOCl), one of the most reactive and deleterious reactive oxygen species (ROS), plays a vital role in many pathological and physiological processes. However, as a result of the highly reactive and diffusible nature of HOCl, its uncontrolled production may lead to an adverse effect on host physiology. Because of its biological importance, many efforts have been focused on developing selective fluorescent probes to image HOCl. However, it is still challenging to design a fluorescent probe with exclusive selectivity towards HOCl. In this study, a novel fluorescent probe for HOCl, Probe 1 was rationally designed based on 1,8-naphthalimide. As the concentration of HOCl increased, the fluorescence intensity of the probe gradually decreased, and the solution color changed from yellow-green to colorless, indicating this is a “naked-eye sensor”. Probe 1 has a large Stokes shift (120 nm), which can effectively avoid fluorescence self-absorption. In addition, Probe 1 shows excellent selectivity to HOCl among different ions including common ROS, high sensitivity, fast response (<2 min), high fluorescence quantum yield (Φ = 0.93) and low detection limit (0.237 μM). Finally, the imaging results in HeLa cells showed that the probe could be used for the detection of exogenous and endogenous HOCl, and proved the potential of the probe as a biosensor for the detection of HOCl.
Introduction
Reactive oxygen species (ROS), such as hypochlorous acid (HOCl), superoxide (O2−), hydroxyl radical (˙OH), hydrogen peroxide (H2O2) and peroxynitrite (ONOO−), are the natural byproducts of normal metabolism and play vital roles in various physiological processes.1–5 Among them, hypochlorous acid can partially ionize hypochlorite at slightly acidic and physiological pH. Endogenous hypochlorite is mainly produced by the reaction of H2O2 and Cl− under the catalysis of myeloperoxidase (MPO), which is a major antimicrobial and oxidant agent for the immune system.6–8 However, abnormal levels of HOCl may cause tissue damage and a variety of human diseases such as cardiovascular diseases, cystic fibrosis cancers, atherosclerosis, arthritis and neuron degeneration.9–14 Accordingly, it is urgent to develop new analytical methods for the sensitive and accurate detection and monitoring of HOCl.Recently, in order to carry out this research, many sensitive and selective analytical methods have been developed such as colorimetric, luminescent, radiolysis, electrochemical and optical imaging methods.15–20 Notably, fluorescent methods have advantages of high sensitivity, good selectivity, strong specificity and fast response time, which is widely used in biological imaging.21–25 In addition, in order to avoid serious self-absorption of fluorescence, probe molecules will be designed with large stokes shift, and when excited at the maximum absorption peak, the interference of excited light on fluorescence signal will be greatly reduced.
A variety of mechanisms for detecting hypochlorous acid have been discovered so far, such as Photoinduced Electron Transfer (PET),26,27 Intramolecular Charge Transfer (ICT),28 fluorescence resonance energy transfer (FRET).29 The selection of probe molecules for fluorophore is also diverse, such as rhodamine dye,30–32 boron-dipyrromethene (BODIPY),33–35 1,8-naphthalimide-derived,36 coumarin,37 anthocyanins38,39 and so on.
In this work, we designed and synthesized a small-molecule fluorescent probe (Probe 1), which connected the electron donor group benzothizole to the naphthalimide backbone through covalent bond. The electron donor capacity of benzothizole increased the fluorescence quantum yield of the probe molecule.40 Upon reaction to HOCl, the fluorescence intensity of Probe 1 decreased and significant change with the solution colour (yellow-green to colourless), which could be used as a fluorometric or colorimetric indicator for HOCl. This molecular probe features a thioether group (MeS) fluorescent modulator that is integrated into naphthalimide. The probe is found to be selective for the reversible monitoring of HOCl and glutathione (GSH) redox cycles. The fluorescent intensity of Probe 1 showed a good linear relationship with the concentration of HOCl at 0–15 eq., a low limit of detection (0.237 μM), and could be applied to monitor fluctuations in basal HOCl levels and endogenous/exogenous HOCl levels in HeLa cells.
Experimental
Material and instruments
All solvents and chemicals were purchased from commercial suppliers and were used without further purification unless otherwise stated. Column chromatography was conducted on silica gel (200–300 mesh) and thin layer chromatography (TCL) was performed using silica gel 60 F254 (Qingdao Ocean Chemicals, Qingdao, China). 1H NMR and 13C NMR spectra were recorded on a Bruker Avance 300 MHz spectrometer. High resolution mass spectra (HRMS) were recorded on an Agilent 1290LC-6540 Accurate Mass Q-TOF by using electrospray ionization (ESI). Fluorescent spectra were measured by using TU-1901 (Beijing Purkinje General Instrument Co., Ltd.) and F-280 (Tianjin Gangdong Technology Co., Ltd.). The cytotoxicity assay measures the absorption wavelength at 490 nm by means of an enzyme labeling device (Synergy HT). Fluorescence imaging of HOCl in live HeLa cells was measured under an Olympus FV1000 confocal fluorescence microscope.Preparation of ROS and RNS
Various ROS and RNS, including NO2−, NO3−, HOCl, H2O2, NO, ˙OH, ONOO−, O2 and t-BuOOH, were prepared according to the following methods. The source of NO2− and NO3− was NaNO2 and NaNO3, respectively. The concentration of hypochlorite was determined at the absorption wavelength of 292 nm (ε = 350 M−1 cm−1) with commercial NaClO solution as the source of HOCl. The concentration of H2O2 was determined from the absorption at 240 nm (ε = 43.6 M−1 cm−1). NO is made from sodium nitroprusside. Hydroxyl radicals were generated by Fenton reaction, and hydrogen peroxide (H2O2, 10 eq.) was added to FeSO4 in deionized water. ONOO−, O2 and t-BuOOH were prepared according to the reported method.41Synthesis
![[thin space (1/6-em)]](https://www.rsc.org/images/entities/char_2009.gif) :
:![[thin space (1/6-em)]](https://www.rsc.org/images/entities/char_2009.gif) 1 v/v) as eluent to afford the compound (2) as pale yellow solid (0.36 g, yield 74%). 1H NMR (300 MHz, CDCl3) δ = 8.58 (dd, J = 7.3, 1.0, 1H), 8.53 (dd, J = 8.5, 1.0, 1H), 8.44 (d, J = 8.0, 1H), 7.74 (dd, J = 8.5, 7.4, 1H), 7.43 (d, J = 8.0, 1H), 2.66 (s, 3H). 13C NMR (75 MHz, CDCl3) δ = 160.5, 148.8, 133.6, 132.9, 131.0, 130.2, 129.1, 126.9, 121.2, 119.4, 114.4, 14.8. HRMS: [M + H]+ calcd for C13H8O3S: 245.0272; found 245.0259.
1 v/v) as eluent to afford the compound (2) as pale yellow solid (0.36 g, yield 74%). 1H NMR (300 MHz, CDCl3) δ = 8.58 (dd, J = 7.3, 1.0, 1H), 8.53 (dd, J = 8.5, 1.0, 1H), 8.44 (d, J = 8.0, 1H), 7.74 (dd, J = 8.5, 7.4, 1H), 7.43 (d, J = 8.0, 1H), 2.66 (s, 3H). 13C NMR (75 MHz, CDCl3) δ = 160.5, 148.8, 133.6, 132.9, 131.0, 130.2, 129.1, 126.9, 121.2, 119.4, 114.4, 14.8. HRMS: [M + H]+ calcd for C13H8O3S: 245.0272; found 245.0259.
![[thin space (1/6-em)]](https://www.rsc.org/images/entities/char_2009.gif) :
:![[thin space (1/6-em)]](https://www.rsc.org/images/entities/char_2009.gif) 1) to afford the compound (1) as pale green solid (0.522 g, yield 69%).
1) to afford the compound (1) as pale green solid (0.522 g, yield 69%).
1H NMR (300 MHz, CDCl3 + CF3COOD) δ = 8.92 (d, J = 6.8, 1H), 8.82 (d, J = 8.4, 1H), 8.76 (d, J = 8.2, 1H), 8.25 (d, J = 8.2, 1H), 8.14 (d, J = 7.9, 1H), 8.01–7.93 (m, 1H), 7.88 (dd, J = 11.5, 4.2, 1H), 7.82 (dd, J = 11.3, 4.1, 1H), 7.66 (d, J = 8.2, 1H), 2.80 (s, 3H). 13C NMR (75 MHz, CDCl3 + CF3COOD) δ = 163.3, 163.2, 160.5, 153.9, 135.2, 134.7, 134.6, 133.4, 130.5, 129.0, 128.7, 127.7, 127.5, 122.1, 121.6, 119.1, 117.7, 113.8, 14.6. HRMS: [M + H]+ calcd for C20H12N2O2S2: 377.0418; found 377.0400.
Determination of the detection limit
The limit of detection (LOD) for HOCl was calculated by fluorescence spectrometry. The LOD was obtained by the following equation: LOD = 3σ/k (σ is the standard deviation of the blank measurement, and k was the slope of the fluorescence intensity graph with sample concentration). In order to reduce the error, the fluorescence of the Probe 1 was calculated 20 times to obtain an S/N ratio, and the standard deviation of the blank measurement was obtained.Cytotoxicity assay
The methyl thiazolyl tetrazolium (MTT) assay was used to measure the cytotoxicity of Probe 1. HeLa cells were seeded into a 96-well cell-culture plate. Various concentrations (5, 10, 20, 30 μM) of Probe 1 were added to the wells. HeLa cells were incubated in culture media (DMEM) in an atmosphere of 5% CO2 and 95% air at 37 °C. After that, 10 mL MTT (5 mg mL−1) was added to each well and incubated at 37 °C under 5% CO2 for 4 h. The supernatant from the orifice plate was removed, 150 microliters of DMSO were added, and shaken with a shaker. The absorption wavelength was measured by an enzyme labelling apparatus (Synergy HT) at 490 nm.| Cell viability (%) = (mean of absorbance value of treatment group)/(mean of absorbance value of control group). |
Cell culture and fluorescent imaging
HeLa cells were cultured in an atmosphere of 5% CO2 and 95% air in Dulbecco's modified Eagle's medium (DMEM) at 37 °C for 24 h, and then some of the cells were incubated with LPS (lipopolysaccharide, 1 μg mL−1) for 6 h, and further incubated with PMA (phorbol 12-myristate 13-acetate, 1 μg mL−1) for 30 min, and then with Probe 1 (10−5 M) for another 30 min. Cells were imaged using confocal fluorescence microscope (Olympus FLUOVIEW FV1000).Results and discussion
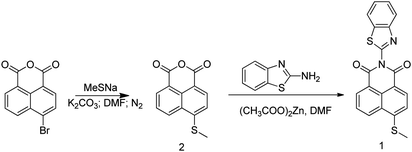
Probe 1 was synthesized by reflux reaction of 6-(methylthio)benzo[de]-isochromene-1,3-dione and benzo[d]oxazol-2-aminein in DMF under nitrogen protection and catalyzed by (CH3COO)2Zn with a yield of 69% (Scheme 1). The product and intermediate were characterized by 1H NMR, 13C NMR and HRMS (Fig. S1–S5†).Absorption and fluorescence spectra of Probe 1 titrated with HOCl
To explore the spectral properties of Probe 1, the UV-vis absorption spectra and fluorescence emission spectra of Probe 1 (10−5 M) were investigated in DMSO–PBS (1![[thin space (1/6-em)]](https://www.rsc.org/images/entities/char_2009.gif) :
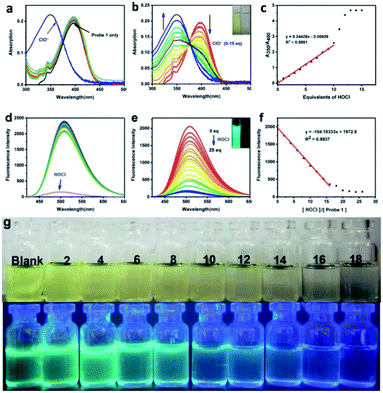
:![[thin space (1/6-em)]](https://www.rsc.org/images/entities/char_2009.gif) 9, v/v; pH = 7.2) solution. First, we performed a selective test on the probe between HOCl and other influencing factors (all 10 eq.; F−, Cl−, Br−, NO3−, NO2−, N3−, SO42−, SO32−, HCO3−, CO32−, PO43−, H2PO4−, HPO42−, CH3COO−, Ag+, Al3+, Ca2+, Cr3+, Co2+, Fe2+, Fe3+, Mn2+, Ni2+, Pb2+, Zn2+, Cu2+, Hg2+, Cd2+, H2O2, NO, ONOO−, O2, ˙OH, T-Buoo−). As shown in Fig. 1a, other ions or molecules such as showed no obvious affect on the UV absorption spectrum of the Probe 1 except for HOCl. These results suggested that Probe 1 exhibits good selectivity toward HOCl in physiological conditions. After reaction with HOCl of Probe 1, a new absorption peak appeared at 350 nm, which gradually enhanced with the increase of HOCl concentration accompanied by decreasing of original absorption peak at 400 nm until disappear, and formed an isosbestic point at 375 nm (Fig. 1b). The absorption ratio of Probe 1 at 350 nm and 400 nm (A350/A400) has a good linear relationship with HOCl concentration (0–10 eq.) (Fig. 1c). The absorption spectrum has undergone a significant blue shift compared to the original state. That is because the electron donating ability of the S element is inhibited after the thioether oxidized to the sulfoxide by HOCl, and the effect of intramolecular charge transfer (ICT) is prevented. The colour of Probe 1 solution changed from yellow-green to colourless after adding HOCl (Fig. 1g), which could be used as a “naked-eye sensor” and a highly accurate ratio determination.
9, v/v; pH = 7.2) solution. First, we performed a selective test on the probe between HOCl and other influencing factors (all 10 eq.; F−, Cl−, Br−, NO3−, NO2−, N3−, SO42−, SO32−, HCO3−, CO32−, PO43−, H2PO4−, HPO42−, CH3COO−, Ag+, Al3+, Ca2+, Cr3+, Co2+, Fe2+, Fe3+, Mn2+, Ni2+, Pb2+, Zn2+, Cu2+, Hg2+, Cd2+, H2O2, NO, ONOO−, O2, ˙OH, T-Buoo−). As shown in Fig. 1a, other ions or molecules such as showed no obvious affect on the UV absorption spectrum of the Probe 1 except for HOCl. These results suggested that Probe 1 exhibits good selectivity toward HOCl in physiological conditions. After reaction with HOCl of Probe 1, a new absorption peak appeared at 350 nm, which gradually enhanced with the increase of HOCl concentration accompanied by decreasing of original absorption peak at 400 nm until disappear, and formed an isosbestic point at 375 nm (Fig. 1b). The absorption ratio of Probe 1 at 350 nm and 400 nm (A350/A400) has a good linear relationship with HOCl concentration (0–10 eq.) (Fig. 1c). The absorption spectrum has undergone a significant blue shift compared to the original state. That is because the electron donating ability of the S element is inhibited after the thioether oxidized to the sulfoxide by HOCl, and the effect of intramolecular charge transfer (ICT) is prevented. The colour of Probe 1 solution changed from yellow-green to colourless after adding HOCl (Fig. 1g), which could be used as a “naked-eye sensor” and a highly accurate ratio determination.
After studying the UV absorption spectrum, we examined the specificity of the Probe 1 for the fluorescence response of HOCl. All fluorescence instrument parameter settings are as follows: excitation wavelength 400 nm, slit 5/5. In the DMSO![[thin space (1/6-em)]](https://www.rsc.org/images/entities/char_2009.gif) :
:![[thin space (1/6-em)]](https://www.rsc.org/images/entities/char_2009.gif) PBS buffer (1
PBS buffer (1![[thin space (1/6-em)]](https://www.rsc.org/images/entities/char_2009.gif) :
:![[thin space (1/6-em)]](https://www.rsc.org/images/entities/char_2009.gif) 9, v: v) containing the Probe 1 (10−5 M), various ions and molecular including H2O2, NO, ONOO−, O2, ˙OH and T-Buoo− was added separately, only HOCl led to a strong decrease of the fluorescent intensity at 520 nm. No obvious changes were observed in the case of other ions and molecular (Fig. 1d). The fluorescence quantum yield (Φ = 0.93) of Probe 1 solution without HOCl was calculated with 9,10-diphenylanthracene (ΦF = 0.95 in ethanol)42 as the reference fluorescence standard substance. This can be attributed to the strong electron-donating ability of S atoms in methyl sulfide, which is transferred to the naphthalene imide through ICT process, thus making the fluorescence quantum yield of Probe 1 extremely high. With the increase of HOCl concentration (0–25 eq.), the fluorescence intensity at the 520 nm gradually decreased and eventually almost completely quenched (Φ = 0.04) (Fig. 1e). The fluorescence intensity of Probe 1 had a good linear relationship with the concentration of HOCl between 0 equivalent to 15 equivalents (R2 = 0.9937) (Fig. 1f). The LOD of Probe 1 for HOCl were found to be 0.237 μM. Under the UV light, only HOCl lead to the obvious colour changed of Probe 1 significantly (blue-green to colourless). The results illustrate that Probe 1 has good selectivity and sensitivity to HOCl (Fig. 1d and S6†).
9, v: v) containing the Probe 1 (10−5 M), various ions and molecular including H2O2, NO, ONOO−, O2, ˙OH and T-Buoo− was added separately, only HOCl led to a strong decrease of the fluorescent intensity at 520 nm. No obvious changes were observed in the case of other ions and molecular (Fig. 1d). The fluorescence quantum yield (Φ = 0.93) of Probe 1 solution without HOCl was calculated with 9,10-diphenylanthracene (ΦF = 0.95 in ethanol)42 as the reference fluorescence standard substance. This can be attributed to the strong electron-donating ability of S atoms in methyl sulfide, which is transferred to the naphthalene imide through ICT process, thus making the fluorescence quantum yield of Probe 1 extremely high. With the increase of HOCl concentration (0–25 eq.), the fluorescence intensity at the 520 nm gradually decreased and eventually almost completely quenched (Φ = 0.04) (Fig. 1e). The fluorescence intensity of Probe 1 had a good linear relationship with the concentration of HOCl between 0 equivalent to 15 equivalents (R2 = 0.9937) (Fig. 1f). The LOD of Probe 1 for HOCl were found to be 0.237 μM. Under the UV light, only HOCl lead to the obvious colour changed of Probe 1 significantly (blue-green to colourless). The results illustrate that Probe 1 has good selectivity and sensitivity to HOCl (Fig. 1d and S6†).
Time response and pH stability of Probe 1 to HOCl
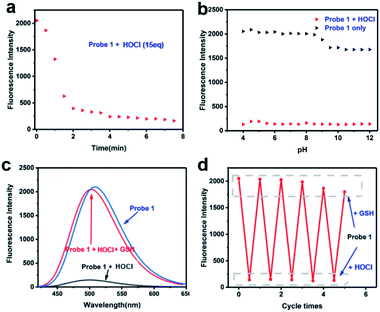
The reaction of Probe 1 with HOCl was very quick, addition of HOCl (aq) (15 eq.) to the solution of Probe 1 caused a significant change in fluorescence intensity within 2 min (Fig. 2a). The time response has shown good results, then we evaluated the pH effect on the fluorescence of Probe 1 toward HOCl. It can be seen from Fig. 2b that Probe 1 was very stable at pH value of 4.00–7.50 in the absence of HOCl, when pH value was higher than 7.50, the fluorescence of it decreased slightly, but still maintained a relatively high. After the addition of HOCl, the fluorescence of Probe 1 was almost completely quenched at any location with a pH value of 4.00–12.00. The results indicated that Probe 1 has good stability in the range of pH 4.00–7.50, and can be used for in vivo cell HOCl imaging studies under physiological pH conditions. The above results indicate that Probe 1 has certain advantages for HOCl detection compared to the reported fluorescent probe (Table S1†).Cyclic response of Probe 1 to HOCl and GSH
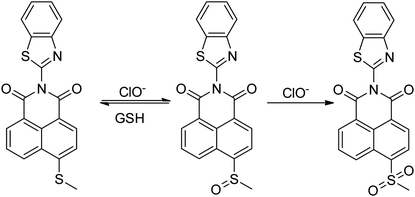
The S atoms of methyl sulfide in the probe can be oxidized by HOCl, in order to investigate the stability of oxidation products, after added HOCl (15 eq.) into the probe solution for 2 min, and then added different antioxidants (20 eq.) to determine which antioxidant could trigger the fluorescent switch on efficaciously (Fig. S7†). The results showed that GSH could restore fluorescence in the probe solution oxidized by HOCl (Fig. 2c), and the fluorescence recovery rate could be up to 95% within 1 min. Other antioxidant including cysteine, Fe2+, vitamin C, vitamin E, histamine and so on could not restored the fluorescence of the reaction solution during 10 min. Experiments with round-trip addition of HOCl and GSH show that the reversible oxidation–reduction cycle could be repeated at least 3 times with a modest fluorescence decrement (Fig. 2d), because part of the thioether was oxidized to sulfone (Scheme 2 and Fig. S8†), which could not be reduced by GSH.Proposed reaction mechanism and NMR analysis
As has been well shown in previous studies,43–45 the electron rich sulfide was easily oxidized to sulfoxide by HOCl. To elucidate the detailed signal mechanism, the “turn-off” fluorescence sensing mechanism for Probe 1 toward HOCl was proposed in Scheme 2. The oxidation of Probe 1 by HOCl was demonstrated by HRMS, FT-IR and 1H NMR. By HRMS analysis of the product of the reaction of Probe 1 with HOCl (20 eq.), We could get a new compound (m/z: 393.0362, [M + H]+ calcd for C20H12N2O3S2: 377.0418), which was the sulfoxide of Probe 1 oxidized by HOCl, then after adding the excess HOCl again, another new compound was found (m/z: 409.0311, [M + H]+ calcd for C20H12N2O4S2: 409.0317), which was the oxidized sulfone of Probe 1 (Fig. S8†). Meanwhile, the characteristic peaks of sulfoxide and sulfone were also obtained by FT-IR spectrum (Fig. S9†). The S![[double bond, length as m-dash]](https://www.rsc.org/images/entities/char_e001.gif) O in the sulfoxide has a strong absorption peak in the range of 1070–1030 cm−1, and it is observed that a new absorption peak appears at 1059.38 cm−1 (Fig. S9b†). The spectrum of sulfone is strongly absorbed in the range of 1350–1300 cm−1 and 1160–1120 cm−1, and these bands are generated by the stretching vibration of symmetric and asymmetric O
O in the sulfoxide has a strong absorption peak in the range of 1070–1030 cm−1, and it is observed that a new absorption peak appears at 1059.38 cm−1 (Fig. S9b†). The spectrum of sulfone is strongly absorbed in the range of 1350–1300 cm−1 and 1160–1120 cm−1, and these bands are generated by the stretching vibration of symmetric and asymmetric O![[double bond, length as m-dash]](https://www.rsc.org/images/entities/char_e001.gif) S
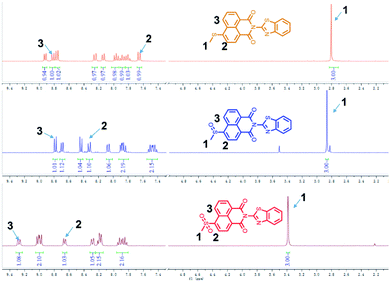
S![[double bond, length as m-dash]](https://www.rsc.org/images/entities/char_e001.gif) O, respectively. Two strong absorption peaks 1307.08 cm−1 and 1127.01 cm−1 can be found very well in Fig. S9c.† As the probe was gradually oxidized by HOCl, the peak position of S–C bond changed from 774.32 cm−1 to 760.71 cm−1 to 758.41 cm−1. Because the electron cloud density decreases after the sulfide is oxidized, the shielding effect is weakened, and the chemical potential of hydrogen on the methyl group moves to a lower field. We can clearly see the change in the degree of 1H NMR on the methyl group after the reaction with HOCl (H1 = 2.80; 2.87; 3.39). At the same time the chemical displacement of the hydrogen at positions H2 and H3 is also affected by the shift to the lower field (Fig. 3).
O, respectively. Two strong absorption peaks 1307.08 cm−1 and 1127.01 cm−1 can be found very well in Fig. S9c.† As the probe was gradually oxidized by HOCl, the peak position of S–C bond changed from 774.32 cm−1 to 760.71 cm−1 to 758.41 cm−1. Because the electron cloud density decreases after the sulfide is oxidized, the shielding effect is weakened, and the chemical potential of hydrogen on the methyl group moves to a lower field. We can clearly see the change in the degree of 1H NMR on the methyl group after the reaction with HOCl (H1 = 2.80; 2.87; 3.39). At the same time the chemical displacement of the hydrogen at positions H2 and H3 is also affected by the shift to the lower field (Fig. 3).
Cell imaging
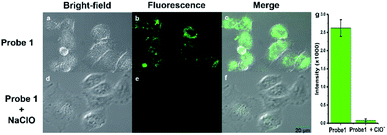
In order to explore the potential application in the biological field, MTT assay and cell imaging assay were performed on the probe. The stained HeLa cells cell were still survival viability than 80% after incubated for 24 h when used at higher probe concentrations (40 μM), indicating Probe 1 has low toxicity and good biocompatibility for living cells (Fig. S10†). These results suggested that Probe 1 is a good fluorescence probe for cell imaging. Images were obtained using confocal fluorescence microscopy of cells, when HeLa cells were incubated with Probe 1 (10−5 M), the cells can observe a distinct bright green fluorescence (Fig. 4a). After the treatment with exogenous NaClO (15 eq.),46 the fluorescence in HeLa cells was obviously quenched (Fig. 4b). The superposition of fluorescence and bright field images showed that the fluorescence signal located in the intracellular region, indicating the subcellular distribution of NaClO and good cell-membrane permeability of Probe 1. To further investigate whether the Probe 1 has an inhibitory effect on endogenous HOCl, HeLa cells were selected as a cell model and treated with phorbol myristate acetate (PMA) and lipopolysaccharide (LPS) to produce HOCl.47 After stimulation with PMA and LPS in the presence of Probe 1 (10−5 M), bright green fluorescence was clearly observed to be quenched in HeLa cells (Fig. 5). These data indicate that the probe can be used as an indicator in the process of endogenous HOCl production in cells.Conclusions
In summary, a novel thioether responsive fluorescent probe based on ICT mechanism was constructed for the detection of HOCl. At the same time, since it has high selectivity, fast response speed (<2 min), large Stokes shift (120 nm), high fluorescence quantum yield (Φ = 0.93), low detection limit (0.237 μM) and visible colour change, the probe has good potential application. In addition, fluorescence confocal imaging experiments on HeLa cell model showed that Probe 1 was feasible in detecting endogenous and exogenous hypochlorous acid.Conflicts of interest
There are no conflicts to declare.Acknowledgements
This work was supported by the National Natural Science Foundation of China (No. 21606147 and 21305079), the Academy of Science and Technology Project of Shandong Academy of Medical Sciences (No. 2017-55, 2018-19), Key Projects of Industrial Science and Technology Plan in Qiannan Prefecture (2017) 11, Project of the Haixi Science and Technology Bureau of Qinghai Province 2017-Q4.Notes and references
- J. M. Zgliczyński, T. Stelmaszyńska, W. Ostrowiski, J. Naskalski and J. Sznajd, Eur. J. Biochem., 2010, 4, 540–547 CrossRef.
- J. Shepherd, S. A. Hilderbrand, P. Waterman, J. W. Heinecke, R. Weissleder and P. Libby, Chem. Biol., 2007, 14, 1221–1231 CrossRef CAS.
- C. Liu, Q. Wang, X. Jiao, H. Yao, S. He, L. Zhao and X. Zeng, Dyes Pigm., 2019, 160, 989–994 CrossRef CAS.
- L.-J. Zhang, X. Zhao, D. Yang, Z.-Z. Jia, X. Han, L.-Q. Sun, L.-L. Yu, J.-T. Liu, X.-D. He, J.-Y. Miao and B.-X. Zhao, Sens. Actuators, B, 2018, 276, 8–12 CrossRef CAS.
- H. Guo, Y. Jing, X. Yuan, S. Ji, J. Zhao, X. Li and Y. Kan, Org. Biomol. Chem., 2011, 9, 3844–3853 RSC.
- S. J. Klebanoff, J. Leukocyte Biol., 2005, 77, 598–625 CrossRef CAS.
- M. Sun, H. Yu, H. Zhu, F. Ma, S. Zhang, D. Huang and S. Wang, Anal. Chem., 2014, 86, 671–677 CrossRef CAS.
- J. E. Harrison and J. Schultz, J. Biol. Chem., 1976, 251, 1371–1374 CAS.
- D. Pattison and M. Davies, Chem. Res. Toxicol., 2012, 14, 1453–1464 Search PubMed.
- M. Benhar, D. Engelberg and A. Levitzki, EMBO Rep., 2002, 3, 420–425 CrossRef CAS.
- Y. R. Zhang, X. P. Chen, J. Shao, J. Y. Zhang, Q. Yuan, J. Y. Miao and B. X. Zhao, Chem. Commun., 2014, 50, 14241–14244 CAS.
- K. Dou, G. Chen, F. Yu, Z. Sun, G. Li, X. Zhao, L. Chen and J. You, J. Mater. Chem. B, 2017, 5, 8389–8398 RSC.
- D. Zheng, X. Qiu, C. Liu, X. Jiao, S. He, L. Zhao and X. Zeng, New J. Chem., 2018, 42, 5135–5141 RSC.
- C. Tang, Y. Gao, T. Liu, Y. Lin, X. Zhang, C. Zhang, X. Li, T. Zhang, L. Du and M. Li, Org. Biomol. Chem., 2018, 16, 645–651 RSC.
- H. Ma, B. Song, Y. Wang, D. Cong, Y. Jiang and J. Yuan, Chem. Sci., 2016, 8, 150–159 RSC.
- O. Lupan, L. Chow, T. Pauporté, L. K. Ono, B. R. Cuenya and G. Chai, Sens. Actuators, B, 2012, 173, 772–780 CrossRef CAS.
- I. G. Casella and M. Gatta, J. Agric. Food Chem., 2002, 50, 23–28 CrossRef CAS.
- S. Iguchi, Y. Miseki and K. Sayama, Sustainable Energy Fuels, 2018, 2, 155–162 RSC.
- X. Liang, L. Zhang, X. Xu, D. Qiao, T. Shen, Z. Yin and L. Shang, ChemistrySelect, 2019, 4, 1330–1336 CrossRef CAS.
- M. Lin, J. Huang, F. Zeng and S. Wu, Chem.–Asian J., 2019, 14, 802–808 CrossRef CAS PubMed.
- M. Ren, B. Deng, K. Zhou, X. Kong, J.-Y. Wang and W. Lin, Anal. Chem., 2017, 89, 552–555 CrossRef CAS.
- W. Wu, J. Li, L. Chen, Z. Ma, W. Zhang, Z. Liu, Y. Cheng, L. Du and M. Li, Anal. Chem., 2014, 86, 9800–9806 CrossRef CAS.
- Q. Xu, K.-A. Lee, S. Lee, K. M. Lee, W.-J. Lee and J. Yoon, J. Am. Chem. Soc., 2013, 135, 9944–9949 CrossRef CAS.
- X. Li, Q. Liu, S. Ye, S. Wang, K. Li, G. Lv, Y. Peng, L. Qiu and J. Lin, Chem. Biol. Drug Des., 2019, 80, 1–10 Search PubMed.
- M. J. Chang, J. H. Joo and M. H. Lee, Bull. Korean Chem. Soc., 2019, 40, 539–543 CrossRef CAS.
- L. Zang, C. Liang, W. Ying, W. Bu, H. Sun and S. Jiang, Sens. Actuators, B, 2015, 211, 164–169 CrossRef CAS.
- Z. Hao, F. Jiangli, W. Jingyun, M. Huiying and P. Xiaojun, J. Am. Chem. Soc., 2014, 136, 12820–12823 CrossRef.
- B. Zhang, X. Yang, R. Zhang, Y. Liu, X. Ren, M. Xian, Y. Ye and Y. Zhao, Anal. Chem., 2017, 89, 10384–10390 CrossRef CAS.
- Y.-R. Zhang, Z.-M. Zhao, L. Su, J.-Y. Miao and B.-X. Zhao, RSC Adv., 2016, 6, 17059–17063 RSC.
- K. Xiong, F. Huo, C. Yin, Y. Chu, Y. Yang, J. Chao and A. Zheng, Sens. Actuators, B, 2016, 224, 307–314 CrossRef CAS.
- S. Kenmoku, Y. Urano, H. Kojima and T. Nagano, J. Am. Chem. Soc., 2007, 129, 7313–7318 CrossRef CAS.
- Y. Koide, Y. Urano, K. Hanaoka, T. Terai and T. Nagano, J. Am. Chem. Soc., 2011, 133, 5680–5682 CrossRef CAS.
- P. Venkatesan and S.-P. Wu, Analyst, 2015, 140, 1349–1355 RSC.
- B. Chen, H. Fu, Y. Lv, X. Li and Y. Han, Tetrahedron Lett., 2018, 59, 1116–1120 CrossRef CAS.
- S.-R. Liu and S.-P. Wu, Org. Lett., 2013, 15, 878–881 CrossRef CAS.
- W. Feng, Q.-L. Qiao, S. Leng, L. Miao, W.-T. Yin, L.-Q. Wang and Z.-C. Xu, Chin. Chem. Lett., 2016, 27, 1554–1558 CrossRef CAS.
- Q. Duan, P. Jia, Z. Zhuang, C. Liu, X. Zhang, Z. Wang, W. Sheng, Z. Li, H. Zhu, B. Zhu and X. Zhang, Anal. Chem., 2019, 91, 2163–2168 CrossRef CAS.
- S. Mingtai, Y. Huan, Z. Houjuan, M. Fang, Z. Shan, H. Dejian and W. Suhua, Anal. Chem., 2014, 86, 671–677 CrossRef.
- M. Ren, Z. Li, B. Deng, L. Wang and W. Lin, Anal. Chem., 2019, 91, 2932–2938 CrossRef CAS.
- R. Joshi, O. R. Meitei, H. Kumar, M. Jadhao and S. K. Ghosh, J. Phys. Chem. A, 2016, 120, 1000–1011 CrossRef CAS.
- J. Liu and Z. Yin, Talanta, 2019, 196, 352–356 CrossRef CAS.
- N. I. Georgiev, P. V. Krasteva and V. B. Bojinov, J. Lumin., 2019, 212, 271–278 CrossRef CAS.
- C. Duan, M. Won, P. Verwilst, J. Xu, H. S. Kim, L. Zeng and J. S. Kim, Anal. Chem., 2019, 91, 4172–4178 CrossRef CAS.
- B. Deng, M. Ren, X. Kong, Z. Kai and W. Lin, Sens. Actuators, B, 2017, 255, 963–969 CrossRef.
- M. Vedamalai, D. Kedaria, R. Vasita and I. Gupta, Sens. Actuators, B, 2018, 263, 137–142 CrossRef CAS.
- Y. Yang, F. Huo, C. Yin, M. Xu, Y. Hu, J. Chao, Y. Zhang, T. E. Glass and J. Yoon, J. Mater. Chem. B, 2016, 4, 5101–5104 RSC.
- X. Han, C. Tian, J. Jiang, M. S. Yuan, S. W. Chen, J. Xu, T. Li and J. Wang, Talanta, 2018, 186, 65–72 CrossRef CAS PubMed.
Footnote |
| † Electronic supplementary information (ESI) available. See DOI: 10.1039/c9ra06174f |
| This journal is © The Royal Society of Chemistry 2019 |

