
 Open Access Article
 This Open Access Article is licensed under a Creative Commons Attribution-Non Commercial 3.0 Unported Licence
Upconversion luminescence in sub-10 nm β-NaGdF4:Yb3+,Er3+ nanoparticles: an improved synthesis in anhydrous ionic liquids†
Gabriella Tessitore ab,
Anja-Verena Mudring*c and
Karl W. Krämer*a
ab,
Anja-Verena Mudring*c and
Karl W. Krämer*a
aUniversity of Bern, Department of Chemistry and Biochemistry, Freiestrasse 3, 3012 Bern, Switzerland. E-mail: karl.kraemer@dcb.unibe.ch
bConcordia University, Department of Chemistry and Biochemistry, 7141 Sherbrooke W., H4B1R6, Montreal, QC, Canada
cStockholm University, Department of Materials and Environmental Chemistry, Svante Arrhenius väg 16 C, 106 91 Stockholm, Sweden. E-mail: anja-verena.mudring@mmk.su.se
First published on 29th October 2019
Abstract
Sub-10 nm β-NaGdF4:18% Yb3+,2% Er3+ nanoparticles were synthesized in ethylene glycol and various ionic liquids under microwave heating. The products were characterized by powder X-ray diffraction, electron microscopy, and upconversion (UC) luminescence spectroscopy. After Yb3+ excitation at 970 nm, Er3+ ions are excited by energy transfer upconversion and show the typical green and red emission bands. The UC luminescence intensity was optimized with respect to reactant concentrations, solvents, and reaction temperature and time. The strongest UC emission was achieved for sub-20 nm core–shell nanoparticles which were obtained in the ionic liquid diallyldimethylammonium bis(trifluoromethanesulfonyl)amide from a two-step synthesis without intermediate separation. Strictly anhydrous reaction conditions, a high fluoride/rare earth ion ratio, and a core–shell structure are important parameters to obtain highly luminescent nanoparticles. These conditions reduce non-radiative losses due to defects and high energy acceptor modes of surface ligands. A low power excitation of the core–shell particles by 70 mW at 970 nm results in an impressive UC emission intensity of 0.12% compared to the bulk sample.
1. Introduction
About a decade ago, the work of Haase and Güdel et al. initiated the investigation of upconversion (UC) luminescence from transparent solutions of nanoparticles.1,2 They reported a synthetic route to cubic α-NaYF4![[thin space (1/6-em)]](https://www.rsc.org/images/entities/char_2009.gif) :Yb3+, Er3+ and hexagonal β-NaGdF4:Yb3+,Er3+ nanoparticles dispersed in dimethyl sulfoxide. After 980 nm laser excitation of Yb3+, blue, green, and red UC emission from Er3+ was observed from clear, colorless solutions. Since then the number of publications on upconversion grew exponentially, about half of them investigating nanoparticles, most prominent with Yb3+ and Er3+ cooping.3 Auzel gave a comprehensive review on UC ions and processes.4 Hexagonal sodium rare earth fluorides, β-NaREF4 (RE = rare earth), are among the most efficient UC host lattices.5–7 Two crystallographically distinct RE sites were structurally and spectroscopically characterized in β-NaGdF4:Er3+.8 Both have nine-fold coordination, which implies non-centrosymmetric RE sites. Microscopic disorder gives rise to line broadening and a higher probability for spectroscopic overlap of the UC steps. Due to longer RE–F distances and a higher coordination number, hexagonal β-NaREF4 has lower effective phonon energy than the cubic α-phase. Accordingly, the UC emission intensity of β-NaREF4 is about an order of magnitude stronger compared to the respective α-NaREF4 host lattice.8 UC mechanisms were investigated in detail,4 and recently it was shown that the Er3+ 4F9/2 → 4I15/2 emission in β-NaYF4 originates from cross-relaxation but not from multi-phonon relaxation.9,10 Syntheses for sodium rare earth fluoride nanoparticles were reported by many groups.11–14
:Yb3+, Er3+ and hexagonal β-NaGdF4:Yb3+,Er3+ nanoparticles dispersed in dimethyl sulfoxide. After 980 nm laser excitation of Yb3+, blue, green, and red UC emission from Er3+ was observed from clear, colorless solutions. Since then the number of publications on upconversion grew exponentially, about half of them investigating nanoparticles, most prominent with Yb3+ and Er3+ cooping.3 Auzel gave a comprehensive review on UC ions and processes.4 Hexagonal sodium rare earth fluorides, β-NaREF4 (RE = rare earth), are among the most efficient UC host lattices.5–7 Two crystallographically distinct RE sites were structurally and spectroscopically characterized in β-NaGdF4:Er3+.8 Both have nine-fold coordination, which implies non-centrosymmetric RE sites. Microscopic disorder gives rise to line broadening and a higher probability for spectroscopic overlap of the UC steps. Due to longer RE–F distances and a higher coordination number, hexagonal β-NaREF4 has lower effective phonon energy than the cubic α-phase. Accordingly, the UC emission intensity of β-NaREF4 is about an order of magnitude stronger compared to the respective α-NaREF4 host lattice.8 UC mechanisms were investigated in detail,4 and recently it was shown that the Er3+ 4F9/2 → 4I15/2 emission in β-NaYF4 originates from cross-relaxation but not from multi-phonon relaxation.9,10 Syntheses for sodium rare earth fluoride nanoparticles were reported by many groups.11–14
UC nanoparticles were used in various applications, e.g. biological imaging, photodynamic therapy, and nano-thermometry.15–20 Continuous improvements of the syntheses yielded nanoparticles of smaller size and stronger luminescence;21–26 water-dispersible particles are more prone for biological imaging applications.27–30 UC luminescence nanoparticles provide several advantages as biological fluorophores. They show low light scattering, no auto bleaching, and near infrared excitation light has a deep tissue penetration depth.15 Both in vitro and in vivo experiments led to encouraging results without significant hints for any cytotoxicity of sodium rare earth fluoride nanoparticles.15
Syntheses of UC nanoparticles in high boiling solvents or under hydrothermal conditions are meanwhile well established.1,2,11–28 Often, oleic acid is used as coordinating ligand. Oxide ions from its carboxyl groups can substitute for fluoride in the rare earth coordination sphere on the particle surface due to the similar size of O and F. High energy vibration modes of the ligands increase losses by multi-phonon relaxation.31 The high surface-to-volume ratio results in a significant number of (surface) defects in nanoparticles which decrease the luminescence compared to the bulk material. Accordingly, the UC emission from nanoparticles is still about three orders of magnitude lower than for the respective μm-size phosphor powder.21,32 A shell of undoped host material efficiently protects the active core and reduces quenching from surface defects and ligands.31,33 Finally, surface functionalization is required to achieve water-dispersible nanoparticles.31
Microwave heating was successfully applied for syntheses in polar or ionic solvents.34 The homogeneous heating results in lower temperature and shorter time for the reaction.35,36 Ethylene glycol (EG) and ionic liquids (ILs) were proficiently used in microwave syntheses of luminescent materials.37–43 Uniform nucleation of particles was achieved which results in a narrow particle size distribution. ILs with complex fluoride anions such as BF4− have a dual use as solvent and fluoride source. Cubic α-NaYF4:Yb3+, Er3+ nanoparticles were obtained from a microwave synthesis in BF4 ILs.39,44 A synthesis in the imidazolium IL 1-butyl-3-methylimidazolium tetrafluoroborate, (C4mim) (BF4), yields phase pure hexagonal nanoparticles.44 The ions determine the heating efficiency36 and the properties of the IL, e.g. thermal stability, dielectric constant, ionic conductivity, and water content.45–47 The dielectric heating depends on the dipole relaxation and ionic motion of the IL and increases with the microwave absorption. A comparison between tetrafluoroborate (BF4) and bis(trifluoromethanesulfonyl)amide (NTf2) ILs revealed that asymmetric NTf2 heat more efficiently than symmetric BF4 anions,36 because the dipole relaxation takes place only in asymmetric anions. Hydrophobic anions such as NTf2 result in lower moisture content of the IL than for hydrophilic anions48 and such reduce the number of OH− defects in fluoride products. In the present paper, we investigate the influence of ILs with diallyldimethylammonium cations and several different counter anions on the synthesis of β-NaGdF4:Yb3+,Er3+ nanoparticles with respect to phase purity and particle size. The synthetic parameters, as well as the core, core/shell, and ligand design, were optimized for UC luminescence intensity.
2. Experimental
2.1. Sample preparation
In a typical reaction, 30 mg (0.085 mmol) anhydrous rare earth acetate RE(AcO)3 (RE = Gd, Er, Yb) was ground with 10 mg (0.17 mmol) NaCl (Reagent grade, Merck) under inert atmosphere and then mixed with 0.5 ml solvent (EG or IL). The molar ratios were fixed to 80/2/18 for Gd/Er/Yb and 2/1 for Na/RE in all samples. These ratios were optimized for bulk samples before.6,7 The acetate solution was heated to 60 °C for 5 minutes with a Biotage Initiator+ Robot Eight microwave synthesis system (Biotage AB, Uppsala, Sweden). Fluoride-containing ILs or NH4F (Alfa Aesar, 96%) were used as fluoride sources; the effects of the reactant (BF4− or NH4F) and the F− concentration (60–180 mg, 1.62–4.86 mmol) were evaluated. In a microwave glass vial, the fluoride source was added to 1.5 ml of an EG/IL solution or the IL alone and stirred up to homogeneity. The acetate suspension was added dropwise to the microwave vial and stirred overnight before the microwave heating. The temperature in the reactor was controlled by dry compressed air (4 bar), and microwave powers of 400 W or 50 W were used for EG/IL solutions or pure IL, respectively. For separation, the nanoparticles were sequentially washed several times with methanol and ethanol. They were collected by centrifugation at 3000 rpm for 5 min and dried at 80 °C overnight. Alternatively, the nanoparticles were kept in solution for subsequent growth of an undoped shell. Experimental conditions for all samples are summarized in Table 1.
| Sample | EG (ml) | IL (ml) | IL anion | RE(AcO)3 (mg) | NaCl (mg) | NH4F (mg) | T (°C) | Time (min) | P (W) | Phase |
|---|---|---|---|---|---|---|---|---|---|---|
| EG1 | 1 | 1 | BF4 | 60 | 20 | 0 | 200 | 30 | 400 | α |
| EG2 | 1 | 1 | OTf | 60 | 20 | 80 | 200 | 30 | 400 | β |
| EG3 | 0.5 | 1.5 | OTf | 60 | 20 | 60 | 120 | 30 | 400 | β |
| EG4 | 0.5 | 1.5 | OTf | 60 | 20 | 80 | 120 | 30 | 400 | β |
| EG5 | 0.5 | 1.5 | OTf | 60 | 20 | 100 | 120 | 30 | 400 | β |
| EG6 | 0.5 | 1.5 | OTf | 60 | 20 | 120 | 120 | 30 | 400 | β |
| EG7 | 0.5 | 1.5 | OTf | 60 | 20 | 120 | 160 | 30 | 400 | β |
| EG8 | 0.5 | 1.5 | OTf | 60 | 20 | 120 | 200 | 30 | 400 | β |
| EG9 | 0.5 | 1.5 | OTf | 30 | 10 | 120 | 200 | 30 | 400 | β |
| EG10 | 1.5 | 0.5 | OTf | 30 | 10 | 120 | 200 | 30 | 400 | β |
| EG11 | 2 | 0 | OTf | 30 | 10 | 120 | 200 | 30 | 400 | β |
| EG12 | 0.5 | 1.5 | NTf2 | 30 | 10 | 120 | 200 | 30 | 400 | β |
| EG13 | 1.5 | 0.5 | NTf2 | 30 | 10 | 120 | 200 | 30 | 400 | β |
| IL1 | 0 | 2 | OTf | 30 | 10 | 120 | 200 | 30 | 50 | β |
| IL2 | 0 | 2 | NTf2 | 30 | 10 | 120 | 200 | 30 | 50 | β |
| IL3 | 0 | 2 | NTf2 | 30 | 10 | 60 | 225 | 5 | 50 | α/β |
| IL4 | 0 | 2 | NTf2 | 30 | 10 | 100 | 225 | 5 | 50 | β |
| IL5 | 0 | 2 | NTf2 | 30 | 10 | 140 | 225 | 5 | 50 | β |
| IL6 | 0 | 2 | NTf2 | 30 | 10 | 180 | 225 | 5 | 50 | β |
| IL7 | 0 | 2 | NTf2 | 30 | 10 | 140 | 200 | 5 | 50 | β |
| IL8 | 0 | 2 | NTf2 | 30 | 10 | 140 | 250 | 5 | 50 | α/β |
| IL9 | 0 | 2 | NTf2 | 30 | 10 | 140 | 250 | 10 | 50 | α/β |
| CS_IL4 | 0 | 0.5 | NTf2 | 30 | 10 | 33 | 200 | 5 | 50 | β |
2.2. Experimental methods
X-ray diffraction (XRD) patterns were measured on a StadiP powder diffractometer (STOE, Darmstadt, Germany) in transmission geometry at room temperature. Cu Kα1 radiation (λ = 1.540598 Å) was used from a 40 kV 40 mA X-ray source and a focusing Ge (111) monochromator. Layers of nanoparticles were prepared on thin plastic foil. Data were recorded by a Mythen 1K linear position sensitive detector (Dectris, Baden, Switzerland) with 0.01° resolution in 2-theta.
Upconversion luminescence spectra were measured in a standardized setup. Dry powder samples were filled in glass tubes of 1 mm inner diameter. The nanoparticles were excited at 970 nm by an SDL-6380-L2 fiber-coupled cw NIR laser diode (maximum power 2.5 W) and an SDL-820 highly stabilized laser diode driver (Spectra Diode Labs). The unfocused excitation light was transmitted to and the luminescence collected from the sample by a QP 400-2-VIS-BX Y-type glass fiber (Ocean Optics) with 400 μm core diameter. The luminescence was recorded by an HR-2000-CG-UV-NIR fiber spectrometer (Ocean Optics). For comparative measurements of the luminescence intensity, only the sample tubes were exchanged. The reliability and repeatability of the measurements were better than 5%. All spectra were measured at room temperature and corrected for the spectral response of the detection system by calibration with a tungsten lamp.50
Transmission electron microscopy (TEM) analyses were accomplished on a G2 Spirit BioTWIN TEM (Tecnai) using a LaB6 120 kV electron beam. Images were recorded by an SIS Veleta side-mounted CCD camera (Olympus) with 4 megapixels at 30000-fold magnification (pictures with 500 nm scale), 100000-fold magnification (picture with 200 nm scale), and 300000-fold magnification (pictures with 50 nm scale). High-resolution TEM micrographs were recorded on a G2 F20 FE-TEM (Tecnai) using a ZrO2/W (100) Schottky field emitter gun. A Falcon II direct electron detector (FEI) with 4096 × 4096 pixels and an Orius SC200 CCD camera (Gatan Inc.) with 2048 × 2084 pixels were used. The specimens were prepared from diluted ethanol solutions on carbon-coated copper grids (300 mesh). The pictures were analyzed by the ImageJ 1.49v software (National Institute of Health, USA).
The thermal decomposition of rare earth acetates was investigated under a nitrogen flow of 20 ml min−1 and a heating rate of 5 K min−1 by thermogravimetric analysis using a TGA/SDTA 851e (Mettler-Toledo, Schwerzenbach, Switzerland).
3. Results and discussion
3.1. β-NaGdF4:Yb3+,Er3+ nanoparticles from EG/IL mixtures
X-ray diffraction patterns of cubic α- and hexagonal β-NaGdF4:18% Yb3+,2% Er3+ nanoparticles are shown in Fig. 1. Samples were obtained from EG/DADMA BF4 (EG1) and EG/DADMA NTf2 (EG2) solutions with BF4− and NH4F as fluoride sources, respectively, see Table 1. Both samples were heated for 30 min at 200 °C. Tetrafluoroborate anions decompose at 160 °C and release F− ions into the solution. Sample EG1 crystallizes in the cubic α-NaGdF4 phase. The calculated peak positions are shown as red ticks below the top trace in Fig. 1 α-NaGdF4 crystallizes in space group Fm![[3 with combining macron]](https://www.rsc.org/images/entities/char_0033_0304.gif) m in a structure related to CaF2.51,52 Its strongest diffraction peak (111) is located at 28° 2-theta.
m in a structure related to CaF2.51,52 Its strongest diffraction peak (111) is located at 28° 2-theta.
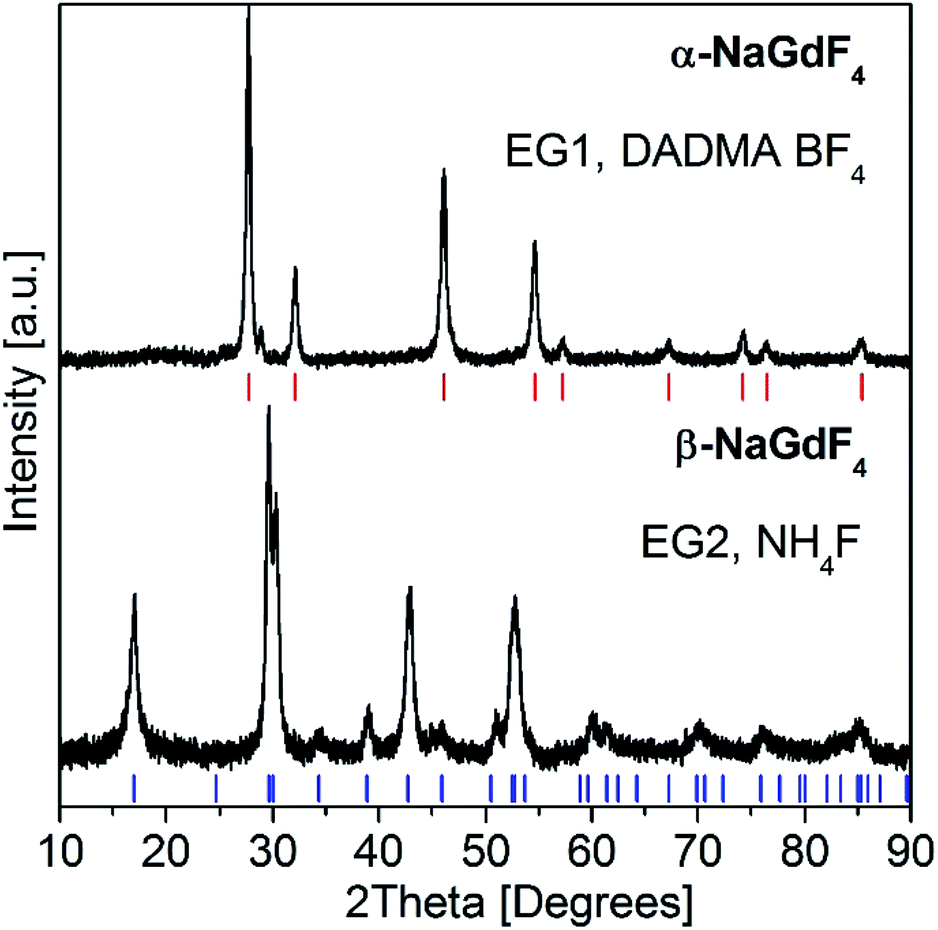 | ||
Fig. 1 Powder XRD patterns of nanocrystalline α-NaGdF4:18% Yb3+,2% Er3+ (EG1, top trace) and β-NaGdF4:18% Yb3+,2% Er3+ (EG2, bottom trace). Samples were synthesized in EG/IL solutions with DADMA BF4 and NH4F, respectively, see Table 1. The calculated peak positions for cubic α-NaGdF4 (Fmm) and hexagonal β-NaGdF4 (P![[6 with combining macron]](https://www.rsc.org/images/entities/char_0036_0304.gif) ) are shown as red and blue ticks below the traces, respectively. ) are shown as red and blue ticks below the traces, respectively. | ||
The pure hexagonal β-NaGdF4 phase was obtained from an NH4F solution for sample EG2, see the bottom trace in Fig. 1.
The calculated peak positions are shown as blue ticks. β-NaGdF4 crystallizes in the β-NaNdF4 structure with space group P and lattice parameters of a = 6.0304 (9) Å and c = 3.6111 (7) Å at room temperature.8,53 A F− excess favors the formation of the hexagonal β-NaGdF4 phase.53 BF4− as fluoride source yields preferentially the cubic α-phase in a microwave synthesis, since the slow BF4− decomposition during heating provides low fluoride concentration, only. The UC luminescence of cubic α-NaGdF4:2% Er3+,18% Yb3+ bulk material is about an order of magnitude less intense compared to the hexagonal β-phase.9 Accordingly, NH4F was chosen as fluoride source in order to obtain hexagonal nanoparticles with strong UC emission.
The influence of DADMA ILs on the microwave synthesis was investigated. The thermal stability of the IL depends on the anion and increases along the series TFA < BF4 < OTf < NTf2. The stability determines the maximum reaction temperature, ranging from 120 °C (TFA) to 200 °C (BF4, OTf, and NTf2) for EG/IL solutions and 400 W microwave power. Higher temperatures result in partial decomposition of the IL, and the colorless solutions turn brown. Samples were synthesized under identical conditions in different ILs. Their phase purity and UC luminescence are compared in Fig. S3–S4 (ESI†). All products show a pure hexagonal phase in powder XRD, see Fig. S3 (ESI†). The anions strongly influence the β-NaGdF4:18% Yb3+,2% Er3+ UC luminescence which increases with the thermal stability of the ILs along the series BF4 < OTf < NTf2, see Fig. S4 (ESI†). Asymmetric anions such as TFA, OTf, and NTf2 have a higher microwave absorption, which results in more effective heating compared to the symmetric BF4−. The luminescence from the DADMA TFA sample was too weak to be compared with the others. Also, the hygroscopicity of the IL is relevant. Samples from hydrophobic DADMA NTf2 show a stronger luminescence than those from hygroscopic ILs. Lower water contamination of the IL decreases the number of OH− impurities in the nanoparticles and non-radiative losses from these defects. The crucial importance of strictly dry reaction conditions is further supported by samples obtained from anhydrous rare earth acetates versus those from acetate hydrates, see Fig. S5 (ESI†). The UC luminescence from nanoparticles synthesized from dry precursors is much stronger than from hydrates. Fig. 2 shows the influence of fluoride concentration, temperature, and rare earth concentration on the UC luminescence. The NH4F content was varied from 60 mg to 120 mg for samples EG3 to EG6, see Table 1. The stability of the hexagonal phase increases with the F− concentration, as shown in Fig. S6† (ESI). The weak (111) diffraction peak of the cubic phase around 28° 2-theta disappears by raising the NH4F content from 60 to 100 mg. For higher F− concentrations, only the hexagonal phase is obtained. As an impurity, NaF was identified, which does not influence the UC luminescence. The NaF diffraction peaks have a narrow line width and are marked with asterisks for the top trace of Fig. S6.† The crystallite size was evaluated from the XRD patterns in Fig. S6,† ranging from 6 to 14 nm.
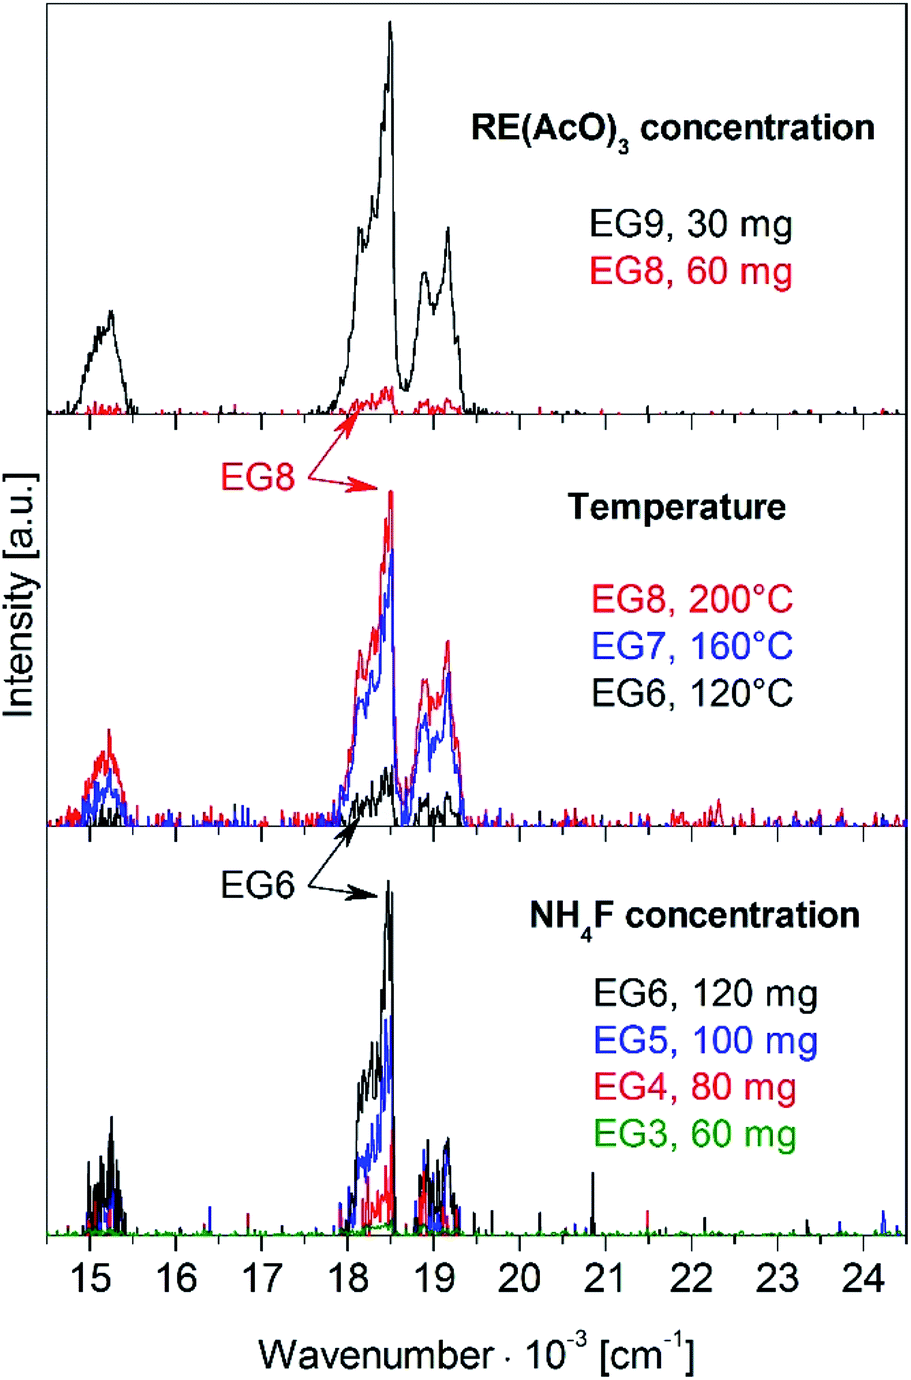 | ||
| Fig. 2 Upconversion luminescence of β-NaGdF4:18% Yb3+,2% Er3+ nanoparticles from EG/DADMA OTf syntheses in dependence on fluoride concentration (bottom), reaction temperature (middle), and rare earth acetate concentration (top). The intensity scale increases from bottom to top. Sample names refer to Table 1. The UC luminescence was excited at 970 nm with 580 mW (unfocused) laser power. | ||
For the UC luminescence spectra in Fig. 2, Yb3+ ions are excited at 970 nm. Excited Yb3+ ions can transfer energy resonantly to neighboring Er3+ ions in several steps. The energy transfer upconversion (ETU) first populates the 4I11/2 state and in a second step the 4F7/2 state of Er3+, which decays via multi-phonon relaxation to the 2H11/2 and 4S3/2 states. These states are in thermal equilibrium, and their emission to the 4I15/2 ground state yields the typical green Er3+ UC luminescence.4,7 The 4F9/2 state is populated via cross relaxation.9,10 Its emission to the ground state adds a red component to the luminescence. The UC luminescence intensity increases 2-fold from sample EG3 to EG6 for higher F− concentration, see Fig. 2 bottom and Table 1. Another 2-fold increase of the UC intensity is achieved by rising the reaction temperature from 120 °C to 200 °C for samples EG6 to EG8, see Fig. 2 middle. The emission intensity rises 16-fold by halving the rare earth acetate content from 60 mg to 30 mg for samples EG8 and EG9, see Fig. 2 top. As for a higher F− content, a smaller rare earth ion concentration increases the F/RE ratio. A higher reaction temperature results in larger and better crystalline nanoparticles.24 In summary, a high F/RE ratio and a high reaction temperature strongly increase the UC luminescence intensity.
From the literature, it is known that higher NH4F concentrations increase the aggregate size of β-NaGdF4:Eu3+ and Er3+ nanoparticles synthesized at room temperature in EG.54,55 Aggregation reduces the exposed particle surface; concomitantly, the non-radiative relaxation decreases and UC luminescence is not quenched. The same was reported for nanoparticles from octadecene/oleic acid solutions.11 Since nanoparticles from EG solutions are often affected by agglomeration,54,55 reactions in EG/IL mixtures and pure ILs, in particular the hydrophobic DADMA NTf2, were investigated in order to reduce the aggregate size and increase the UC luminescence.
UC luminescence spectra of β-NaGdF4:18% Yb3+,2% Er3+ nanoparticles from EG/IL mixtures with DADMA OTf and DADMA NTf2 are shown in Fig. 3. The UC emission intensity increases strongly when the EG content is reduced. The by far best results were obtained from syntheses in pure ILs, see the green traces in Fig. 3. Among the pure ILs, the product from hydrophobic DADMA NTf2 (sample IL2) is significantly better than from DADMA OTf (sample IL1). The UC luminescence intensity of sample IL2 is 70-fold higher than for EG11. As discussed above, strictly anhydrous reaction conditions reduce the number of OH− defects in fluorides and restrict non-radiative losses of the luminescence intensity. Avoiding solvents with OH groups, such as EG, is equally important. These solvents may introduce traces of water into the reaction mixture or act as surface ligands with high energy vibration acceptor modes. Another bonus of the synthesis in pure ILs is an increased microwave absorption; compared to EG/IL mixtures, the microwave power could be reduced from 400 W to 50 W.
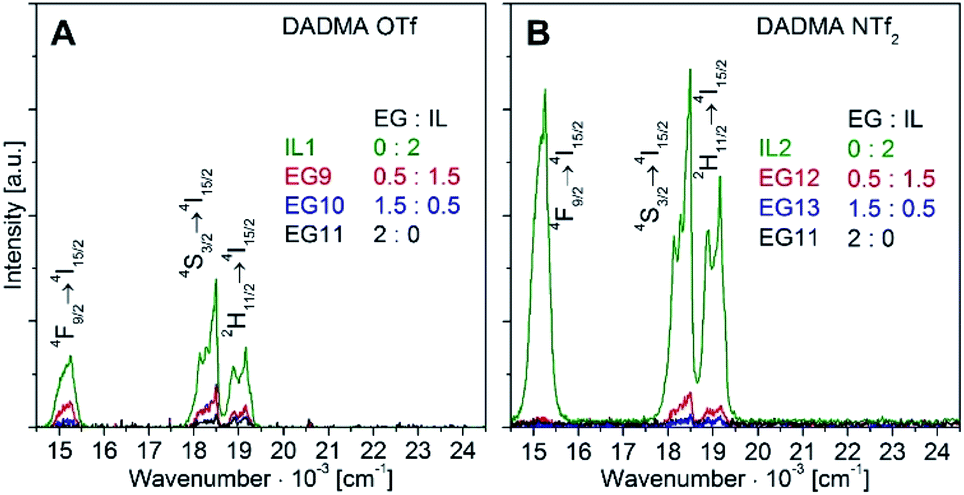 | ||
| Fig. 3 Upconversion luminescence of β-NaGdF4:18% Yb3+,2% Er3+ nanoparticles from EG/IL syntheses with DADMA OTf (A) and DADMA NTf2 (B) for various EG/IL ratios. The sample names refer to Table 1. The UC luminescence was excited at 970 nm with 580 mW (unfocused) laser power. Microwave absorption; compared to EG/IL mixtures, the microwave power could be reduced from 400 W to 50 W. | ||
3.2. β-NaGdF4:Yb3+,Er3+ nanoparticles from IL solutions
Reactions in pure ILs yield material with a better UC luminescence compared to EG or EG/IL syntheses, cf. Fig. 2 and 3, but a different solvent requires the adjustment of reaction parameters. Accordingly, the fluoride concentration, temperature, and reaction time were optimized for syntheses in DADMA NTf2 solutions, see Fig. 4. The ionic liquid has a vapor pressure close to zero and superb thermal stability, which allows higher reaction temperatures. No hints for any decomposition of the IL were detected up to 250 °C, the highest accessible temperature for the microwave system. Due to the stronger microwave absorption of the IL, the reaction time was reduced to 5 min compared to 30 min for EG/IL mixtures.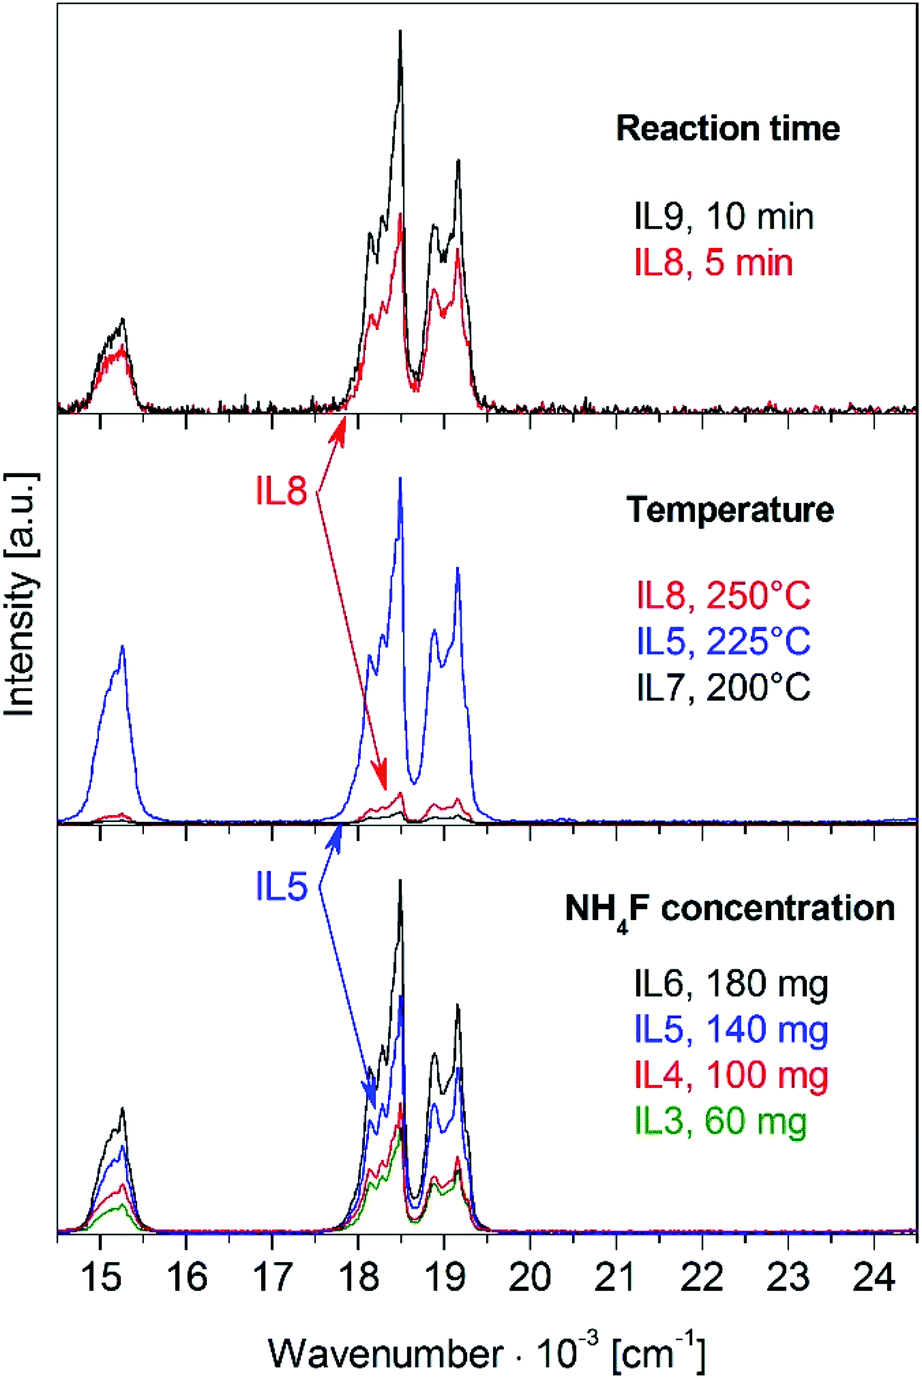 | ||
| Fig. 4 Upconversion luminescence of β-NaGdF4:18% Yb3+,2% Er3+ nanoparticles from IL syntheses in dependence on fluoride concentration (bottom), reaction temperature (middle), and time (top). The sample names refer to Table 1. All samples were excited at 970 nm with 330 mW (unfocused) laser power. | ||
Increasing the fluoride concentration gives rise to a stronger UC luminescence, as demonstrated for samples IL3 to IL6 in Fig. 4, bottom, and in good agreement with Fig. 2. However, a comparison of Fig. S7 and S6 (ESI†) reveals the presence of α-phase in the XRD diagrams of several IL samples. The α-phase content is reduced from IL3 to IL5 and IL6 shows a pure β-phase. A higher fluoride concentration is required in the IL in order to obtain the pure β-phase. For identical fluoride concentration, e.g. EG3 vs. IL3, an IL sample shows a much stronger UC luminescence because of a reduced number of defects due to the anhydrous reaction conditions, despite an α/β phase mixture. Higher fluoride concentrations along the IL3 to IL6 series increase the nanoparticle size as evidenced by the narrower diffraction peaks.
The reaction temperature has a stronger effect on the UC luminescence than the NH4F concentration, see Fig. 5A middle. At 225 °C (IL5) the UC luminescence intensity is 34-fold higher compared to 200 °C (IL7), but it drops again by a factor of 12 towards 250 °C (IL8). The increase from 200 °C to 225 °C is due to a higher crystallinity and bigger particle size of the β-phase. At 250 °C, a significant amount of the α-phase is observed which has a weaker UC emission. The higher temperature favors the formation of the metastable α-phase.
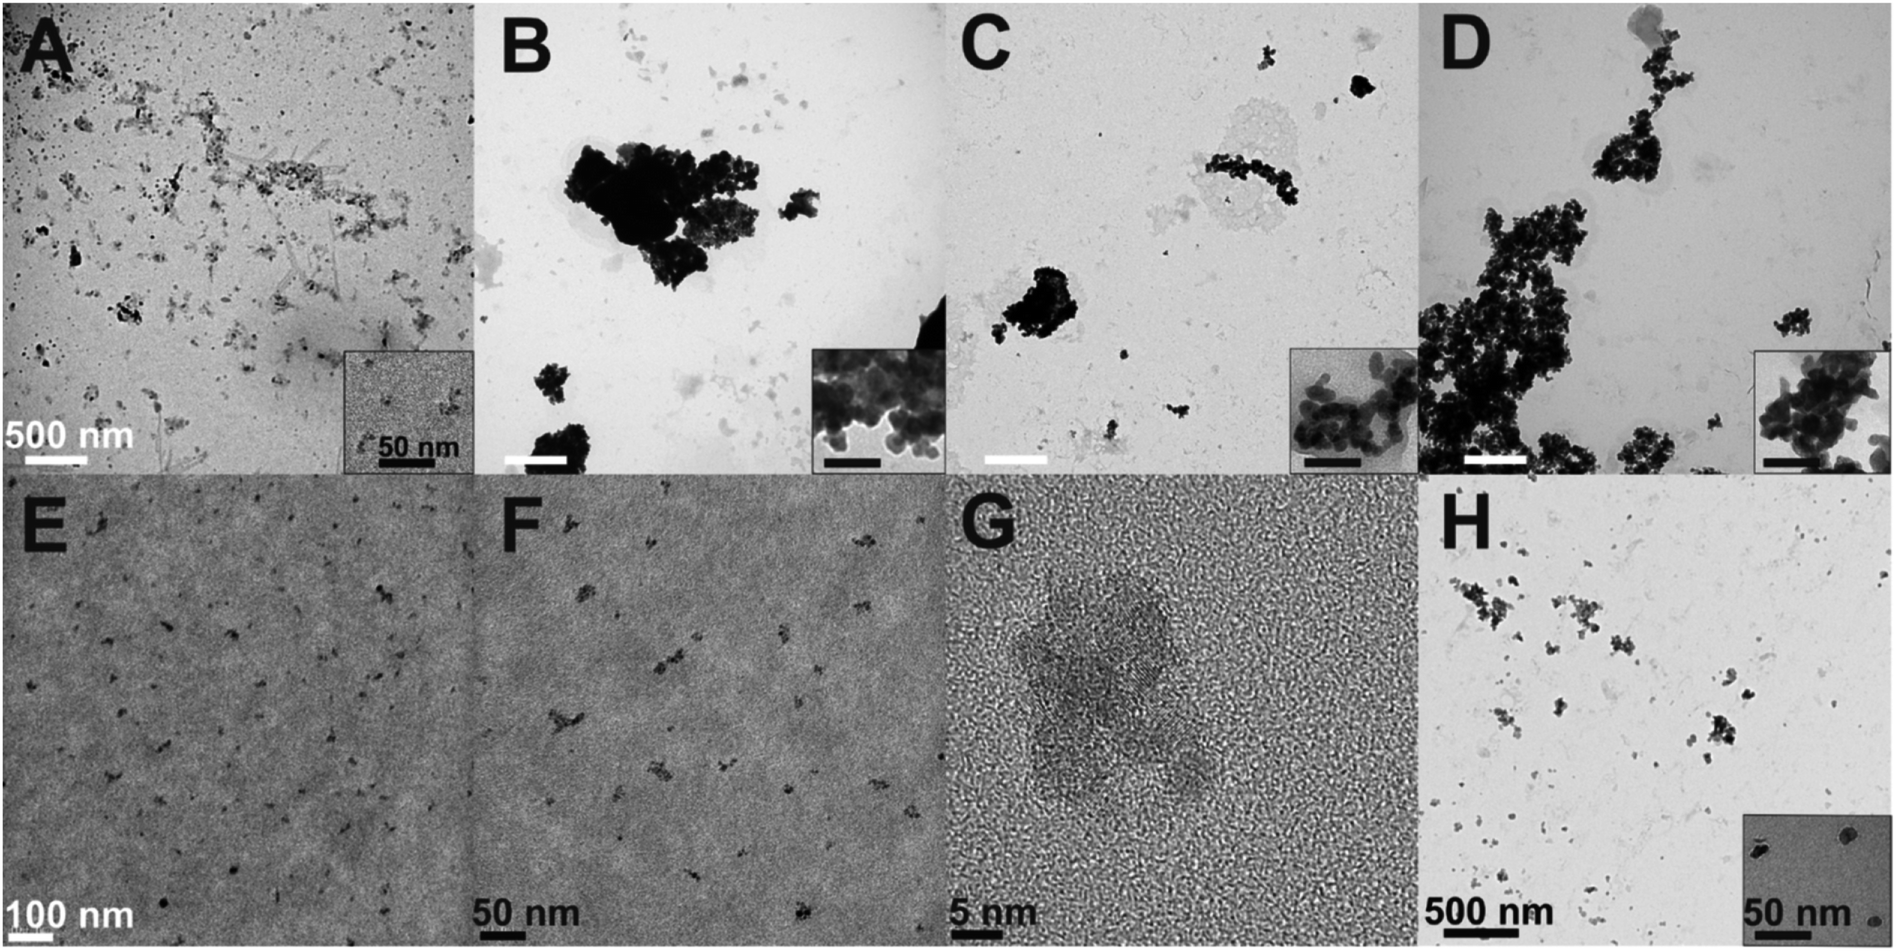 | ||
| Fig. 5 TEM and HR-TEM micrographs of representative samples: (A) IL3 and (B) IL6 from syntheses with 60 mg and 180 mg NH4F at 225 °C; (C) IL8 and (D) IL9 from syntheses with 140 mg NH4F at 250 °C for 5 min and 10 min; (E–G) IL4 from a synthesis with 100 mg NH4F at 225 °C for 5 min; (H) CS_IL4 core–shell nanoparticles. The sample names refer to Table 1. | ||
Doubling the reaction time from 5 to 10 min (IL8 vs. IL9) reduces the amount of α-phase, see Fig. S7 (ESI†). A longer reaction time supports completion of the α → β phase transition, which enhances the UC luminescence, see Fig. 4, top. Overall, sample IL6 shows the best UC emission. Optimized reaction parameters are a high fluoride concentration, 225 °C, and 10 min reaction time.
TEM micrographs of representative samples are shown in Fig. 5. Particle size and agglomeration increase with fluoride concentration, see Fig. 5A and B for samples IL3 and IL6. The crystallite size increases from 3–4 nm to 15–18 nm, and agglomerates form in the μm size range. Longer reaction times result in larger aggregates, see Fig. 5C and D. From higher magnification in Fig. 5E–G, an individual crystallite size in the order of 4.6 ± 1.1 nm becomes visible for sample IL4. It does not show significant aggregation and provides a good UC luminescence. This sample was further used for a core–shell synthesis, where an undoped β-NaGdF4 shell was grown on top of the β-NaGdF4:2% Er3+,18% Yb3+ particles. The core–shell particles (CS_IL4) have a crystallite size <20 nm and show rather small aggregates, see Fig. 5H. Sample IL4 contains a minor fraction of the α-phase, as evident from its XRD pattern, see Fig. S7 (ESI†). In the subsequent reaction step towards the core–shell sample CS_IL4, a complete conversion to the β-phase was achieved, see Fig. S8 (ESI†).
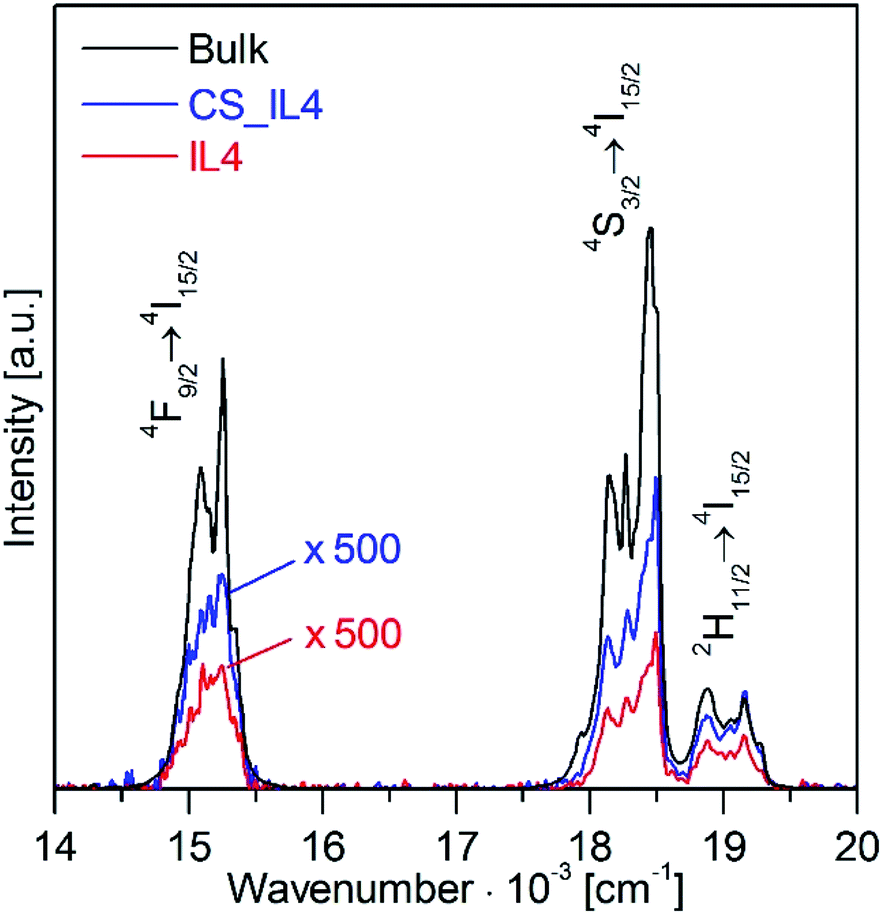
The UC luminescence of samples from EG (EG11) vs. core (IL4) and core–shell particles (CS_IL4) from IL syntheses is compared in Fig. 6 and 7. Samples from IL syntheses show strongly enhanced UC intensities over the EG sample, see Fig. 6. The growth of an undoped β-NaGdF4 shell (CS_IL4, blue trace) around the Er3+, Yb3+ doped core (IL4, red trace) results in doubling of the UC intensity. The impressive differences become evident from the photographs in Fig. 7. Note that the excitation power is reduced almost by half from 580 mW to 330 mW for EG/IL and IL samples, respectively. Dry powder samples of the nanoparticles were filled in glass tubes and are illuminated from the left-hand side by unfocused laser light from a glass fiber. As discussed above, infrared excitation of Yb3+ and energy transfer upconversion between Yb3+ and Er3+ ions result in Er3+ emission in the visible spectral range. Dominant is the green emission from the 4S3/2 and 2H11/2 states, weaker the red emission from the 4F9/2 state. Higher order processes give rise to a small population of the 2H9/2 state and result in a further weak violet UC emission. The high green-to-red UC intensity ratio demonstrates the excellent quality of the nanomaterial with respect to chemical purity, phase purity, and crystallinity.
 | ||
| Fig. 6 Upconversion luminescence of β-NaGdF4:18% Yb3+,2% Er3+ nanoparticles from an EG synthesis (EG11, black trace) compared to core (IL4, red trace) and core–shell (CS_IL4, blue trace) nanoparticles from IL syntheses. The sample names refer to Table 1. The UC luminescence was excited at 970 nm with 580 mW (unfocused) laser power. | ||
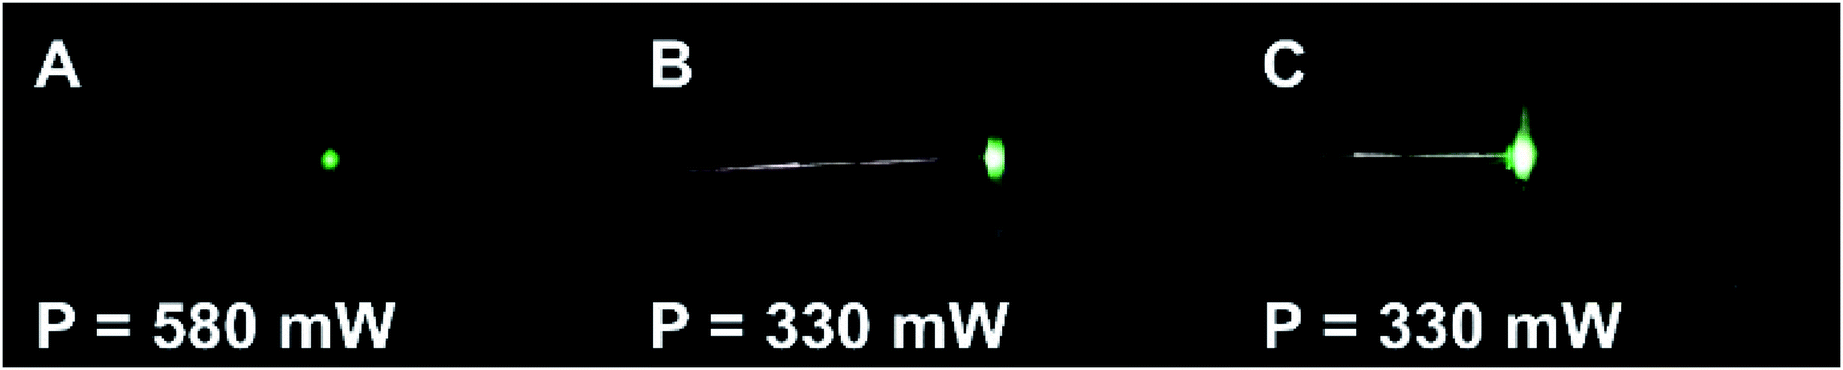 | ||
| Fig. 7 Photos of the UC luminescence from β-NaGdF4:18% Yb3+,2% Er3+ nanoparticles excited at 970 nm with 580 mW or 330 mW (unfocused) laser power, respectively. (A) EG11 from EG/IL, (B) IL4 core, and (C) CS_IL4 core–shell particles from IL syntheses. The sample names refer to Table 1. | ||
The green-to-red ratio is representative for the level of multi-phonon relaxation losses in the sample. The 4F9/2 state can be populated by cross-relaxations or multi-phonon relaxation from the 4S3/2 state.4,9 In macroscopic samples, e.g. single crystals, the multi-phonon relaxation is negligible at room temperature for the β-NaGdF4 host lattice due to its low effective phonon energy. Therefore, the red emission is indicative of impurities or lattice defects, which introduce acceptor modes of high-energy, depopulate the 4S3/2 state, and strongly reduce the UC emission in total. The major enhancement of the UC luminescence from sample EG11 to IL4 is the result of a significant reduction of defects and acceptor modes due to an anhydrous synthesis and the absence of ligands with OH groups.
A further significant increase of the UC emission is achieved by growing an undoped β-NaGdF4 shell around the β-NaGdF4:18% Yb3+,2% Er3+ core, see the blue trace in Fig. 6 for sample CS_IL4. The shell saturates any partial coordination at the core surface and separates the particle surface from the optically active core. This approach reduces losses by multi-phonon relaxation via high energy vibration modes of ligand molecules and surface defects.
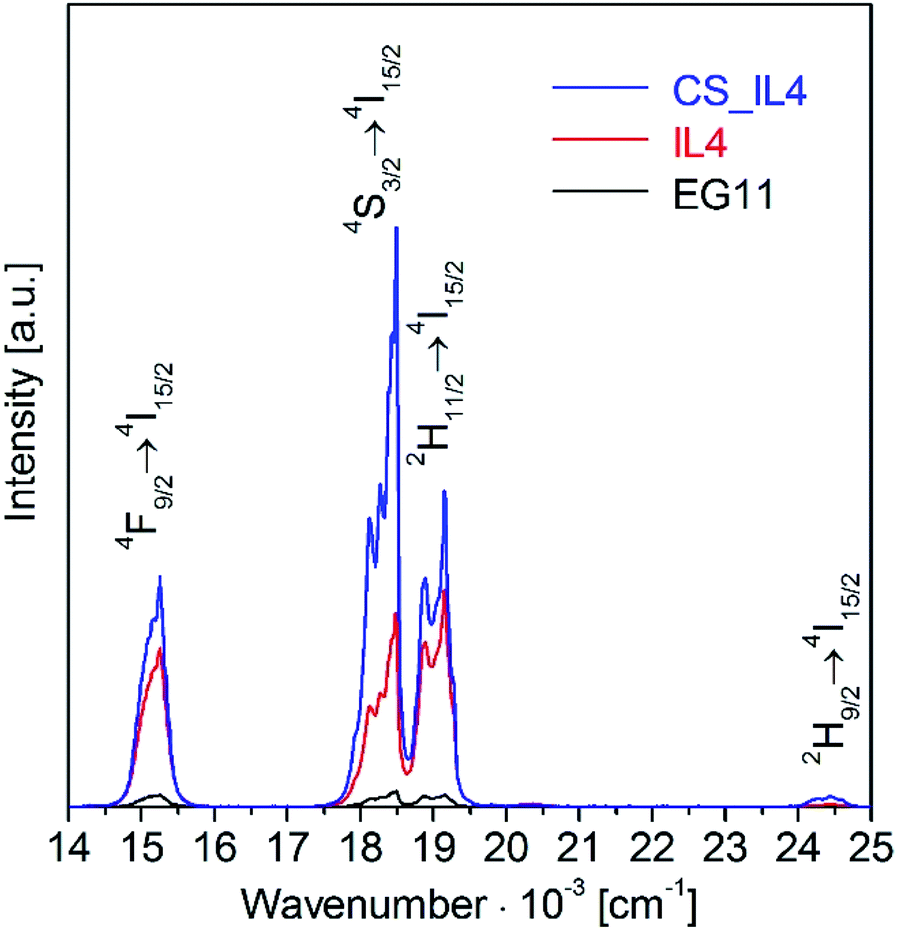
The UC luminescence from IL4 and CS_IL4 nanoparticles is further compared to μm-size β-NaYF4: 20% Yb3+, 2% Er3+ bulk material,9 see Fig. 8. The samples were excited at 970 nm by only 70 mW (unfocused) laser power. Despite a low excitation density of 2.6 W cm−2, see Fig. S9 and Table S1 (ESI†) for excitation density calculation, the nanoparticle samples (red and blue traces) show a well detectable UC emission with a spectral distribution close to the bulk material (black trace). The spectra of the nanoparticle samples are scaled by a factor ×500 in Fig. 8. The UC luminescence from the core (IL4) and core–shell nanoparticles (CS_IL4) are 0.067 (4)% and 0.122 (5)% of the bulk material. The green-to-red intensity ratio is 1.80 for the bulk vs. 1.66 and 1.52 for the core–shell and core nanomaterials, respectively. The slight decrease of the green-to-red intensity ratio along this series is due to increasing multi-phonon relaxation losses. These results are very good for sub 20 nm particles and compare well with literature.
 | ||
| Fig. 8 Upconversion luminescence spectra of μm-size β-NaYF4: 20% Yb3+, 2% Er3+ bulk material7 (black trace) compared to core (IL4, red trace) and core–shell (CS_IL4, blue trace) nanoparticles. The sample names refer to Table 1. The UC luminescence was excited at 970 nm with 70 mW (unfocused) laser power. | ||
A synthesis of <6 nm β-NaGdF4:30% Yb3+,2% Er3+ core–shell particles in oleic acid and octadecene at 240 °C for 20 min was reported by Liu et al.26 The UC luminescence of these particles was excited at 10 W cm−2 5.5 nm β-NaYF4:Yb3+, Er3+ particles from an oleic acid, oleylamine, and octadecene solution at 310 °C for 30 min were reported by Ostrowski et al.24 Their UC spectra were excited by 1 W. 5–20 nm β-NaYF4: Yb3+, Ln3+ (Ln = Er, Tm or Ho) particles were obtained from a synthesis in trioctylphosphine oxide (TOPO),25 which allows higher reaction temperatures of 330 °C to 370 °C. Samples were synthesized within 30 to 90 min without impurities of the α-phase. 11 nm particles were excited by a focused laser with 1 W power. 8–10 nm β-NaYF4: Yb3+, Er3+ particles were synthesized in oleylamine at 330 °C for 1 hour by Boyer et al.21 They reported quantum yields of 3% and 0.005% for bulk (≫100 nm) and 8–10 nm particles for 20 W cm−2 and 150 W cm−2 excitation density, respectively. The UC luminescence intensity of our nanoparticles, see Fig. 8, was achieved by 70 mW unfocused excitation power, corresponding to a power density of 2.6 W cm−2. This value is more than an order of magnitude lower than most literature values cited above. Incomplete information on the excitation conditions often hampers a direct comparison of UC emission intensities from the literature. Due to the non-linearity of UC processes the measurement of absolute quantum yields and a comparison between different excitation densities is inherently difficult.56,57 We restrict our study to a relative comparison of nanoparticles with bulk material, whose high quality was demonstrated in previous studies.7,56
4. Conclusions
The synthesis under anhydrous conditions in the ionic liquid DADMA NTf2 is a promising path to β-NaGdF4:18% Yb3+,2% Er3+ nanoparticles. A microwave reactor allows for efficient heating and short reaction times. Anhydrous conditions and appropriate solvents are essential for the synthesis of highly luminescent upconversion material. These conditions limit non-radiative losses due to defects and high energy acceptor modes of ligand vibrations. Another critical factor is the architecture of the nanoparticles. Core–shell particles show a more intense luminescence compared to the bare core particles. The growth of an isostructural undoped shell saturates coordination environments at the core surface and separates the core from the particle surface. Sub 20 nm core–shell nanoparticles were obtained in two reaction steps without intermediate separation. Very low excitation power was required to excite the upconversion luminescence, which renders these nanoparticles attractive for biological imaging. We proved that the proposed synthesis provides an effective route to minimize the presence of OH-defects, which have been demonstrated to represent the main source of luminescence quenching in fluorides. We believe that further optimization of this microwave-assisted synthesis will yield even more efficient and monodisperse nanomaterials, providing a fast and easily scalable synthesis route to brighter fluoride upconversion nanoparticles.Conflicts of interest
There are no conflicts to declare.Acknowledgements
The financial support from the European Community's Seventh Framework Program (FP7/2007-2013) under Grant No. 316906 (ITN LUMINET) is gratefully acknowledged by all authors. The authors thank the Microscopy Imaging Centre (MIC) at the University of Bern for access to TEM instruments.Notes and references
- S. Heer, K. Kömpe, H. U. Güdel and M. Haase, Adv. Mater., 2004, 16, 2102–2105 CrossRef CAS.
- A. Aebischer, S. Heer, D. Biner, K. W. Krämer, M. Haase and H. U. Güdel, Chem. Phys. Lett., 2005, 407, 124–128 CrossRef CAS.
- K. W. Krämer, J. Lumin., 2017, 189, 78–83 CrossRef.
- F. Auzel, Chem. Rev., 2004, 104(1), 139–174 CrossRef CAS.
- T. Kano, H. Yamamoto and Y. Otomo, J. Electrochem. Soc., 1972, 119, 1561 CrossRef CAS.
- N. Menyuk, K. Dwight and J. W. Pierce, Appl. Phys. Lett., 1972, 21, 159 CrossRef CAS.
- K. W. Krämer, D. Biner, G. Frei, H. U. Güdel, M. P. Hehlen and S. R. Lüthi, Chem. Mater., 2004, 16, 1244–1251 CrossRef.
- A. Aebischer, M. Hostettler, J. Hauser, K. W. Krämer, T. Weber, H. U. Güdel and H. B. Bürgi, Angew. Chem., Int. Ed., 2006, 45, 2802–2806 CrossRef CAS.
- R. B. Anderson, S. J. Smith, P. S. May and M. T. Berry, J. Phys. Chem. Lett., 2014, 5, 36–42 CrossRef CAS.
- M. T. Berry and P. S. May, J. Phys. Chem. A, 2015, 119, 9805–9811 CrossRef CAS.
- J. C. Boyer, F. Vetrone, L. A. Cuccia and J. A. Capobianco, J. Am. Chem. Soc., 2006, 128(23), 7444–7445 CrossRef CAS.
- J. Cichos, L. Marciniak, D. Hreniak, W. Strek and M. Karbowiak, J. Mater. Chem. C, 2014, 2, 8244–8251 RSC.
- M. Haase and H. Schäfer, Angew. Chem., Int. Ed., 2011, 50, 5808–5829 CrossRef CAS PubMed.
- H.-X. Mai, Y.-W. Zhang, R. Si, Z. G. Yan, L. Sun, L.-P. You and C.-H. Yan, J. Am. Chem. Soc., 2006, 128(19), 6426–6436 CrossRef CAS.
- J. Zhou, Z. Liu and F. Li, Chem. Soc. Rev., 2012, 41, 1323–1349 RSC.
- C. Li, Z. Hou, Y. Dai, D. Yang, Z. Cheng, P. Ma and J. Lin, Biomater. Sci., 2013, 1, 213–223 RSC.
- J. Lee, T. S. Lee, J. Ryu, S. Hong, M. Kang, K. Im, J. H. Kang, S. M. Lim, S. Park and R. Song, J. Nucl. Med., 2013, 54, 96–103 CrossRef CAS.
- S. Cui, H. Chen, H. Zhu, J. Tian, X. Chi, Z. Qian, S. Achilefu and Y. Gu, J. Mater. Chem., 2012, 22, 4861–4873 RSC.
- Y. Hu, B. Wu, Q. Jin, X. Wang, Y. Li, Y. Sun, J. Huo and X. Zhao, Talanta, 2016, 152, 504–512 CrossRef CAS PubMed.
- F. Wang, D. Banerjee, Y. Liu, X. Chen and X. Liu, Analyst, 2010, 135, 1839–1854 RSC.
- J.-C. Boyer and F. C. J. M. van Veggel, Nanoscale, 2010, 2, 1417–1419 RSC.
- N. J. J. Johnson, W. Oakden, G. J. Stanisz, R. S. Prosser and F. C. J. M. van Veggel, Chem. Mater., 2011, 23, 3714–3722 CrossRef CAS.
- Q. Liu, Y. Sun, T. Yang, W. Feng, C. Li and F. Li, J. Am. Chem. Soc., 2011, 133, 17122–17125 CrossRef CAS.
- A. D. Ostrowski, E. M. Chan, D. J. Gargas, E. M. Katz, G. Han, P. J. Schuck, D. J. Milliron and B. E. Cohen, ACS Nano, 2012, 6(3), 2686–2692 CrossRef CAS.
- J. Shan, X. Qin, N. Yao and Y. Ju, Nanotechnology, 2007, 18, 445607 CrossRef.
- J. Liu, G. Chen, S. Hao and C. Yang, Nanoscale, 2017, 9, 91–98 RSC.
- S. Wilhelm, M. Kaiser, C. Würth, J. Heiland, C. Carrillo-Carrion, V. Muhr, O. S. Wolfbeis, W. J. Parak, U. Resch-Genger and T. Hirsch, Nanoscale, 2014, 7, 1403–1410 RSC.
- N. J. Johnson, N. M. Sangeetha, J. C. Boyer and F. C. J. M. van Veggel, Nanoscale, 2010, 2, 771–777 RSC.
- Q. Ju, P. S. Campbell and A.-V. Mudring, J. Mater. Chem. B, 2013, 1, 179–185 RSC.
- Q. Ju and A.-V. Mudring, RSC Adv., 2013, 3, 8172–8175 RSC.
- R. Arppe, I. Hyppänen, N. Perälä, R. Peltomaa, M. Kaiser, C. Würth, S. Christ, U. Resch-Genger, M. Schäferling and T. Soukka, Nanoscale, 2015, 7, 11746–11757 RSC.
- D. J. Gargas, E. M. Chan, A. D. Ostrowski, S. Aloni, M. Virginia, P. Altoe, E. S. Barnard, B. Sanii, J. J. Urban, D. J. Milliron, B. E. Cohen and P. J. Schuck, Nat. Nanotechnol., 2014, 9, 300–305 CrossRef CAS.
- G. Yi and G. Chow, Chem. Mater., 2007, 19, 341–343 CrossRef CAS.
- C. Gabriel, S. Gabriel, E. H. Grant, E. H. Grant, B. S. J. Halstead and D. M. P. Mingos, Chem. Soc. Rev., 1998, 27, 213–224 RSC.
- R. Martínez-Palou, Mol. Diversity, 2010, 14, 3–25 CrossRef.
- J. Hoffmann, M. Nüchter, B. Ondruschka and P. Wasserscheid, Green Chem., 2003, 5, 296–299 RSC.
- D. Wang, L. Ren, X. Zhou, X. Wang, J. Zhou, Y. Han and N. Kang, Nanotechnology, 2012, 23, 225705 CrossRef.
- C. Chen, L.-D. Sun, Z.-X. Li, L.-L. Li, J. Zhang, Y.-W. Zhang and C.-H. Yan, Langmuir, 2010, 26, 8797–8803 CrossRef CAS PubMed.
- N. Niu, F. He, S. Gai, C. Li, X. Zhang, S. Huang, P. Yang, F. P. Wang, J. Lin, D. Zhao and Y. Zhao, J. Mater. Chem., 2012, 22, 21613–21623 RSC.
- C. Mi, Z. Tian, C. Cao, Z. Wang, C. Mao and S. Xu, Langmuir, 2011, 27, 14632–14637 CrossRef CAS.
- C. Lorbeer, J. Cybinska and A.-V. Mudring, Chem. Commun., 2010, 46, 571–573 RSC.
- C. Lorbeer, J. Cybinska and A.-V. Mudring, J. Mater. Chem. C, 2014, 2, 1862 RSC.
- C. Lorbeer and A.-V. Mudring, Chem. Commun., 2014, 50, 13282–13284 RSC.
- Q. Ju and A.-V. Mudring, RSC Adv., 2013, 3, 8172 RSC.
- V. Jovanovski, R. Marcilla and D. Mecerreyes, Macromol. Rapid Commun., 2010, 31, 1646–1651 CrossRef CAS.
- E. I. Izgorodina, M. Forsyth and D. R. MacFarlane, Phys. Chem. Chem. Phys., 2009, 11, 2452 RSC.
- T. Singh and A. Kumar, J. Phys. Chem. B, 2008, 112, 12968–12972 CrossRef CAS PubMed.
- J. G. Huddleston, A. E. Visser, W. M. Reichert, H. D. Willauer, G. A. Broker, R. D. Rogers, R. L. Vaughn, J. S. Wilkes and J. L. Williams, Green Chem., 2001, 3, 156–164 RSC.
- M. J. Earle, C. M. Gordon, N. V. Plechkova, K. R. Seddon and T. Welton, Anal. Chem., 2007, 79, 758–764 CrossRef CAS.
- E. Ejder, J. Opt. Soc. Am., 1969, 59, 223–224 CrossRef CAS.
- D. M. Roy and R. Roy, J. Electrochem. Soc., 1964, 111(4), 421–429 CrossRef CAS.
- J. H. Burns, Inorg. Chem., 1965, 4, 881–886 CrossRef CAS.
- R. Thoma, H. Insley and G. Hebert, Inorg. Chem., 1966, 1005, 1222–1229 CrossRef.
- G. Tessitore, A.-V. Mudring and K. W. Krämer, J. Lumin., 2017, 189, 91–98 CrossRef CAS.
- G. Tessitore, A.-V. Mudring and K. W. Krämer, New J. Chem., 2018, 42(1), 237–245 RSC.
- S. Fischer, B. Fröhlich, H. Steinkemper, K. W. Krämer and J. C. Goldschmidt, Sol. Energy Mater. Sol. Cells, 2014, 122, 197–207 CrossRef CAS.
- S. Fischer, B. Fröhlich, K. W. Krämer and J. C. Goldschmidt, J. Phys. Chem. C, 2014, 118, 30106–30114 CrossRef CAS.
Footnote |
| † Electronic supplementary information (ESI) available: Thermogravimetric analyses and XRD patterns of rare earth acetates, XRD patterns and UC luminescence spectra, power density of the laser diode. See DOI: 10.1039/c9ra05950d |
| This journal is © The Royal Society of Chemistry 2019 |