
 Open Access Article
 This Open Access Article is licensed under a Creative Commons Attribution-Non Commercial 3.0 Unported Licence
Exploring the water/oil/water interface of phospholipid stabilized double emulsions by micro-focusing synchrotron SAXS
Ilaria Clemente ab,
Kristian Torbensen†
c,
Emanuela Di Colad,
Federico Rossie,
Sandra Ristori*b and
Ali Abou-Hassan*c
ab,
Kristian Torbensen†
c,
Emanuela Di Colad,
Federico Rossie,
Sandra Ristori*b and
Ali Abou-Hassan*c
aDepartment of Biotechnology, Chemistry and Pharmacy, University of Siena, 53100, Siena, Italy
bDepartment of Chemistry Ugo Schiff & CSGI, University of Florence, 50019, Sesto Fiorentino, Italy. E-mail: ristori@unifi.it
cSorbonne Université, CNRS, Physico-chimie des Electrolytes et Nanosystèmes InterfaciauX, F-75005 Paris, France. E-mail: ali-abou_hassan@sorbonne-universite.fr
dDepartment of Medical Biotechnology and Translational Medicine (Biometra), Università degli Studi di Milano, 20090, Segrate, MI, Italy
eDepartment of Earth, Environmental and Physical Sciences, DEEP Sciences, University of Siena, Pian dei Mantellini 44, 53100 Siena, Italy
First published on 17th October 2019
Abstract
Surfactant stabilized water/oil/water (w/o/w) double emulsions have received much attention in the last years motivated by their wide applications. Among double emulsions, those stabilized by phospholipids present special interest for their imitation of artificial cells, allowing the study of the effect of confining chemical reactions in biomimetic environments. Upon evaporation of the oil shell, phospholipid stabilized double emulsions can also serve as templates for giant vesicles. In this context, general assumptions have been made on the self-assembly and structural organization/arrangement of amphiphilic molecules, at the aqueous/oil liquid interface. However, to the best of our knowledge, no detailed evidence of the interfacial structuring have been reported. In this paper, w/o/w double emulsions formulated using the phospholipid 1,2-dimyristoyl-sn-glycero-3-phosphocholine (DMPC) and a mixture of chloroform and cyclohexane as the oil phase were produced using a microfluidic device. To obtain information on the phospholipid arrangement, the w/o/w interface was investigated by spatially resolved micro-focusing SAXS. We observed that (i) the basic units forming both the w/o and o/w interfaces were oil-swollen DMPC bilayers, arranged into a substantially disordered shell of ∼45 μm thickness surrounding the internal oil phase; (ii) the evaporation process was slow, i.e. in the order of one hour at 50 °C and (iii) oil evaporation led to a shrinkage of the interfacial shell, but not to an increase of the ordering of the lipid bilayers. Interestingly, no stacked DMPC bilayers were observed during the evaporation process, as shown by the absence of Bragg's peaks in the SAXS intensity profiles.
Introduction
Complex biological systems such as living cells have been the subject of research for more than a century, resulting in a profound understanding of transport phenomena and metabolism. These systems often exhibit nonlinear responses to external and internal stimuli; thus, the handling of living cells has led to the search for simpler and more manageable models. For this purpose, liposomes, giant unilamellar vesicles (GUVs), water-in-oil (w/o) and water-in-oil-in water (w/o/w) double emulsions (DEs) with interfacial boundary layers composed of self-assembled amphiphiles have proven invaluable tools to mimic cellular systems, allowing the investigation of the compartmentalization effect.1 In particular, phospholipids2,3 constitute an important class of molecules to build membrane models, and have been extensively used in the study of signal transduction and transport phenomena.4 Moreover, soft self-organized structures not only serve as synthetic models to mimic biological cells,5 but also play a key role for developing carriers in drug delivery6–8 or serve as encapsulating agents in the food industry.1–3,9 Such versatile applications have motivated researchers to develop different methodologies for controlling their architecture. Traditionally, GUVs and layered emulsions are formed by hydration of dry lipid films or directly in bulk solution, followed by extrusion.10,11 However, these methods often fail to provide scaling-up, monodispersity and reproducibility. Techniques such as pulsed jet flow12,13 and microfluidics have been enabling the scale-up formation of uniform lipid systems.4 In particular, excellent procedures have been developed using microfluidics for templating liposomes from w/o/w DEs, allowing artificial cells to be constructed with an increasing control over size, architecture, etc. Likewise, encapsulation of active principles or chemical reactions to be carried out in confined environments has been obtained in this manner.14–16 As such, the w/o/w DE drops constitute both a template for liposome production, and can serve as a fairly good model for studying cell–cell communication.17,18 It was proposed that by controlling the thickness of the oil film in the double emulsion drops, the final lamellar properties of vesicles can be tuned, leading to the formation of uni- or multilamellar shells or shells comprised of aggregated material.18–21 From a molecular point of view, though it is established that in dispersed systems amphiphiles are mainly localized at the interface between polar and nonpolar domains, the detailed representation of their arrangement is a difficult task, especially when the interfacial region extends over lengths that are hundreds of times larger than the molecular size.5 High-resolution techniques, such as small angle scattering, are valuable tools for probing the organization of amphiphiles at the o/w interface of emulsions6–9 and can be used to unravel the interfacial structure.In this context, we have recently undertaken a systematic study of the effect of compartmentalization on chemical communication among diffusively coupled chemical oscillators.22,23 In particular, by taking advantage of microfluidic techniques, and in a multi-scale interfacial approach, the effect of the compartment organization (GUVs, w/o and w/o/w emulsions) on the global network dynamics (in-phase and anti-phase oscillations, pulse transmission, etc.) has been assessed.22,24–26 In this perspective, we herein studied w/o/w DEs as microreactors formulated with a known chemical composition which was investigated previously in the chemical communication context24 in order to get in-depth information on the interfacial lipid structures including during solvent evaporation, as this fundamentally impacts the chemical communication.17,27,28 DEs with two different oil thicknesses were first generated using a microfluidic device. Next, the w/o/w interface was investigated during the oil evaporation process with micro-focusing SAXS in order to reach structural information on the phospholipid arrangement during the oil evaporation process.
Experimental
Materials and methods
![[thin space (1/6-em)]](https://www.rsc.org/images/entities/char_2009.gif) :1). The boiling points of cyclohexane and chloroform are 81.0 °C and 61.2 °C, respectively. The microfluidic device was operated at 20 °C, thus maintaining the DMPC in the gel state. The outer phase was an aqueous solution containing 2% (wt/wt) PVA and was injected into the 1.25/1.0 mm square tube engulfing both the cylindrical tubes at a volumetric flow rates of Q3 = 25 μL min−1. In this sequence, a w/o emulsion is formed first, which is subsequently embedded in the aqueous phase flowing in the square tube, forming the w/o/w emulsion. To change the thickness of the oil shell, the distance between the orifices of the two cylindrical tubes was varied. All volumetric flows were controlled using syringe pumps (KD Scientific). The PVA serves both to increase the viscosity for enhanced flow focusing and to increase the stability of double emulsions. The obtained DEs were collected in quartz capillary tubes with an inner diameter of 300 μm, and a wall thickness of 10 μm. These tubes were sealed at both ends with paraffin wax, as to reproduce the experimental setup employed for experiments on diffusively coupled chemical oscillators.22
:1). The boiling points of cyclohexane and chloroform are 81.0 °C and 61.2 °C, respectively. The microfluidic device was operated at 20 °C, thus maintaining the DMPC in the gel state. The outer phase was an aqueous solution containing 2% (wt/wt) PVA and was injected into the 1.25/1.0 mm square tube engulfing both the cylindrical tubes at a volumetric flow rates of Q3 = 25 μL min−1. In this sequence, a w/o emulsion is formed first, which is subsequently embedded in the aqueous phase flowing in the square tube, forming the w/o/w emulsion. To change the thickness of the oil shell, the distance between the orifices of the two cylindrical tubes was varied. All volumetric flows were controlled using syringe pumps (KD Scientific). The PVA serves both to increase the viscosity for enhanced flow focusing and to increase the stability of double emulsions. The obtained DEs were collected in quartz capillary tubes with an inner diameter of 300 μm, and a wall thickness of 10 μm. These tubes were sealed at both ends with paraffin wax, as to reproduce the experimental setup employed for experiments on diffusively coupled chemical oscillators.22
| Preparation conditions | Oil thickness (μm) | Sample name |
|---|---|---|
| Kept at room temperature before irradiation | 44 | DE1;44 |
| Heated at 50 °C for 30 minutes before irradiation | 24 | DE1;24 |
| Heated at 50 °C for 60 minutes before irradiation | 20 | DE1;20 |
| Kept at room temperature before irradiation | 57 | DE2;57 |
| Heated at 50 °C for 120 min before irradiation | 54 | DE2;54 |
| Heated at 50 °C for 240 min before irradiation | 50 | DE2;50 |
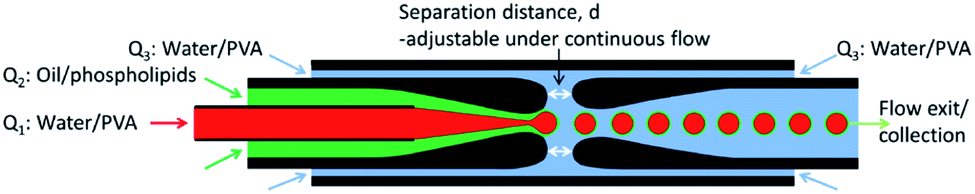 | ||
| Scheme 1 Asset of the microfluidic device used in this work. | ||
Results and discussion
The w/o/w DEs
Optical images of the double emulsions (DE1 and DE2) obtained in the microfluidic device and transferred in the glass capillary are shown in Fig. 1 at RT and after heating. The middle oil phase of the DEs can be easily identified as a darker region, due to its higher refractive index with respect to the aqueous core and bulk phase. Panel 1A shows sample DE1 kept at room temperature after preparation, while panel 1B and 1C show the same sample (DE1) stored at 50 °C for 30 and 60 minutes, respectively. At close look, these optical images confirmed that a decrease in the outer diameter took place with increasing heating time.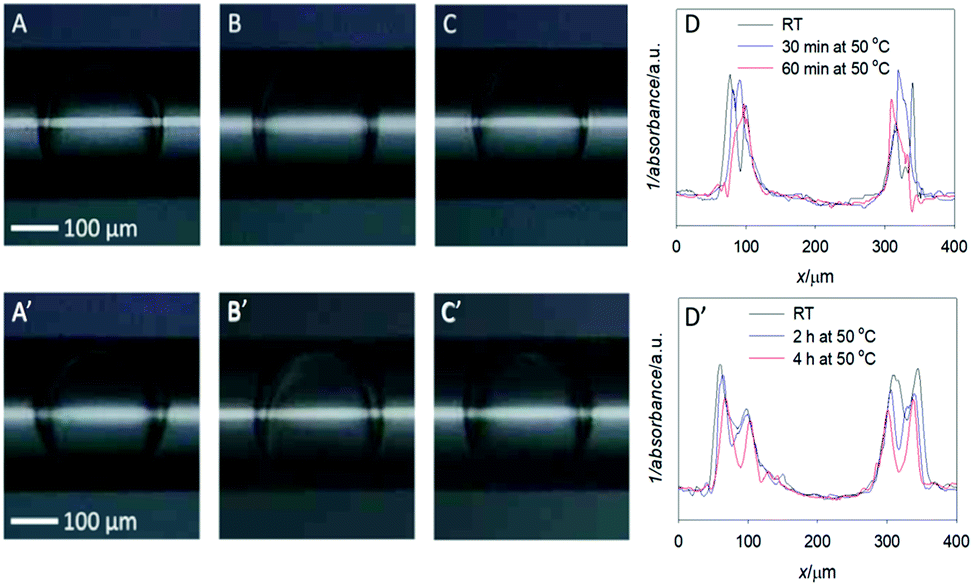 | ||
| Fig. 1 Optical images of the w/o/w double emulsions studied in this paper: DE1 (A) taken at the exit of the microfluidic device (RT), (B) after storage at 50 °C for 30 min and (C) 50 °C for 60 min, (D) plot profile scans obtained from the optical images (A), (B) and (C) of DE1. DE2 (A′) as obtained at the exit of the microfluidic device (RT), (B′) after storage at 50 °C for 120 min and (C′) 50 °C for 240 min, (D′) plot profile scans obtained from the optical images (A′), (B′) and (C′) of DE2. | ||
The scan plot profiles, displayed in Fig. 1D, obtained by using the ImageJ software, clearly evidenced this trend. In addition, it showed that the width of the core size was practically constant, thus indicating that oil evaporation mainly occurs in the surrounding aqueous phase.
From the cross sections, the outer and inner diameter of the oil phase could be estimated, and the thickness and volume of the oil phase were calculated by simple geometry:
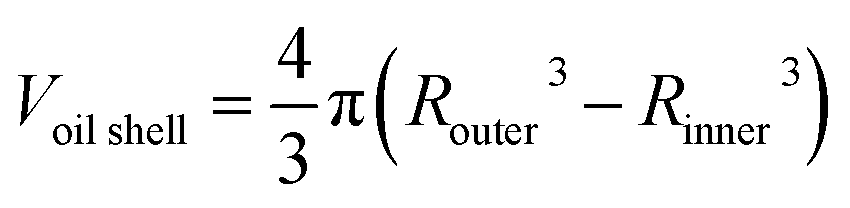
The values obtained for heated samples showed a decrease in the oil shell thickness for DE1 from 44 μm at RT to 24 μm and 20 μm after heating to 50 °C for 30 and 60 minutes respectively, corresponding to a decrease in volume of the shell thickness of 20% and 29% relative to the sample stored at RT. Considering that the vapor pressure and the boiling point of chloroform are substantially lower than those of cyclohexane, for simplicity, we assumed that the evaporated solvent was only chloroform. Thus, a 29% decrease in the oil shell volume was equivalent to a loss of 29 volume percentage chloroform. An original content of 33.3% implies that the residual chloroform in the oil phase was approximately 4% after heating the sample at 50 °C for 60 minutes. Concerning DE2 (Fig. 1, panels A′–D′), the samples heated at 50 °C during 120 and 240 minutes showed a decrease in the oil thickness from 57 μm (RT), to 54 and 50 μm respectively, corresponding to a decrease in volume of 12% and 20%, respectively, relative to the sample stored at RT. Assuming, as previously, that all the evaporated solvent was chloroform, the corresponding residual chloroform in the oil phase was approximately 13% after heating the sample to 50 °C for 240 minutes.
μ-SAXS of DE
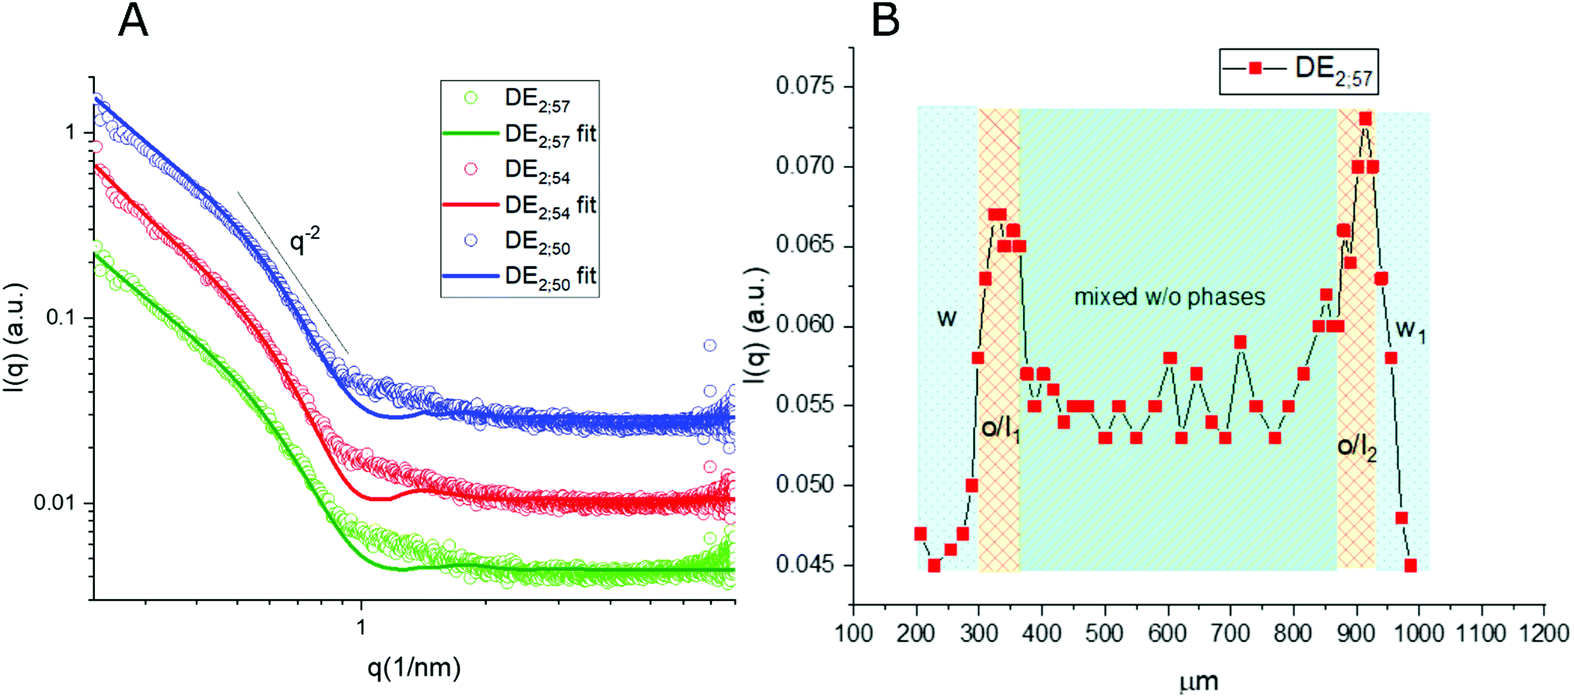
Thanks to the capability of the SAXS apparatus used in this work, the self-assembly properties of DMPC could be investigated by scanning with focused X-ray each of the three phases of the w/o/w systems, i.e. external water, intermediate hydrophobic layer and internal water. The one-dimensional intensity plot (I(q) vs. q) showed that some structuring occurred in the oil/DMPC, which was evidenced by a large excess scattering. The intensity decay was consistent with the SAXS pattern of bilayers, as also reported in a previous study on w/o simple emulsions.9 The change of slope at 0.74 nm−1 (Fig. 2, green curve) corresponded to the first minimum in the form factor of flat objects extending over large distances. However, while in the case of simple emulsions a true minimum was observed, in agreement with the presence of well-defined bilayers, here the minimum was broadened by local roughness and polydispersity in thickness (see the Table 2 for fitting results), suggesting disorder in the organization at higher level. For samples heated at 50 °C during 30 and 60 minutes the minimum position was shifted toward larger q (q = 0.85 nm−1 and q = 0.88 nm−1, respectively), meaning that the bilayers thickness shrunk when heated due to solvent removal.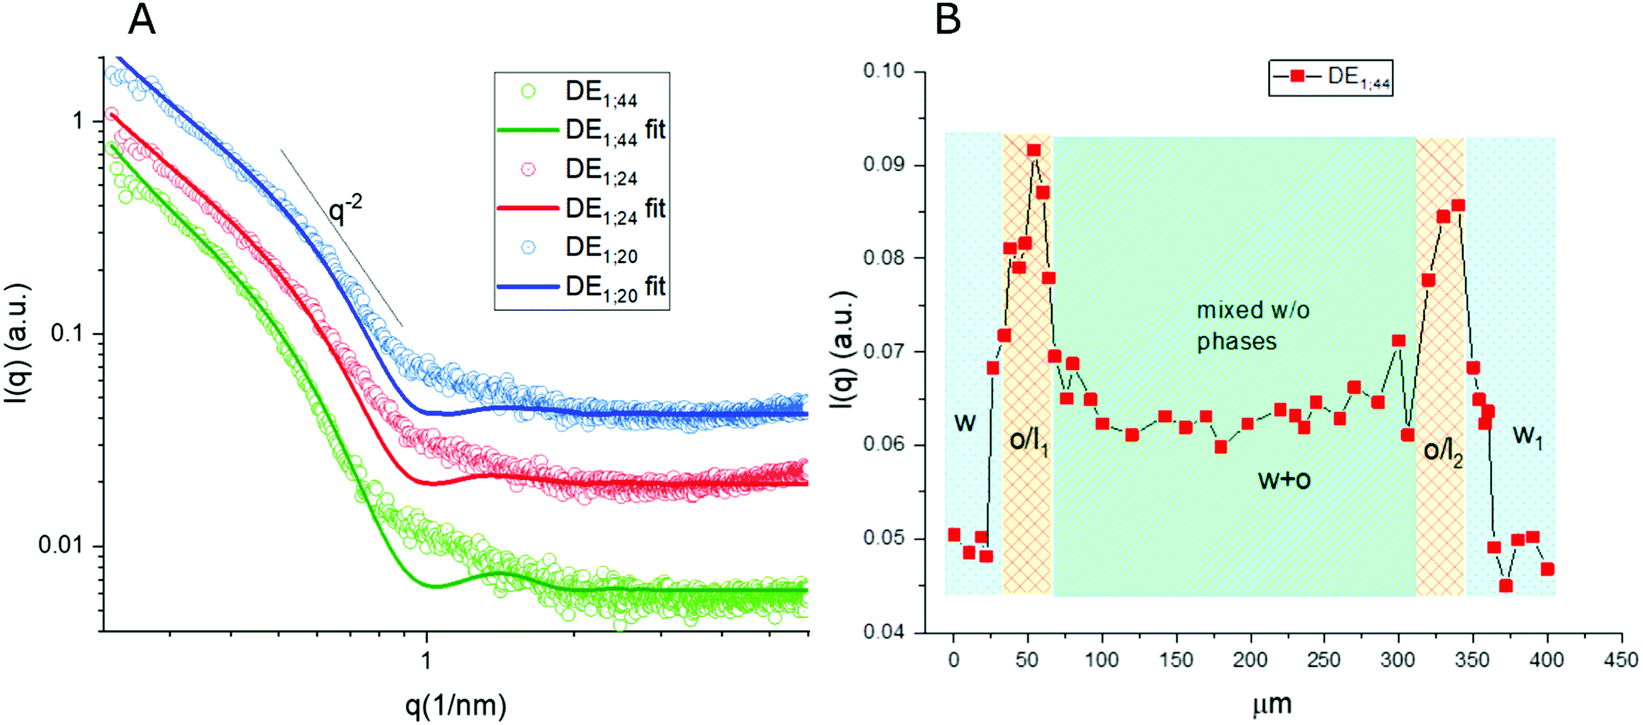 | ||
| Fig. 2 (A) 1D μ-SAXS profile of the w/o/w double emulsion (DE1) interface as obtained at the exit of the microfluidic device (RT; green), after storage at 50 °C for 30 min (red) and for 60 min (blue) respectively, (B) SAXS intensity at q = 0.74 nm−1 recorded along an axial line covering a whole DE1 double emulsion unit. This q value was chosen to minimize the contribution of single bilayers to the overall scattering intensity. | ||
| Sample | Single tail thickness (Å) | Head thickness (Å) | SLD head (Å−2) | SLD tails (Å−2) | Tail polydispersity (lognormal distribution) |
|---|---|---|---|---|---|
| DE1;44 | 25.0 ± 0.7 | 5.9 ± 0.4 | 12 ± 1 | 3.6 ± 0.4 | 1.6 ± 0.2 |
| DE1;24 | 25.0 ± 0.5 | 6.0 ± 0.6 | 11.0 ± 0.5 | 4.0 ± 0.3 | 1.6 ± 0.1 |
| DE1;20 | 25.0 ± 0.5 | 5.7 ± 0.4 | 11.0 ± 0.5 | 4.0 ± 0.3 | 1.6 ± 0.1 |
| DE2;57 | 21.5 ± 0.5 | 5.0 ± 0.3 | 11.0 ± 0.2 | 4.0 ± 0.5 | 1.4 ± 0.3 |
| DE2;54 | 21.5 ± 0.4 | 5.0 ± 0.4 | 11.0 ± 0.2 | 4.0 ± 0.5 | 1.4 ± 0.3 |
| DE2;50 | 21.5 ± 0.4 | 5.0 ± 0.4 | 11.0 ± 0.2 | 4.0 ± 0.5 | 1.4 ± 0.3 |
Noticeably, in these systems the heating process didn't induce bilayer stacking within the DMPC/oil domain but rather enhanced de-structuring. A contribution to disorder in the bilayer could also originate from partial mixing with PVA, which might have acted as a structural breaker if it diffused from the aqueous phase toward the adjacent amphiphilic layer. To correlate optical images with structural data, one-dimensional intensity diagrams along a single DE were plotted as a function of the horizontal scan (Fig. 2B), using the intensity values at a chosen wave vector (q = 0.74 nm−1).
In agreement with optical cross sections shown in Fig. 1, the peaks of SAXS intensity were localized in the oil/lipid layers (o/l) and the lowest intensity was found in the external aqueous phases (w). Nevertheless, SAXS data indicated that the internal water/PVA phase had an intermediate intensity, caused by diffusing molecules from the interface and forming a mixed aqueous/oil domain (w + o). Similar considerations could be applied to micro-SAXS plots of DE2 samples either stored at RT or heated at 50 °C for 120 and 240 min (Fig. 3).
 | ||
| Fig. 3 (A) 1D μ-SAXS profile of the w/o/w double emulsion (DE2) interface as obtained at the exit of the microfluidic device (RT; green), after storage at 50 °C for 120 min (red) and for 240 min (blue) respectively, (B) SAXS intensity at q = 0.9 nm−1 recorded along an axial line covering a whole DE2 double emulsion unit. | ||
These intensity profiles still corresponded to the form factor of loosely inter-correlated and polydisperse bilayers, as in the case of the DE1 samples. However, the diagrams of the DE2 didn't show any appreciable difference between RT and heated samples, meaning that samples prepared with a thicker oil layer possessed an external shell which was more resistant to evaporation. Unfortunately, the DE2 samples were also prone to a marked mixing of the layers, which caused extended destructuring. Indeed, smaller differences in intensity could be observed in the scans along the capillary with respect to the DE1 samples. The only visible features were the presence of excess scattering and the broad minimum at 0.9 nm−1, i.e. at lower q values than for the DE1 samples, indicating that even if the oil shell was thicker, the single bilayers were less swollen. The fitting of the SAXS diagrams of the DE1 samples (Fig. 2A) shown as solid lines superimposed to the corresponding experimental profiles confirmed the presence of polydisperse bilayers with a typical q−2 decay of locally flat object, and total bilayer thickness of about 60 Å. For the fitting of the DE2 samples (Fig. 3A), the same model was used obtaining a total bilayer thickness of about 55 Å, confirming the presence of less swollen bilayers. The results of the fittings for DE1 and DE2 are summarized in Table 2.
In both DE1 and DE2 systems there was a localized region of scattering intensity that could not be fitted using the polydisperse lamellar model (SASView package). Therefore, a certain level of correlation was assumed. To account for this hypothesis, a Gaussian peak (Fig. 4, dashed line) centered at 0.9 nm−1 could be considered in addition to the form factor of uncorrelated bilayers, as the signature of a loose organization occurring at intermediate distances. It could also be evidenced that some residual intensity was present in the internal water/PVA phase (w1 and w2). As it is well-known, SAXS is extremely sensitive to the presence of molecules, or groups with high electron density and can be used to monitor the variations of chemical composition in the environment probed by the beam.30,31 Indeed, due to partial mixing, molecules able to provide contrast and produce scattering could penetrate the boundary layer and, as a consequence, such region appeared less dark than expected for a pure isotropic phase with low SAXS intensity. This was in perfect agreement with the increased background intensity observed in the profile shown in Fig. 2 and 3 and discussed above. Such insights from 1D data were supported by the two-dimensional diagrams (Fig. 5), where pixels given from the 2D scattering collected on the detector are reported. The observed patterns evidenced that the systems have no orientational anisotropy, which could possibly be induced by the glass walls. Moreover, the meshes obtained by subsequent recording of 2D patterns at 0.1 s per frame interval showed the presence of a film at the oil/DMPC interface, appearing as the brightest region (o/l in Fig. 5), in contrast with the internal and external water/PVA phases (w1 and w2), which appear darker due to lower scattering intensity in these regions.
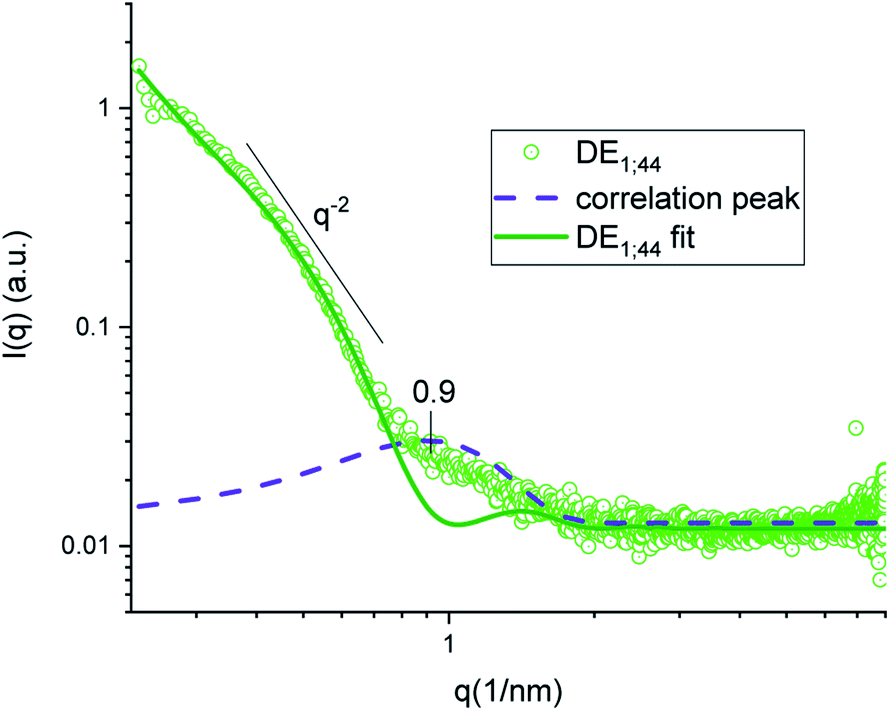 | ||
| Fig. 4 SAXS intensity of sample DE1 stored at room temperature fitted by a polydisperse bilayer model (green), with Gaussian peak (violet) superposition to account for inter-bilayer correlation. | ||
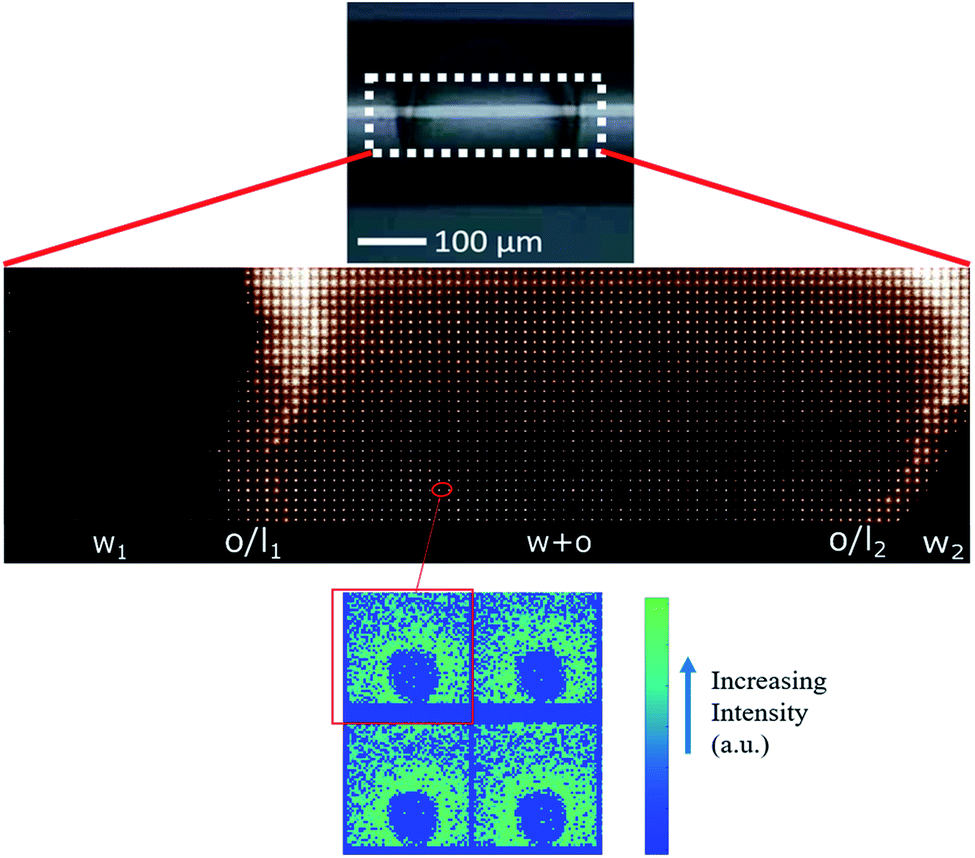 | ||
| Fig. 5 Upper panel: two-dimensional intensity mesh of a typical DE1 sample stored at room temperature showing the water/PVA mixture which constitutes the internal (w1) and external (w2) phases, both interfaces (oil/l), and the oil shell named w + o because of partial mixing (see text for further details). In this image the signals of glass capillary and water have been subtracted. Lower panel: typical 2D patterns of the detector in blue-to-green intensity scale expressed in arbitrary units. | ||
Conclusions
Liquid–liquid confined microdroplets stabilized by lipids are complex systems with wide scientific and applicative potential. Even though many techniques have been developed to control their formation, there is still some uncertainty about the fine molecular arrangement of self-assembling amphiphiles at the interface during such process. In this work the compartmentalization of organic and aqueous domains into soft matter microstructures was achieved by fabricating w/o/w double emulsions with precisely controlled geometry and size. The boundary layers were formed by phospholipids (DMPC), which self-assembled from a solution of organic volatile solvents, i.e. a mixture of cyclohexane/chloroform 2:1 v/v. An ad hoc engineered microfluidic platform coupled to a microfocus-SAXS apparatus allowed to obtain information on the internal structure of each compartment and the extent of molecular transmigration between adjacent micro-phases. In particular, solvent evaporation and its effects on the lipid arrangement were investigated by spatially resolved SAXS. This analysis revealed that the basic units of the phospholipid domains at the w/o interface were oil-swollen DMPC bilayers, which were arranged into a substantially disordered shell of ∼45 μm thickness surrounding the internal oil phase. Upon heating at 50 °C for 30 and 60 minutes, a large fraction of the initial solvent volume was removed, and the thickness of the lipid boundary was reduced to 20–25 μm. Concurrently, the single bilayers shrunk by about 20% of their initial thickness and the interbilayer correlation slightly increased. However, the heating process did not induce stacking of DMPC bilayers, evidenced by the absence of Bragg's peaks in the SAXS intensity profiles of the heated samples. A further interesting finding was that the thickness of the boundary layer was able to modulate oil evaporation, since the solvent removal was more pronounced in samples with lower interfacial thickness. We think that, in the chemical communication context, the arrangement of the phospholipids at the liquid/liquid interfaces and in the oil shell, its evolution with time upon solvent evaporation as well as the mixing observed in the water phase (as revealed by micro-focusing SAXS) should be taken into account as they may play an relevant role in the partition and transfer of chemical species between double emulsions compartments, thus influencing the dynamics of the system.
Conflicts of interest
There are no conflicts to declare.Acknowledgements
Thanks are due to the European Synchrotron Radiation Facility (ESRF, Grenoble) for beam-time allocation and the staff of the ID13 beamline for valuable technical assistance. We also wish to thank Michael Sztucki for his guidance in treating 2D SAXS patterns. K. T. and A. A.-H. acknowledge funding from ED 388 Chimie Physique et Chimie Analytique de Paris Centre.Notes and references
- C. Washington, Adv. Drug Delivery Rev., 1996, 20, 131–145 CrossRef CAS
.
- P. Van Hoogeves and A. Wendel, Eur. J. Lipid Sci. Technol., 2014, 116, 1088–1107 CrossRef
- J. V. L. Henry, P. J. Fryer, W. J. Frith and I. T. Norton, Food Hydrocolloids, 2010, 24, 66–71 CrossRef CAS
- L. Shang, Y. Cheng and Y. Zhao, Chem. Rev., 2017, 117, 7964–8040 CrossRef CAS
- R. Pichot, R. L. Watson and I. T. Norton, Int. J. Mol. Sci., 2013, 14, 11767–11794 CrossRef
- N. Koifman, M. Schnabel-Lubovsky and Y. Talmon, J. Phys. Chem. B, 2013, 117, 9558–9567 CrossRef CAS
- L.-L. Pontani, M. F. Haase, I. Raczkowska and J. Brujic, Soft Matter, 2013, 9, 7150–7157 RSC
- R. Liuzzi, S. Gallier, S. Ringler, S. Caserta and S. Guido, RSC Adv., 2016, 6, 109960–109968 RSC
- E. Di Cola, K. Torbensen, I. Clemente, F. Rossi, S. Ristori and A. Abou-Hassan, Langmuir, 2017, 33, 9100–9105 CrossRef CAS
- M. J. Hope, M. B. Bally, G. Webb and P. R. Cullis, Biochim. Biophys. Acta, Biomembr., 1985, 812, 55–65 CrossRef CAS
- A. Darszon, C. A. Vandenberg, M. Schönfeld, M. H. Ellisman, N. C. Spitzer and M. Montal, Proc. Natl. Acad. Sci. U. S. A., 1980, 77, 239–243 CrossRef CAS
- K. Funakoshi, H. Suzuki and S. Takeuchi, J. Am. Chem. Soc., 2007, 129, 12608–12609 CrossRef CAS
- J. C. Stachowiak, D. L. Richmond, T. H. Li, F. Brochard-Wyart and D. A. Fletcher, Lab Chip, 2009, 9, 2003–2009 RSC
- T. M. Allen and P. R. Cullis, Adv. Drug Delivery Rev., 2013, 65, 36–48 CrossRef CAS
- B. Herranz-Blanco, L. R. Arriaga, E. Makila, A. Correia, N. Shrestha, S. Mirza, D. A. Weitz, J. Salonen, J. Hirvonen and H. A. Santos, Lab Chip, 2014, 14, 1083–1086 RSC
- F. Kong, X. Zhang and M. Hai, Langmuir, 2014, 30, 3905–3912 CrossRef CAS
- H. C. Shum, D. Lee, I. Yoon, T. Kodger and D. A. Weitz, Langmuir, 2008, 24, 7651–7653 CrossRef CAS
- T. Foster, K. D. Dorfman and H. Ted Davis, J. Colloid Interface Sci., 2010, 351, 140–150 CrossRef CAS
- L. R. Arriaga, S. S. Datta, S.-H. Kim, E. Amstad, T. E. Kodger, F. Monroy and D. A. Weitz, Small, 2014, 10, 950–956 CrossRef CAS
- G. M. Whitesides and B. Grzybowski, Science, 2002, 295, 2418–2421 CrossRef CAS
- K. Nishimura, H. Suzuki, T. Toyota and T. Yomo, J. Colloid Interface Sci., 2012, 376, 119–125 CrossRef CAS
- K. Torbensen, F. Rossi, S. Ristori and A. Abou-Hassan, Lab Chip, 2017, 17, 1179–1189 RSC
- F. Rossi, K. Torbensen, S. Ristori and A. Abou-Hassan, in Artificial Life and Evolutionary Computation, Springer, Cham, 2018, vol. 830, pp. 16–31, DOI:10.1007/978-3-319-78658-2_2
- K. Torbensen, S. Ristori, F. Rossi and A. Abou-Hassan, J. Phys. Chem. C, 2017, 121, 13256–13264 CrossRef CAS
- K. Torbensen, F. Rossi, O. L. Pantani, S. Ristori and A. Abou-Hassan, J. Phys. Chem. B, 2015, 119, 10224–10230 CrossRef CAS
- F. Rossi, A. Zenati, S. Ristori, J.-M. Noel, V. Cabuil, F. Kanoufi and A. Abou-Hassan, International Journal of Unconventional Computing, 2015, 11, 23–26 Search PubMed
- L. R. Arriaga, S. S. Datta, S. H. Kim, E. Amstad, T. E. Kodger, F. Monroy and D. A. Weitz, Small, 2014, 10, 950–956 CrossRef CAS
- A. S. Utada, E. Lorenceau, D. R. Link, P. D. Kaplan, H. A. Stone and D. A. Weitz, Science, 2005, 308, 537–541 CrossRef CAS
- K. Torbensen and A. Abou-Hassan, J. Flow Chem., 2015, 5, 234–240 CrossRef CAS
- O. Glatter, Scattering Methods and their Application in Colloid and Interface Science Elsevier, 2018 Search PubMed
- A. Angelova, B. Angelov, V. M. Garamus, P. Couvreur and S. Lesieur, J. Phys. Chem. Lett., 2012, 3, 445–457 CrossRef CAS
Footnote |
| † Current address: Laboratoire d'Electrochimie Moléculaire, Université Paris Diderot, France. |
| This journal is © The Royal Society of Chemistry 2019 |