DOI:
10.1039/C9RA05881H
(Paper)
RSC Adv., 2019,
9, 34761-34771
Multidimensional insights involving electrochemical and in silico investigation into the corrosion inhibition of newly synthesized pyrazolotriazole derivatives on carbon steel in a HCl solution†
Received
29th July 2019
, Accepted 14th October 2019
First published on 29th October 2019
Abstract
Herein, the anti-corrosion of carbon steel in 1 M HCl by two newly synthesized pyrazolotriazole derivatives, namely, 6-methyl-1H-pyrazolo[5,1-c][1,2,4]triazole-7-carbonitrile (CPT) and 1-acetyl-6-methyl-1H-pyrazolo[5,1-c][1,2,4]triazole-7-carbothioamide (MPT), was studied using electrochemical, density functional theory (DFT), and molecular dynamics (MD) simulation techniques. The experimental results showed that the concentrations of inhibitors had a significant influence on their inhibition efficiencies. Potentiodynamic polarization curves indicated that the two pyrazolotriazoles were mixed-type inhibitors. DFT calculations were employed to explore the molecular activity, and MD simulations were performed to obtain the interaction energy between the inhibitor molecules and the iron surface. The findings obtained using the theoretical calculation techniques were consistent with those obtained via experiments.
1. Introduction
Nowadays, hydrochloric acid solutions are being widely applied in industrial fields such as acid pickling, industrial cleaning, acid descaling, oil-well acidizing and petrochemical processes. In these applications, the service metals (usually carbon steel) can be subjected to different degrees of processing;1 in this regard, the use of an organic corrosion inhibitor is the most important and economical approach among all anticorrosive methods.2–4 Majority of researchers believe that inhibitors protect metals from corrosion by forming a film on the metal substrate.5–7 Their inhibition effectiveness is generally related to their chemical composition, molecular volume, water solubility, heat stability, and affinity to the metal substrate.8 Polar functional groups, heteroatoms, such as O, N, S, and P atoms, and π-electrons act as adsorption centers during metal–inhibitor interactions. We have theoretically confirmed an empirical rule that the general trend of the inhibition efficiencies of molecules containing heteroatoms is O < N < S.9
As is well-known, the corrosion inhibition properties of organic molecules depend on their molecular activity. These molecular descriptors can be obtained from quantum chemical approaches, which have been widely used to explore the reaction mechanism.10,11 Generally, the design and application of inhibitors with larger molecular sizes is an effective strategy to ensure their corrosion inhibition efficiency, which may provide a better surface coverage.12 Some researchers have studied the inhibition mechanism of organic inhibitors through DFT calculations, and some linear or nonlinear models based on multiple regressions have been successfully established to probe the relationship between quantum chemical descriptors and inhibition efficiency.13–15 On the other hand, molecular dynamics simulation is a valid approach to obtain information about the interaction between the metal substrate and inhibitor molecules.16 Pyrazolotriazole is a heterocyclic aromatic organic compound with a bicyclic structure consisting of fused pyrazole and triazole rings. Some studies have demonstrated that pyrazolotriazole derivatives are safe and nontoxic to humans or the environment, and thus, they can be used as antimicrobial agents or PDE4 inhibitors.17,18 In addition, many researches have indicated that triazole derivatives can serve as excellent inhibitors for metal corrosion in an acidic medium.19–21 Thus, pyrazolotriazoles with large volumes can be theoretically used in metal corrosion and protection applications.
The purpose of this study was to investigate the inhibition effect of two newly synthesized pyrazolotriazoles on the corrosion of carbon steel in a molar hydrochloric acid solution. Electrochemical tests were carried out, and the anticorrosive mechanism was clarified. Moreover, the effects of temperature and inhibitor concentration on the inhibition performance were investigated. In addition, detailed DFT calculations and MD simulations were conducted to corroborate the experimental observation. The results presented in this study would benefit the development of novel inhibitors with a better efficacy for carbon steel in an acid solution through rational molecular preconstruction.
2. Materials and methods
2.1. Synthesis of pyrazolotriazole derivatives
Typically, 1 g of 6-methyl-7H-[1,2,4]triazolo[4,3-b][1,2,4]triazepine-8(9H)-thione was heated in 10 ml acetic anhydride for 1 h. The solution was then concentrated to dryness under reduced pressure, and the residue obtained was extracted with dichloromethane. After concentrating the solution under vacuum, the obtained solid was subjected to chromatography using a silica column (eluent: dichloromethane/methanol: 95/5 v/v). We separated the two products MPT and CPT, and their relevant structural information is presented in Table 1 and Fig. S1–S4 (ESI†).
Table 1 Some information about the newly synthesized pyrazolotriazole derivatives
| Inhibitor |
Structure |
Abbreviation |
Molar mass (g mol−1) |
| 6-Methyl-1H-pyrazolo[5,1-c][1,2,4]triazole-7-carbonitrile |
 |
CPT |
147.14 |
| 1-Acetyl-6-methyl-1H-pyrazolo[5,1-c][1,2,4]triazole-7-carbothioamide |
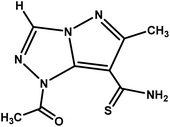 |
MPT |
223.25 |
MPT. Off-white solid, yield: 18%; mp: 202–204 °C. 1H NMR (300 MHz, DMSO) δ ppm: 9.34 (s, 1H, CHtriazolic); 2.59 (s, 3H, CH3); 2.40 (s, 3H, CH3). 13C NMR (75 MHz, DMSO) δ ppm: 167.77, 161.78, 143.57, 113.44, 73.40 (Cq); 133.23 (CH) 21.23, 13.92 (CH3). Elemental analysis: calculated: C, 43.04%; H, 4.06%; N, 31.37%; O, 7.17%; and S, 14.36%. Found: C, 43.13%; H, 4.01%; N, 31.29%; O, 7.18%; and S, 14.39%.
CPT. White solid, yield: 20%; mp: 188–190 °C. 1H NMR (300 MHz, DMSO) δ 9.06 (s, 1H, CHtriazolic); 2.34 (s, 3H, CH3)·13C NMR (75 MHz, DMSO) δ ppm: 160.91, 147.43, 114.84, 64.48 (Cq); 130.78 (CH); 13.98 (CH3). Elemental analysis: calculated: C, 48.98%; H, 3.43%; and N, 47.60%. Found: C, 48.97%; H, 3.44%; and N, 47.59%.To validate that the synthesized inhibitors were environmentally non-toxic, the toxicities of CPT and MPT were evaluated using the TOPKAT module of the Discovery studio 3.0 software.22 The obtained probability values indicated that the toxic levels of both inhibitors were in a safe area (see ESI† for more details on the toxicity data).
2.2. Preparation of test solutions and electrodes
The corrosion tests were performed in a 1 M HCl solution in the absence and presence of pyrazolotriazole derivatives at various concentrations ranging from 10−6 M to 10−3 M. The corrosive solution was prepared by diluting HCl (analytical grade 37%) with distilled water. Carbon steel was used, which was subjected to metallographic preparation with the following nominal composition: 0.36 wt% C, 0.66 wt% Mn, 0.27 wt% Si, 0.02 wt% S, 0.015 wt% P, 0.21 wt% Cr, 0.02 wt% Mo, 0.22 wt% Cu, 0.06 wt% Al and the rest iron. Before each experiment, the electrodes were successively abraded with sand papers of different grades followed by washing with ethanol and distilled water. The effect of temperature on the inhibition efficiencies of the inhibitors was tested between 303 and 333 K.
2.3. Electrochemical measurements
Electrochemical impedance spectroscopy (EIS) and potentiodynamic polarization (PDP) measurements were carried out using an EG&G Princeton Applied Research Parc Model 2273. A three-electrode electrolytic cell was employed with carbon steel as the working electrode, platinum foil as the counter electrode, and saturated calomel as the reference electrode. The tested area of the electrodes exposed to the solution was 1 cm2. The carbon steel electrode was immersed in the corrosive solution for an appropriate time until a steady-state potential was achieved. EIS measurements were performed by applying a 10 mV sine wave with frequencies in the range of 100 kHz to 10 mHz to the cell. The polarization curves were obtained by polarization at the scan rate of 0.167 mV s−1. The data obtained by the PDP methods were analyzed and fitted using the Ec-Lab analysis software, and the impedance results were fitted using the Zview impedance analysis software.
2.4. DFT calculations
Initially, the ground states of the synthesized pyrazolotriazoles derivatives were optimized using the state-of-art DFT method, for which the famous hybrid functional B3LYP was used via the Dmol3 code in the Materials Studio software.23 The minima of the optimized structures of the tilted compounds were confirmed by frequency calculations at the same level of theory (i.e., the absence of imaginary frequencies). The effects of the solvent molecules were implicitly taken into account by considering the conductor-like screening model.24 In the defined model, the solute was embedded into a cavity surrounded by solvent molecules, which were described by the dielectric constant ε (e.g., for water, ε = 78.3). Then, the relevant quantum chemical parameters were obtained.
2.5. Molecular dynamics simulation
An MD simulation was conducted using the Forcite module of the Materials Studio 8.0 program developed by BIOVIA Inc. The simulation was carried out in a simulation box (1.98 nm × 1.98 nm × 4.81 nm) with periodic boundary conditions to model a representative part of the interface devoid of any arbitrary boundary effects. The box consisted of an iron slab and a water slab (with 500 water molecules) containing the studied inhibitor. For the iron surface, an Fe(110) surface has been selected as the studied surface because Fe(110) has a density packed surface and is most stable.25 The Fe(110) surface was modeled with a six-layer slab model. In this model, there were 64 iron atoms in each layer representing an (8 × 8) unit cell. The entire system was performed at 303 K, controlled by an Andersen thermostat, NVT ensemble, with a time step of 1.0 fs and a simulation time of 1000 ps using the COMPASS force field.26 Non-bonding interactions, i.e. van der Waals and electrostatic interactions, were set for the atom-based and Ewald summation method, respectively, with the cut off radius of 1.55 nm.
3. Results and discussion
3.1. PDP measurements
Potentiodynamic polarization curves for carbon steel in a 1 M HCl solution without and with pyrazolotriazoles at different concentrations at 303 K are presented in Fig. 1. As observed from Fig. 1, the nature of the polarization curves did not change with and without inhibitors; however, the curves shifted towards lower current density after the addition of inhibitors; this suggested that the inhibitor molecules inhibited the corrosion process. The values of corrosion current densities (Icorr) were determined by the extrapolation of the cathodic and anodic Tafel lines to the corrosion potential (Ecorr). The electrochemical parameters, including the Ecorr, Icorr, anodic Tafel slope (βa), cathodic Tafel slope (βc), and percentage inhibition efficiency (IE%), are presented in Table 2. The inhibition efficiencies were evaluated using the following equation:| |
 | (1) |
where Icorr and Icorr,0 denote the corrosion current densities with and without inhibitors, respectively.
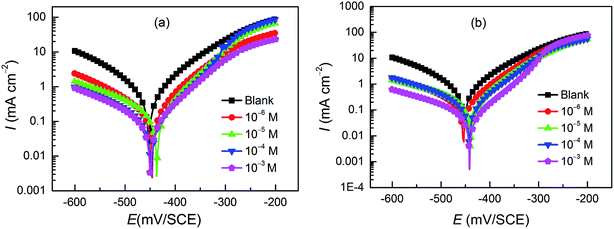 |
| | Fig. 1 Potentiodynamic polarization curves for carbon steel in the absence and presence of (a) CPT and (b) MPT at different concentrations. | |
Table 2 Tafel polarization parameters for carbon steel in a 1 M HCl solution in the absence of inhibitors and at different concentration of the tested inhibitors at 303 K
| Inhibitor |
C (M) |
Ecorr (mV per SCE) |
Icorr (μA cm−2) |
βa (mV dec−1) |
−βc (mV dec−1) |
IE (%) |
| Blank |
1 |
−452.1 |
660.8 |
95.3 |
113 |
— |
| CPT |
10−6 |
−445.9 |
128.9 |
64.4 |
99 |
80.4 |
| 10−5 |
−436.7 |
104.2 |
59.7 |
103.7 |
84.2 |
| 10−4 |
−447.2 |
72.3 |
69.6 |
104.6 |
89.0 |
| 10−3 |
−449.6 |
68.4 |
72.8 |
109.7 |
89.6 |
| MPT |
10−6 |
−454.0 |
130.0 |
63.7 |
105.9 |
80.3 |
| 10−5 |
−439.3 |
117.8 |
62.4 |
109.8 |
82.1 |
| 10−4 |
−442.1 |
103.8 |
66.7 |
97.8 |
84.2 |
| 10−3 |
−441.4 |
42.8 |
67.3 |
99.7 |
93.5 |
The results presented in Table 2 revealed that an increase in the concentration of both derivatives resulted in a decrease in the corrosion current densities and an increase in the inhibition efficiency, suggesting that the adsorption of the inhibitor molecules on the surface of carbon steel blocked the active sites. Particularly, it is worth mentioning that the optimal inhibition efficiencies for the two compounds follow the order CPT < MPT, and the values are 89.6% and 93.5%, respectively. The presence of inhibitors caused a minor change in the Ecorr values (less than 85 mV) with respect to the case of the blank; this implied that both organics acted as mixed-type inhibitors.27 They not only would reduce the anodic dissolution of carbon steel, but would also retard the cathodic hydrogen evolution reaction. Moreover, it was obvious that the slopes of the anodic (βa) and cathodic (βc) Tafel lines remained almost unchanged upon the addition of the two compounds. This indicated that the inhibitors decreased the surface area for corrosion without affecting the corrosion mechanism of carbon steel in the HCl solutions.28 The inhibiting effect of the inhibitors may be related to their adsorption and the formation of a barrier film on the electrode surface.
3.2. EIS measurements
The EIS measurements were carried out to further evaluate the corrosion inhibition performance of these two new inhibitors. The impedance spectra for carbon steel in 1.0 M HCl with and without CPT and MPT at different concentrations at 303 K are presented as Nyquist plots in Fig. 2. The plots are denoted by a unitary capacitive loop in the form of depressed semicircles. A deviation of this kind is often referred to as frequency dispersion due to the surface inhomogeneity of the working electrode.29 It is clear from Fig. 2 that the impedance response of carbon steel has significantly changed after the addition of pyrazolotriazoles to the corrosive solution. The diameters of the capacitive loops increased with an increase in the inhibitor concentration. Generally, a large charge transfer resistance is associated with a slowly corroding system. It was worth noting that the change in the concentrations of inhibitors did not alter the shape of the impedance behavior; this implied a similar inhibition mechanism of the inhibitors.
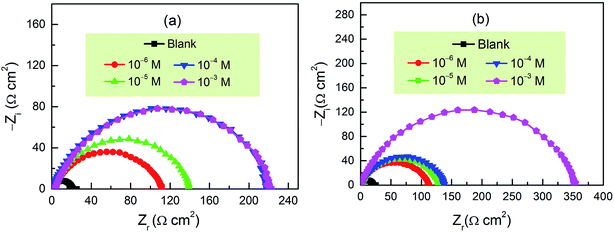 |
| | Fig. 2 Nyquist plots for carbon steel in 1 M HCl in the absence and presence of (a) CPT and (b) MPT at different concentration at 303 K. | |
Fig. 3 shows the equivalent circuit model for the analysis of the impedance characteristics. Herein, Rs represents the solution resistance and Rct is the charge transfer resistance corresponding to the corrosion reaction at the iron–solution interface. Considering that a double layer does not behave as an ideal capacitor in the presence of a dispersing effect, a constant phase element, CPE, is used to substitute the double layer capacitance (Cdl). Constant phase elements have been widely used to account for deviations brought about by surface roughness. The impedance of CPE is defined by the following equation:30
| |
 | (2) |
where
Y0 is a proportionality coefficient,
j is the imaginary unit, and
ω is the angular frequency. The value of
n represents the deviation from the ideal behavior and it lies between 0 and 1.
Cdl and the inhibition efficiency IE% were calculated by the following relations:
31| |
 | (4) |
where
Rct and
Rct,0 are the charge transfer resistance in the presence and absence of inhibitors, respectively. The corresponding impedance parameters are presented in
Table 3.
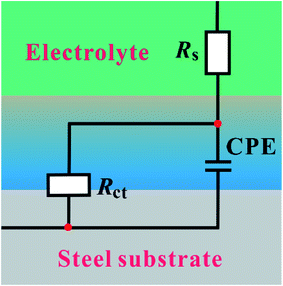 |
| | Fig. 3 Equivalent circuit used to fit the obtained Nyquist impedance spectra. | |
Table 3 EIS parameters obtained for carbon steel in a 1 M HCl solution in the absence of inhibitors and at different concentrations of the tested inhibitors at 303 K
| |
C (M) |
Rs (Ω cm2) |
Rct (Ω cm2) |
CPE |
Cdl (μF cm−2) |
IE (%) |
θ |
| Y0 (×10−4 Ω−1 cm−2 sn) |
n |
| Blank |
|
0.568 |
20.24 |
2.72 |
0.860 |
116.87 |
— |
— |
| CPT |
10−6 |
2.933 |
107.5 |
1.67 |
0.774 |
51.87 |
81.1 |
0.811 |
| 10−5 |
1.589 |
139.5 |
1.38 |
0.777 |
44.50 |
85.4 |
0.854 |
| 10−4 |
1.145 |
218.0 |
1.02 |
0.806 |
40.09 |
90.7 |
0.907 |
| 10−3 |
2.685 |
219.7 |
1.01 |
0.795 |
37.98 |
90.8 |
0.908 |
| MPT |
10−6 |
1.324 |
109.3 |
1.48 |
0.798 |
52.17 |
81.4 |
0.814 |
| 10−5 |
1.870 |
125.1 |
1.35 |
0.803 |
49.82 |
83.8 |
0.838 |
| 10−4 |
1.273 |
135.9 |
1.27 |
0.780 |
40.47 |
85.1 |
0.851 |
| 10−3 |
1.119 |
351.9 |
0.89 |
0.794 |
36.62 |
94.2 |
0.942 |
It is apparent from Table 3 that the Rct values of both the investigated pyrazolotriazole derivatives increase with an increase in the concentrations of the inhibitors, and MPT provides a better inhibition efficiency than CPT. However, the values of Cdl decrease with an increase in the inhibitor concentration. According to the Helmholtz model, Cdl can be expressed as the following relation:32
| |
 | (5) |
where
d is the thickness of the protective film,
ε is the local dielectric constant,
ε0 is the permittivity of air, and
A is the effective surface area of the electrode. Then, a decrease in the CPE can result from a decrease in the local dielectric constant and/or an increase in the thickness of the double layer, suggesting that the inhibitors inhibit the corrosion of carbon steel by adsorption at the iron/acid interface. Therefore, the change in the
Cdl values originated from the gradual displacement of the water molecules by the adsorption of the corrosion inhibitors on the iron surface, decreasing the extent of metal dissolution.
33 Overall, the corrosion inhibition performances obtained from the EIS measurements are in good agreement with those obtained from PDP.
3.3. Adsorption isotherm and thermodynamic parameters
The inhibition of the corrosion of metals by organic compounds can be explained by their adsorption isotherms. To evaluate the adsorption process of the investigated pyrazolotriazole derivatives on the carbon steel surface, several adsorption isotherms, such as Langmuir, Temkin, Freundlich and Frumkin isotherms, were tested. Finally, the results indicated that the Langmuir adsorption isotherm could provide the most accurate description of the adsorption behavior. The Langmuir adsorption isotherms can be expressed by the following relation:34| |
 | (6) |
where Kads is the equilibrium constant of the adsorption process, C is the corrosion inhibitor concentration in the solution, and θ is the surface coverage (from Table 3). Fig. 4 shows the plots of C/θ vs. C, which appear as straight lines for both inhibitors. The linear regression coefficients (R2) as well as all the slopes are close to one, confirming that the adsorption of pyrazolotriazole follows the Langmuir adsorption isotherm. The free energy of adsorption ΔG0ads can be calculated from the Kads value by the following correlation:35| |
ΔG0ads = −RT![[thin space (1/6-em)]](https://www.rsc.org/images/entities/char_2009.gif) ln(Kads × 55.5) ln(Kads × 55.5)
| (7) |
where 55.5 is the concentration of water, R is the universal gas constant and T is the absolute temperature. As can be observed from Fig. 4, the calculated ΔG0ads values for CPT and MPT are −37.5 and −31.2 kJ mol−1, respectively. These negative values suggested that the adsorption of both compounds on the carbon steel surface was a spontaneous process. It is generally accepted that the ΔG0ads values of −20 kJ mol−1 or less negative than this are associated with an electrostatic interaction between the charged molecules and the charged metal surface (physical adsorption), whereas those of −40 kJ mol−1 or more negative than this involve charge sharing or transfer between the inhibitor molecules and metals (chemical adsorption).36 However, the adsorption of inhibitors on the metal substrates cannot be considered as a purely physical or chemical behaviour. In addition to chemical adsorption, the inhibitor molecules can also be adsorbed on the metal surface via physical interactions. In this case, we can conclude that the adsorption of pyrazolotriazoles on iron substrates is a mixed type of chemical and physical adsorption, with the first process being predominant.
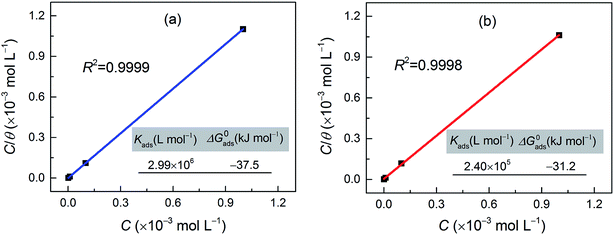 |
| | Fig. 4 Langmuir adsorption isotherms and relevant parameters for the investigated (a) CPT and (b) MPT inhibitors on the carbon steel surface at 303 K. | |
3.4. Effect of temperature
As shown in Fig. 5, the effect of temperature on the corrosion of carbon steel in 1 M HCl without and with the studied inhibitors at various concentrations was investigated between 303 K and 333 K using the PDP measurements. The deduced corrosion parameters such as Ecorr, Icorr, and the inhibition efficiency (IE%) are summarized in Table 4. It is clear that the corrosion rate increases with an increase in temperature under all circumstances. The corrosion rate of carbon steel in the absence of inhibitors increased steeply from 303 to 333 K, whereas the corrosion rate increased slowly in the presence of inhibitors. The inhibition efficiency decreased with an increase in temperature from 303 to 333 K. This type of behavior can be described on the basis that the increase in temperature leads to a shift in the equilibrium position of the adsorption/desorption phenomenon towards the desorption of the inhibitor molecules on the surface of the carbon steel.37
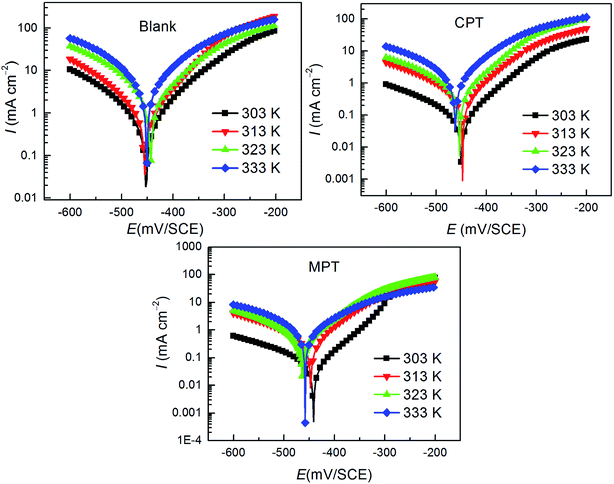 |
| | Fig. 5 Effect of temperature on the behavior of the carbon steel/HCl interface in uninhibited and inhibited solutions with 10−3 M of the inhibitors tested herein. | |
Table 4 The influence of temperature on the PDP parameters for carbon steel in 1 M HCl with and without the studied inhibitors in the temperature range of 303–333 K
| Inhibitor |
T (K) |
Ecorr (mV per SCE) |
Icorr (μA cm−2) |
βa (mV dec−1) |
−βc (mV dec−1) |
IE (%) |
θ |
| Blank |
303 |
−452.1 |
660.8 |
95.3 |
113 |
— |
— |
| 313 |
−454.4 |
865.5 |
79.1 |
95.4 |
— |
— |
| 323 |
−443.4 |
1529.8 |
88.7 |
79.3 |
— |
— |
| 333 |
−450.8 |
2898.3 |
82.8 |
82.9 |
— |
— |
| CPT |
303 |
−449.6 |
68.4 |
72.8 |
109.7 |
89.6 |
0.896 |
| 313 |
−447.4 |
253.7 |
71.6 |
94.6 |
70.6 |
0.706 |
| 323 |
−453.0 |
506.8 |
79.8 |
114.8 |
66.8 |
0.668 |
| 333 |
−461.2 |
1360.8 |
88.9 |
117.7 |
53.0 |
0.530 |
| MPT |
303 |
−441.4 |
42.8 |
67.3 |
99.7 |
93.5 |
0.935 |
| 313 |
−447.0 |
264.4 |
67.9 |
99.4 |
69.4 |
0.694 |
| 323 |
−463.1 |
485.8 |
85.5 |
117.2 |
68.2 |
0.682 |
| 333 |
−457.9 |
928.6 |
116.7 |
128.4 |
67.9 |
0.679 |
The effect of temperature on the corrosion current (Icorr) can be used to determine the activation thermodynamic parameters for the dissolution process following the Arrhenius and transition-state equations:38
| |
 | (8) |
| |
 | (9) |
where
Ea is the activation corrosion energy, Δ
Ha is the enthalpy, Δ
Sa is the entropy of activation,
T is the absolute temperature in Kelvin,
h is the Planck's constant,
N is Avogadro's number and
R is the molar gas constant. The plots of ln
![[thin space (1/6-em)]](https://www.rsc.org/images/entities/char_2009.gif) Icorr vs.
Icorr vs. 1/
T and ln(
Icorr/
T)
vs. 1/
T are shown in
Fig. 6. The
Ea values for carbon steel were determined from the slope of the ln
![[thin space (1/6-em)]](https://www.rsc.org/images/entities/char_2009.gif) Icorr vs.
Icorr vs.1/
T plots. Δ
Ha and Δ
Sa were calculated from the slope and intercept of the ln(
Icorr/
T)
vs.1/
T plots, respectively. The obtained corrosion kinetic parameters are listed in
Table 5.
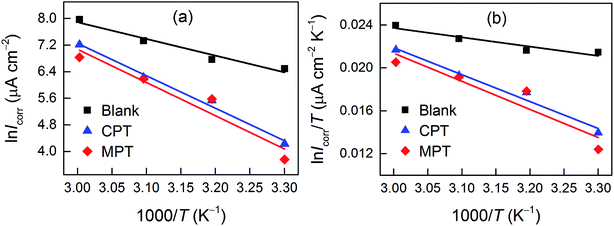 |
| | Fig. 6 (a) Arrhenius plots of ln![[thin space (1/6-em)]](https://www.rsc.org/images/entities/char_2009.gif) Icorr vs. 1/T and transition-state plots of ln(Icorr/T) vs. 1/T (b) for carbon steel in 1 M HCl containing 10−3 M CPT and MPT at various temperatures. Icorr vs. 1/T and transition-state plots of ln(Icorr/T) vs. 1/T (b) for carbon steel in 1 M HCl containing 10−3 M CPT and MPT at various temperatures. | |
Table 5 Corrosion kinetic parameters for carbon steel in 1 M HCl in the absence and presence of 10−3 M of tested inhibitors
| Inhibitor |
Ea (kJ mol−1) |
ΔHa (kJ mol−1) |
ΔSa (J mol−1 K−1) |
| Blank |
41.7 |
39.1 |
−62.8 |
| CPT |
81.1 |
80.5 |
56.3 |
| MPT |
83.4 |
76.1 |
40.2 |
As can be observed from Table 5, the values of Ea for the inhibitor-containing systems are higher than that for the uninhibited system; this indicates a decrease in the rate of dissolution of carbon steel due to an increase in the energy barrier for the dissolution reaction. The positive sign of ΔHa suggests that the dissolution of carbon steel is endothermic.39 The large negative value of ΔSa for carbon steel in 1 M HCl implies that the formation of the activated complex is the rate-determining step, rather than the dissociation step. In the presence of the inhibitors studied herein, the ΔSa value increased, indicating an increase in disorder as the reactants were converted to the activated complexes.40
3.5. DFT results
The DFT study was conducted to understand and explain the inhibitory effects of compounds in molecular terms. The HOMO and LUMO orbitals are useful for predicting adsorption centers in the interaction between the inhibitor and the metal surface. Efficient inhibitors donate electrons (a nucleophilic attack) to the d orbital of the metal and accept electrons from the metal surface (an electrophilic attack).41 The frontier molecular orbitals for the synthesized inhibitors in both the neutral and the protonated forms are displayed in Fig. 7. The HOMO orbitals are delocalized over the pyrazolotriazole moiety for CPT, whereas for MPT, the HOMO orbitals are mainly localized over the carbothioamide moiety. On the other hand, the LUMO orbital of CPT is delocalized over the triazole ring, similar to the case of the carbothioamide group for MPT. The electronic density delocalization of the HOMO and LUMO orbitals distinctly showed that the synthesized inhibitors might donate/accept the electrons of the atom sites in the triazol and pyrazolo moieties to/from the d-orbitals of the iron metal. This phenomenon is more pronounced for protonated inhibitors.
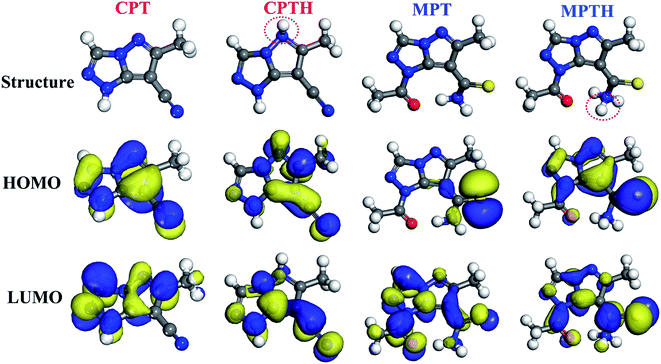 |
| | Fig. 7 Frontier molecular orbitals of the synthesized inhibitors in the neutral and protonated forms. | |
Using the Koopmans' theorem as an approximation,42 the ionization potential (I) and electron affinity (A) can be replaced by the highest occupied molecular orbital energy (EHOMO) and the lowest unoccupied molecular orbital energy (ELUMO), respectively. That is, I = −EHOMO and A = −ELUMO. The electronegativity (χ) and global hardness (η) are related to I and A:43
| |
 | (10) |
| |
 | (11) |
The fraction of electrons transferred from (to) the inhibitor molecules to (from) the metallic surface (ΔN) was calculated by44
| |
 | (12) |
For the iron surface, the work-function Φ is taken as its electronegativity, whereas the chemical hardness is neglected because η of the bulk metals is related to the inverse of their density of states at the Fermi level, which is an exceedingly small number.45 The relative quantum chemical descriptors are listed in Table 6. From the data, we can observe that MPT exhibits lower ΔE value and higher ΔN and dipole moment (μ) values, which theoretically confirm that it has a better corrosion inhibition performance.
Table 6 Some molecular properties of the tilted compounds calculated using DFT at the B3LYP level in an aqueous phase
| Inhibitor |
I (eV) |
A (eV) |
EHOMO (eV) |
ELUMO (eV) |
ΔE (eV) |
χ |
η |
ΔN |
μ (Debye) |
| CPT |
6.66 |
0.85 |
−6.66 |
−0.85 |
5.81 |
3.75 |
2.91 |
0.558 |
4.11 |
| CPTH |
7.85 |
2.11 |
−7.85 |
−2.11 |
5.74 |
4.98 |
2.87 |
0.351 |
7.64 |
| MPT |
6.26 |
1.92 |
−6.26 |
−1.92 |
4.34 |
4.09 |
2.17 |
0.671 |
5.51 |
| MPTH |
7.20 |
3.41 |
−7.20 |
−3.41 |
3.79 |
5.30 |
1.89 |
0.449 |
9.31 |
3.6. Molecular dynamics simulation
MD simulations were carried out to provide deep insights into the anticorrosive mechanism of the studied inhibitors, which helped us to better understand the inhibitor–iron interactions at the atomic and molecular level. The simulations were run until the system reached equilibrium and both the energy and temperature were balanced. The equilibrium configurations of CPT and MPT adsorbed on the Fe(110) surface are presented in Fig. 8. Moreover, we declare that the absorption behavior of the inhibitors in the protonated form has no obvious effect on their equilibrium configurations (see Fig. S5 in the ESI†); therefore, we have concentrated on the neutral results in the following discussions.
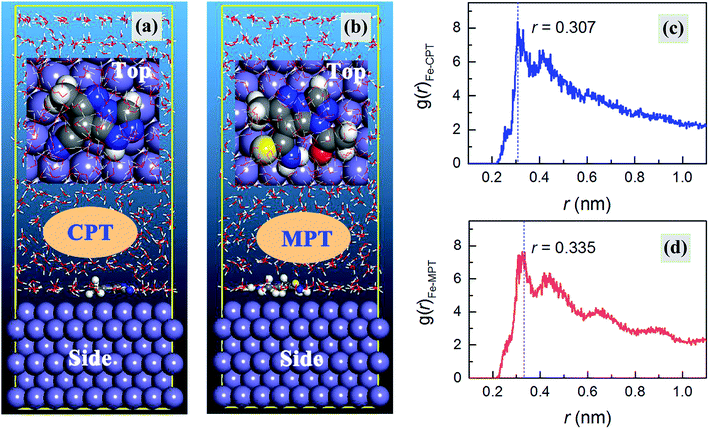 |
| | Fig. 8 (a and b) Equilibrium configurations and (c and d) radial distribution functions for the CPT and MPT molecules on an Fe(110) surface in the aqueous phase, respectively. | |
As shown in Fig. 8a and b, the inhibitor molecules were adsorbed on the Fe(110) surface in the parallel adsorption mode. Hence, it was reasonable that the nearly flat adsorption orientation was ascribed to the simultaneous interactions of the inhibitor molecules with the Fe(110) surface through the electron-rich groups as well as the aromatic rings. Compared with the case of vertical adsorption, the parallel adsorption configurations can distinctly cover more steel surface area and this leads to a better inhibition action.46
The strength of the corrosion inhibitors absorbed on the iron surface can be expressed by the adsorption energy (Eads), which has been calculated using the following equation:47
| | |
Eads = Etotal − (Esurf+water + Einh+water) + Ewater
| (13) |
where
Etotal is the total potential energy of the system, which includes the iron crystal, the adsorbed inhibitor molecule and the solution.
Esurf+water and
Einh+water are the potential energies of the system without the inhibitor and the system without the iron crystal, respectively.
Ewater is the potential energy of the water molecules.
The adsorption energies in the present study were calculated from the average adsorption energy of the obtained equilibrium configurations. The obtained Eads values are −335.2, −512.7, −348.9, and −523.4 kJ mol−1 for CPT, MPT, CPTH, and MPTH, respectively. The negative values indicate that spontaneous adsorption can be expected. It is generally accepted that a more negative value of Eads suggests a stronger adsorption strength between the inhibitor molecule and the metal substrate.48 Obviously, MPT has a better inhibition performance with a higher absolute value of Eads.
Finally, pair correlation functions for the super-molecular structures, g(r), were obtained. Generally, the peak in the g(r)–r curve within 0.35 nm was caused by chemical bonds, and the peak outside 0.35 nm was caused by the Coulomb and van der Waals interactions.49 As shown in Fig. 8c and d, the distance between CPT/MPT and the iron atoms of the Fe(110) face was 0.307/0.335 nm, less than 0.350 nm, which indicated that chemical bonds had formed between these two compounds and the iron atoms. Moreover, the countless decentralized peaks located outside 0.35 nm, which were derived from physical interactions, might also contribute to the net molecule surface attraction.
3.7. Mechanism of adsorption and inhibition
As illustrated in Fig. 9, a mechanism was proposed to explain the high corrosion inhibition performance of the studied inhibitors (abbreviated as Inh). The cathodic chemical process may occur as follows:50| | |
(FeH+)ads + e− → (FeH)ads
| (15) |
| | |
(FeH)ads + H+ + e− → Fe + H2
| (16) |
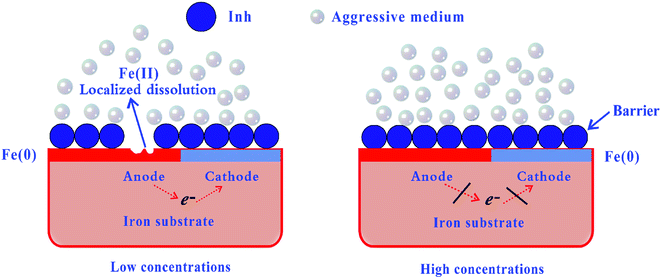 |
| | Fig. 9 Proposed mechanism for the adsorption of inhibitor molecules on the iron surface in an aggressive medium. | |
The corrosion inhibition can be attributed to the formation of an adsorbed layer of corrosion inhibitor molecules, i.e.
| | |
Fe(0) + Inh → Fe:Inh(ads)
| (17) |
where Fe:Inh
(ads) refers to inhibitor molecules adsorbed on the iron surface. We can find that at low inhibitor concentrations, localized corrosion can occur in the anode area, where the corresponding reaction is the dissolution of metallic iron (Fe
0) to ferrous cations (Fe
2+). However, a perfect organic film can be formed on the iron surface at high inhibitor concentrations, which can be regarded as a barrier to iron dissolution and hydrogen reduction. Several types of adsorption may take place in the inhibition phenomena involving the adsorption of the CPT/MPT molecules on the iron surface as follows: (i) a non-covalent interaction of the CPT/MPT (or protonated) molecules with iron atoms (physisorption); (ii) an interaction between the unshared electron pairs of the N/O/S atoms or the π-electrons of aromatic rings and the iron surface (chemisorption); and (iii) a combination of the abovementioned processes.
4. Conclusions
The abovementioned results show the excellent performance of the pyrazolotriazole derivatives MPT and CPT for the inhibition of carbon steel corrosion in 1 M HCl. The higher efficiency of MPT when compared with that of CPT was due to the presence of a sulfur atom in MPT. The inhibition efficiency increased with the increasing inhibitor concentration. The quantum chemical calculation results revealed that the electron-rich groups as well as the aromatic rings were active sites via which the inhibitors adsorbed onto the carbon steel surface by sharing electrons with iron atoms. The molecular dynamics simulation results revealed that both inhibitors adsorbed on the iron surface in a nearby flat manner.
Conflicts of interest
There are no conflicts to declare.
Acknowledgements
This research was supported by the National Natural Science Foundation of China (21706195), the Science and Technology Program of Guizhou Province (QKHJC2016-1149), the Guizhou Provincial Department of the Education Foundation (QJHKYZ2018-030), the Student's Platform for Innovation and Entrepreneurship Training Program (20195200501), and the RUDN University Program 5-100. The authors also gratefully acknowledge Mohammed V University (Morocco) for financial assistance and the facility for this study.
References
- X. G. Li, D. W. Zhang, Z. Y. Liu, Z. Li, C. W. Du and C. F. Dong, Nature, 2015, 527, 441–442 CrossRef CAS.
- D. Dwivedi, K. Lepková and T. Becker, RSC Adv., 2017, 7, 4580–4610 RSC.
- B. Tan, S. Zhang, H. Liu, Y. Qiang, W. Li, L. Guo and S. Chen, J. Taiwan Inst. Chem. Eng., 2019, 102, 424–437 CrossRef CAS.
- A. A. Al-Amiery, A. A. H. Kadhum, A. H. M. Alobaidy, A. B. Mohamad and P. S. Hoon, Materials, 2014, 7, 662–672 CrossRef CAS.
- Y. G. Avdeev and Y. I. Kuznetsov, Russ. Chem. Rev., 2012, 81, 1133–1145 CrossRef.
- M. Finšgar and J. Jackson, Corros. Sci., 2014, 86, 17–41 CrossRef.
- S. Marzorati, L. Verotta and S. P. Trasatti, Molecules, 2019, 24, 48 CrossRef.
- M. Goyal, S. Kumar, I. Bahadur, C. Verma and E. E. Ebenso, J. Mol. Liq., 2018, 256, 565–573 CrossRef CAS.
- L. Guo, I. B. Obot, X. Zheng, X. Shen, Y. Qiang, S. Kaya and C. Kaya, Appl. Surf. Sci., 2017, 406, 301–306 CrossRef CAS.
- F. Himo, Theor. Chem. Acc., 2005, 116, 232–240 Search PubMed.
- I. B. Obot and Z. M. Gasem, Corros. Sci., 2014, 83, 359–366 CrossRef CAS.
- A. A. Al-Sarawya, A. S. Fouda and W. A. S. El-Dein, Desalination, 2008, 229, 279–293 CrossRef.
- N. O. Obi-Egbedi, I. B. Obot, M. I. El-Khaiary, S. A. Umoren and E. E. Ebenso, Int. J. Electrochem. Sci., 2011, 6, 5649–5675 CAS.
- D. A. Winkler, M. Breedon, A. E. Hughes, F. R. Burden, A. S. Barnard, T. G. Harvey and I. Cole, Green Chem., 2014, 16, 3349–3357 RSC.
- M. Gholami, I. Danaee, M. H. Maddahy and M. RashvandAvei, Ind. Eng. Chem. Res., 2013, 52, 14875–14889 CrossRef CAS.
- K. F. Khaled, Electrochim. Acta, 2008, 53, 3484–3492 CrossRef CAS.
- Y. S. Li, H. Tian, D. S. Zhao, D. K. Hu, X. Y. Liu, H. W. Jin, G. P. Song and Z. N. Cui, Bioorg. Med. Chem. Lett., 2016, 26, 3632–3635 CrossRef CAS.
- J. Nalawade, A. Shinde, A. Chavan, S. Patil, M. Suryavanshi, M. Modak, P. Choudhari, V. D. Bobade and P. C. Mhaske, Eur. J. Med. Chem., 2019, 179, 649–659 CrossRef CAS.
- W. H. Li, Q. He, S. T. Zhang, C. L. Pei and B. R. Hou, J. Appl. Electrochem., 2008, 38, 289–295 CrossRef CAS.
- C. M. Fernandes, L. X. Alvarez, N. E. dos Santos, A. C. M. Barrios and E. A. Ponzio, Corros. Sci., 2019, 149, 185–194 CrossRef CAS.
- S. Kaya, P. Banerjee, S. K. Saha, B. Tüzün and C. Kaya, RSC Adv., 2016, 6, 74550–74559 RSC.
- R. D. Snyder, G. S. Pearl, G. Mandakas, W. N. Choy, F. Goodsaid and I. Y. Rosenblum, Environ. Mol. Mutagen., 2004, 43, 143–158 CrossRef CAS.
- M. P. Andersson and P. Uvdal, J. Phys. Chem. A, 2005, 109, 2937–2941 CrossRef CAS.
- E. Cances, B. Mennucci and J. Tomasi, J. Chem. Phys., 1997, 107, 3032–3041 CrossRef CAS.
- L. Guo, S. Zhu, S. Zhang, Q. He and W. Li, Corros. Sci., 2014, 87, 366–375 CrossRef CAS.
- H. Sun, J. Phys. Chem. B, 1998, 102, 7338–7364 CrossRef CAS.
- M. Yadav, S. Kumar and L. Gope, J. Adhes. Sci. Technol., 2014, 28, 1072–1089 CrossRef CAS.
- Z. Salarvand, M. Amirnasr, M. Talebian, K. Raeissi and S. Meghdadi, Corros. Sci., 2017, 114, 133–145 CrossRef CAS.
- E. E. Elemike, H. U. Nwankwo and D. C. Onwudiwe, J. Mol. Struct., 2018, 1155, 123–132 CrossRef CAS.
- K. F. Khaled and N. Hackerman, Mater. Chem. Phys., 2003, 82, 949–960 CrossRef CAS.
- T. M. Lv, S. H. Zhu, L. Guo and S. T. Zhang, Res. Chem. Intermed., 2015, 41, 7073–7093 CrossRef CAS.
- N. Muhammad, Y. A. Elsheikh, M. I. A. Mutalib, A. A. Bazmi, R. A. Khan, H. Khan, S. Rafiq, Z. Man and I. Khan, J. Ind. Eng. Chem., 2015, 21, 1–10 CrossRef CAS.
- L. Guo, S. T. Zhang, W. P. Li, G. Hu and X. Li, Mater. Corros., 2014, 65, 935–942 CrossRef CAS.
- H. Gerengi, H. I. Ugras, M. M. Solomon, S. A. Umoren, M. Kurtay and N. Atar, J. Adhes. Sci. Technol., 2016, 30, 2383–2403 CrossRef CAS.
- N. Esmaeili, J. Neshati and I. Yavari, Res. Chem. Intermed., 2016, 42, 5339–5351 CrossRef CAS.
- R. Solmaz, Corros. Sci., 2014, 79, 169–176 CrossRef CAS.
- M. M. Solomon, S. A. Umoren, I. B. Obot, A. A. Sorour and H. Gerengi, ACS Appl. Mater. Interfaces, 2018, 10, 28112–28129 CrossRef CAS.
- M. A. Deyab and S. S. Abd El-Rehimb, J. Taiwan Inst. Chem. Eng., 2014, 45, 1065–1072 CrossRef CAS.
- R. Karthikaiselvi, S. Subhashini and R. Rajalakshmi, Arabian J. Chem., 2012, 5, 517–522 CrossRef CAS.
- A. Zarrouk, B. Hammouti, A. Dafali and F. Bentiss, Ind. Eng. Chem. Res., 2013, 52, 2560–2568 CrossRef CAS.
- I. B. Obot, D. D. Macdonald and Z. M. Gasem, Corros. Sci., 2015, 99, 1–30 CrossRef CAS.
- R. C. Morrison, J. Chem. Phys., 1992, 96, 3718–3722 CrossRef CAS.
- S. B. Liu, Acta Phys.-Chim. Sin., 2009, 25, 590–600 CAS.
- L. H. Madkour, S. Kaya and I. B. Obot, J. Mol. Liq., 2018, 260, 351–374 CrossRef CAS.
- A. Kokalj, Electrochim. Acta, 2010, 56, 745–755 CrossRef CAS.
- X. Li, S. Deng, T. Lin, X. Xie and G. Du, Corros. Sci., 2017, 118, 202–216 CrossRef CAS.
- Y. Gong, Z. Wang, F. Gao, S. Zhang and H. Li, Ind. Eng. Chem. Res., 2015, 54, 12242–12253 CrossRef CAS.
- Y. El Bakri, L. Guo, E. H. Anouar, A. Harmaoui, A. Ben Ali, E. M. Essassi and J. T. Mague, J. Mol. Struct., 2019, 1176, 290–297 CrossRef CAS.
- J. P. Zeng, J. Y. Zhang and X. D. Gong, Comput. Theor. Chem., 2011, 963, 110–114 CrossRef CAS.
- A. Doner, R. Solmaz, M. Ozcan and G. Kardas, Corros. Sci., 2011, 53, 2902–2913 CrossRef.
Footnote |
| † Electronic supplementary information (ESI) available. See DOI: 10.1039/c9ra05881h |
|
| This journal is © The Royal Society of Chemistry 2019 |
Click here to see how this site uses Cookies. View our privacy policy here.  Open Access Article
 *a,
Youness El Bakri*bc,
El Hassane Anouar
 *d,
Jianhong Tane,
Savaş Kayaf and
El Mokhtar Essassib


![[thin space (1/6-em)]](https://www.rsc.org/images/entities/char_2009.gif) ln(Kads × 55.5)
ln(Kads × 55.5)


![[thin space (1/6-em)]](https://www.rsc.org/images/entities/char_2009.gif) Icorr vs. 1/T and ln(Icorr/T) vs. 1/T are shown in Fig. 6. The Ea values for carbon steel were determined from the slope of the ln
Icorr vs. 1/T and ln(Icorr/T) vs. 1/T are shown in Fig. 6. The Ea values for carbon steel were determined from the slope of the ln![[thin space (1/6-em)]](https://www.rsc.org/images/entities/char_2009.gif) Icorr vs.1/T plots. ΔHa and ΔSa were calculated from the slope and intercept of the ln(Icorr/T) vs.1/T plots, respectively. The obtained corrosion kinetic parameters are listed in Table 5.
Icorr vs.1/T plots. ΔHa and ΔSa were calculated from the slope and intercept of the ln(Icorr/T) vs.1/T plots, respectively. The obtained corrosion kinetic parameters are listed in Table 5.

![[thin space (1/6-em)]](https://www.rsc.org/images/entities/char_2009.gif) Icorr vs. 1/T and transition-state plots of ln(Icorr/T) vs. 1/T (b) for carbon steel in 1 M HCl containing 10−3 M CPT and MPT at various temperatures.
Icorr vs. 1/T and transition-state plots of ln(Icorr/T) vs. 1/T (b) for carbon steel in 1 M HCl containing 10−3 M CPT and MPT at various temperatures.


