 Open Access Article
Evolution of the phases and the polishing performance of ceria-based compounds synthesized by a facile calcination method
Wenli Pei*a,
Dong Zhao a,
Xianghui Chen*ab,
Xiaoyang Wangc,
Xingbo Yangd,
Jianjun Wanga,
Zhijie Lib and
Lihu Zhoub
aKey Laboratory for Anisotropy and Texture of Materials, College of Materials Science and Engineering, Northeastern University, Shenyang 110819, China. E-mail: peiwl@atm.neu.edu.cn; xianghui0205@163.com
bDemeter (Suzhou) Electronic Environmental Protection Material Co., Ltd., Suzhou 215000, China
cKey Laboratory of Electromagnetic Processing of Materials, School of Metallurgy, Northeastern University, Shenyang 110819, China
dDemeter Technologies Inc., Burlingame, CA 94010, USA
First published on 27th August 2019
Abstract
Ceria-based compounds with additions of La and F (CLF compounds) were prepared by using industrial-grade fluorinated lanthanum cerium carbonate as a precursor via a facile calcination method. The evolution of phase structures of the compounds during preparation and the relationship between the structure and the polishing performance were investigated. The compounds consist of three phases: CeO2, LaOF, and LaF3. The phase component could be controlled by tuning the calcination process. A higher degree of fluorination and a higher calcination temperature led to the formation of more LaOF and less LaF3 phases. The LaOF phase performs a higher stock removal rate. The best polishing efficiency was achieved with LaOF phase ratio around 18%. Intermetallic LaF3 is a low-hardness phase and is easily crushed during polishing, which lowers the removal rate and shortens the useful life of the polishing powder.
Introduction
In recent years, ceria-based compounds have been paid considerable attention for their potential applications in emerging technologies in environmental and energy related applications.1–4 It is widely used as various silica-containing glass materials because of their unique mechanical and chemical polishing performance.5–8 Usually, the cutting efficiency of pure CeO2 is lower than that of ceria-based compounds added with La.9–11 With the development of the precision optics industry and the emergence of new applications, the requirements for a neat finish of the glass surfaces are getting more stringent. As a result, rare earth polishing compounds with the addition of La are getting more attention in the market.12,13Ceria-based polishing materials are fluorinated during the preparation of the precursors, which results in the formation of new phases in the final products.14,15 These phrases play an important role in determining the hardness, the crystal structure, and the morphology of the polishing particles, which in turn influences the polishing performance. Fluorine can form two phases, namely LaOF and LaF3, in the ceria matrix and a small number of F atoms dissolve in the lattice of ceria.16,17 The F atoms can significantly improve the chemical activity of ceria in the polishing process as well as enhance its polishing performance.18,19 Therefore, ceria-based compounds added with La and F (CLF compounds) have gained much interest and became promising polishing materials. Previous studies showed that the behavior of the F atoms and the phase structures including the formation and the distribution of CeO2, LaOF, and LaF3, are closely related to the polishing performance.20,21 However, it is still not clear how to control the phase components in the ceria-based polishing powders. More importantly, there are few reports on what role the phases play on the polishing performance.22,23
In this work, the evolution of the structure of the CLF compounds during preparation and the relationship between the structures and the polishing performance were subsequently investigated. The influence of the phase components and the role of the different phases on the polishing process were discussed. In addition, the preparation method of the Ra compounds polishing powder was optimized. The work provides an insight into the mechanism that La and F improve the polishing performance, and set out fundamental guidelines for the preparation of CLF compounds with an optimal polishing performance.
Experimental procedure
Preparation of the CLF compound powders
Industrial-grade cerium lanthanum carbonate was added into a reactor containing a given volume of deionized water to obtain a mixture with a solid content of 50%. Then, the mixture was then stirred for 30 min to obtain a solution and different amounts of HF (30%) were added. After 2 h reaction at 80 °C, a 0.5 mol L−1 NH4HCO3 solution was gradually added until the precipitation was complete. The prepared mixture was then filtered, washed, and dried at room temperature to obtain the precursor materials with different fluorine contents. All precursor materials were milled to obtain a smaller particle size with a similar particle size distribution (PSD) via a ball-milling process. The precursor materials were then calcined in a muffle furnace to obtain the final CLF compound powders.Characterization
The particle size distribution (PSD) of the polishing powders was measured using a laser particle size analyzer (Malvern 2000E) and the specific surface area (SSA) of the polishing powder was measured with a BET system (H300-2000A). The crystal structures were determined by X-ray Diffraction (XRD) on an X'Pert Powder 003 system. The morphology and the microstructures were analyzed by transmission electron microscopy (TEM) on a JEOL JEM-2100F system. The polishing performance was checked by using a 9B polisher to work on the normal commercial K9 glass. The surface roughness of the polished glass was evaluated by an EDGE QQAFM-01 atomic force microscope (AFM).Results and discussion
Influence of the F content on the CLF compound powders
The precursors with a fluorine content of 2%, 5%, and 10% were calcined from 800 to 1000 °C for 3 h. The average particle size of the samples was measured and summarized in Fig. 1. Normally, the particle size increases with the calcination temperature. The fluorine content significantly influenced the particle size. For the same calcination temperature, the highest fluorine content resulted in the larger particles.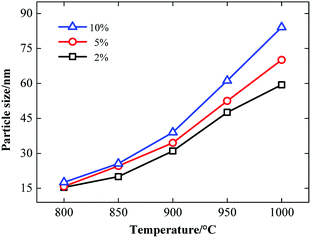 | ||
| Fig. 1 Dependence of the average particle size on the calcination temperature for different samples with the fluorine content of 2%, 5%, and 10%. | ||
The TEM micrographs of the samples with a fluorine content of 2%, 5%, and 10% obtained at 950 °C for 3 h are shown in Fig. 2. Higher fluorine contents result in larger particles for the same calcination temperature, which agrees with the results from the laser analyzer. The particles with the lowest fluorine content of 2% are agglomerated. The agglomerate is composed of smaller particles with an irregular polygonal shape, which indicates that the crystallization degree of the particles is lower. When the fluorine content increases, the particles adopt a hexagon-like morphology and present a higher crystallization degree. The addition of the more F atoms benefits crystal growth. The particles with a higher fluorine content present a more sufficient crystallization degree.
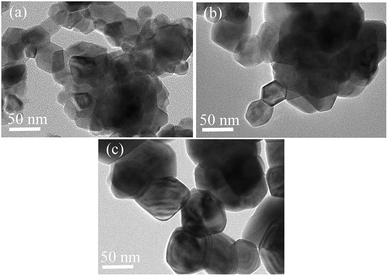 | ||
| Fig. 2 TEM micrographs of the samples with different fluorine contents of (a) 2%, (b) 5%, and (c) 10%. | ||
Evolution of the phases of the CLF compounds
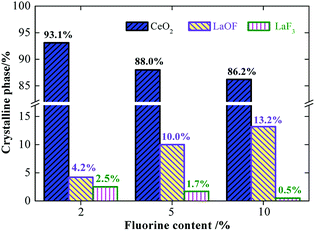
The cerium lanthanum precursors with 0%, 2%, 5%, and 10% fluorine were calcined at 950 °C for 3 h. Fig. 3 shows the XRD diffraction patterns of the samples for which the diffraction peaks of CeO2, LaOF, and LaF3 could be indexed. The La2O3 phase was not observed in the XRD pattern, which indicates that both La and F atoms dissolved into the CeO2 lattice of the cubic fluorite structure. The characteristic peak for CeO2 shifted to lower angles with the increasing F content. This is because the solid solution of La atoms and a large number of F atoms increases the inter-planar spacing of CeO2, which results in a shift of the characteristic peak. Noticeably, the component of the phases in the samples with different fluorine contents is diverse. The diffraction patterns were analyzed using the X'Pert HighScore software to calculate the phase component of the samples. Fig. 4 lists the proportion of different crystal phases in the samples with different fluorine contents.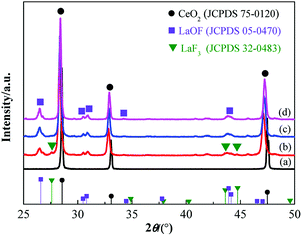 | ||
| Fig. 3 XRD patterns of the ceria compound with different fluorine contents from (a) 0%, (b) 2%, (c) 5%, and (d) 10%. | ||
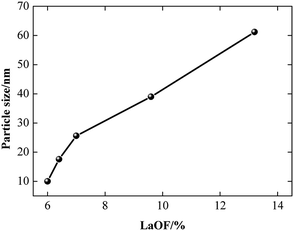
The proportion of the LaF3 phase decreases and the LaOF phase increases when the F content increases. A La atom is larger than a Ce atom. When the La atoms replace the Ce atoms in the structure, the lattice is distorted and defects are caused near the area where the La atom entered the lattice. F atoms have a small size and are likely to occupy the lattice of high-energy defects and form LaOF to reduce the density of defects and form a more sufficient crystallization degree. The more F atoms dissolve into the CeO2 phase doped by La, the more LaOF can be obtained. Therefore, controlling the fluorine content is an efficient way to tune the phase component in our method. Fig. 5 shows the particle size of the CLF compounds has a close relationship with LaOF content. The particle size grows up with the increase of LaOF content, which means the more F content can facilitate the particle growth.
Fig. 6 shows the XRD patterns of a sample prepared by calcinating the precursor with a fluorine content of 10% from 800 °C to 950 °C. The intensity of the diffraction peaks increased and the half-width of the diffraction peaks decreased with the increasing calcination temperature. It indicates that a higher calcination temperature results in a more sufficient crystallization degree and a larger grain size in the CLF compound powders. The LaF3 phase was found in the samples obtained at a lower temperature but was no longer present for a temperature above 900 °C. Therefore, a high enough temperature can avoid the presence of the LaF3 phase in the product.
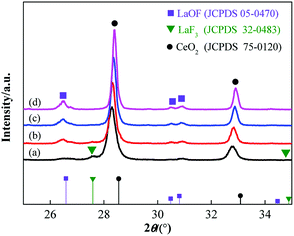 | ||
| Fig. 6 XRD patterns of the samples with a precursor material containing 10% fluorine content calcined at different temperatures, from (a) 800 °C, (b) 850 °C, (c) 900 °C, and (d) 950 °C. | ||
Fig. 7 demonstrates a comparison of the infrared spectroscopy results for pure ceria and the CLF compounds with an F content of 5% prepared by calcination at 800 °C and 1000 °C. In the figure, the peaks at 478.92 cm−1 and 1241.40 cm−1 are due to the stretching vibration of Ce–O. The stretching vibration of the La–F bond appears near 1123.10 cm−1 and that of F–O is around 1048.74 cm−1. The infrared spectrum of the calcined product of fluorocarbonate also shows the vibration peak of Ce–O. In addition, the vibration peaks of La–F and F–O also appeared in the calcined fluorocarbonate. The presence of LaF3 and LaOF compounds was also demonstrated, indicating that the La and F atoms are doped into the crystal lattice of CeO2 and precipitate to form LaF3 and LaOF phases.
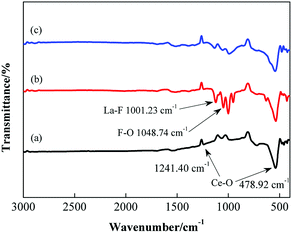 | ||
| Fig. 7 The infrared spectra of pure ceria powder calcinated at (a) 800 °C, and the CLF compounds powder with 5% F calcinated at (b) 1000 °C and (c) 800 °C. | ||
Evaluation of the polishing performance
Cerium-based polishing powders with different phase ratios were obtained by adjusting the fluorine content. The powders were mixed with water to form an aqueous slurry with 10% solid content to polish the K9 glass on a 9B polisher with a polishing mat. The polishing time was fixed at 30 min with a polishing pressure of 20 kPa, along with a rotation speed of the plates of 30 rpm and a slurry flow rate of 1000 ml min−1. The material removal rate is defined by the change in the mass of the glass substrates before and after polishing.Fig. 8 shows the dependence of the material removal rate (MRR) and the average roughness (Ra) of the glass surface on the percentage of LaOF phase in the matrix of the polishing powder. As shown in Fig. 8, the MRR increases with the LaOF phase ratio, saturates around 18% LaOF phase ratio, then decreases. The best Ra was achieved around a 10% LaOF phase ratio.
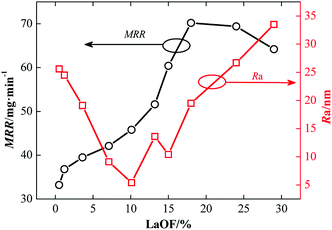 | ||
| Fig. 8 Dependence of the material removal rate (MRR) and the surface roughness (Ra) on the percentage of LaOF phase in the matrix of the polishing powder. | ||
According to the Cook theory,24 CeO2 is the main functional component of ceria-based compounds for polishing SiO2-containing glass. During glass polishing, two functional processes are taking place: the mechanical grinding and the chemical action of Ce4+ in the slurry solution on SiO2. The LaOF crystal phase of the ceria-based polishing powder with high fluorine content increases the hardness of the polishing particles and enhance the effect of mechanical polishing on the glass surface. At the same time, the presence of the LaOF phase causes more distortion in the lattice, which increases the energy and narrows the energy band gap of Ce4+. As a result, the chemical reaction of Ce4+ with SiO2 is enhanced by the higher distorted energy field. The hardness and the integrity of the polishing particles/grains grow further when the LaOF phase ratio is over 18%, which increases the particle size and reduces the contact area with the polished glass surface to lower the MRR.
When the phase ratio of LaOF is low, the effect of mechanical polishing is not enough to remove the grinding marks that come from the previous step. For this reason, the surface roughness of the glass is higher. A further increase in the phase ratio of LaOF enhances both the mechanical and chemical polishing actions. The surface quality of the glass is optimal for a 10% LaOF phase ratio. When the phase ratio of LaOF increases further, the increased hardness of the polishing particles will add more scratches to the surface of the polished glass and Ra increases.
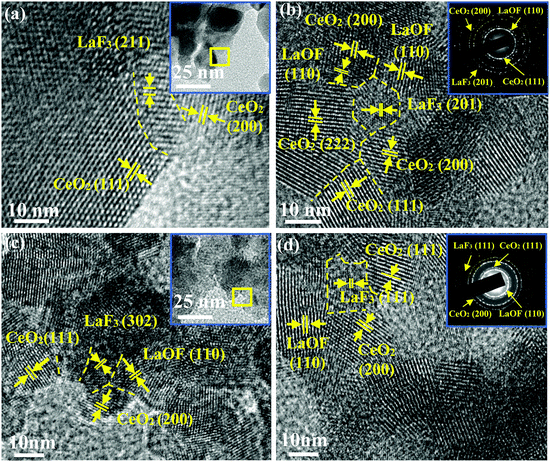
The surface roughness was measured by using AFM. The AFM patterns presented the different height difference by using color contrast, and the highest value and the lowest value could be obtained by using the AFM software. In this work, the average height difference between the highest zone was calculated as the surface roughness. The 2D and 3D AFM scans of K9 glass before (Fig. 9a and c) and after (Fig. 9b and d) polishing by 10% LaOF polished powder are shown in Fig. 9. It can be found that the surface roughness is 34.8 nm, but drops to 5.4 nm after polishing, which significantly improves the surface quality and meets the surface quality requirements for optical glass. The LaF3 phase is maintained at a low percentage level, which indicates that the F and La atoms are more likely to form a LaOF phase in the CeO2 matrix and lower the free energy. Fig. 10 shows the HRTEM micrographs of the samples with different F content obtained at different temperatures. The insets in (a) and (c) are the morphology of the samples calcined at 800 °C and 900 °C, respectively. The dash lines separate the different phases. As shown in Fig. 10, LaF3 is an intermetallic phase precipitated in the main matrix. The Mohs hardness of the intergranular LaF3 precipitate is 4.5 while the Mohs hardness of CeO2 is about 7.0 and that of the ceria-based rare earth polishing powder is higher than 7.0 because the La and F atoms dissolve into the matrix phases to strengthen the solution.25
 | ||
| Fig. 9 Atomic force microscopy (AFM) 2D and 3D images of the K9 glass surface: (a and b) before polishing, and (c and d) after polishing. | ||
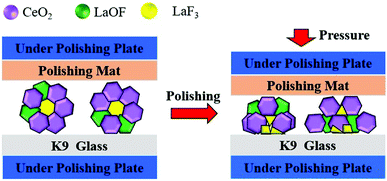
As sketched in Fig. 11, the stress is easily concentrated around LaF3 phase due to the pressure during polishing, which causes a com-pressive force between the particles and the glass surface to cause a fraction of the LaF3 phase, and thus the particle, to break. This lowers the polishing performance of the particles. Therefore, the LaF3 phase is damaging to the fluorine-containing ceria-based polishing powder particles. The presence of the LaF3 phase in the polishing compound must therefore be reduced to extend the polishing life of the powder. According to the data in Fig. 4, the ratio of LaOF can be controlled by adjusting the degree of fluorination in the precursor material or by formulating a more reasonable calcination process. In addition, when formulating the calcination process, the ratio of the harmful phase LaF3 can be reduced by increasing the calcination temperature or prolonging the holding time.
Conclusion
In summary, CLF compound polishing powders were prepared by a facile calcination method. The compounds are composed of three phases: CeO2, LaOF, and LaF3. The investigation of the evolution of the phrase indicates that the phase component of the CLF compounds can be controlled by tuning the fluorine content of the precursor and increasing the calcination temperature. The LaF3 phase is an intermetallic compound precipitated in the main compound matrix. The polishing particles with more LaF3 phase are prone to cracking during polishing, which can deteriorate the MRR. The LaF3 phase is responsible for shortening the polishing lifetime of the CLF compounds. The LaOF phase improves the polishing performance. The LaOF phase in the CeO2 matrix lattice has the highest MRR when the ratio of LaOF in the polishing particles reaches 18%. The lowest surface roughness (Ra) is achieved when the ratio of LaOF is around 10%. Reasonable content of LaOF and few LaF3 are necessary to prepare the CLF compound powders with high polishing performance.Conflicts of interest
There are no conflicts to declare.Acknowledgements
This research was financially supported by the National Natural Science Foundation of China (Grant No. 51871045, 51471048) and the Basic Research Program of the Key Laboratory of Liaoning Province (No. LZ2015035).Notes and references
- C. W. Sun, H. Li and L. Q. Chen, Energy Environ. Sci., 2012, 5, 8475–8505 RSC.
- C. W. Sun, J. Sun, G. L. Xiao, H. R. Zhang, X. P. Qiu, H. Li and L. Q. Chen, J. Phys. Chem. B, 2006, 110, 13445–13452 CrossRef CAS PubMed.
- C. W. Sun and L. Q. Chen, Eur. J. Inorg. Chem., 2009, 26, 3883–3887 CrossRef.
- C. W. Sun, H. Li, Z. X. Wang, L. Q. Chen and X. J. Huang, Chem. Lett., 2004, 33, 662–663 CrossRef CAS.
- B. H. James and P. S. Shyama, J. Alloys Compd., 1994, 207–208, 377–382 Search PubMed.
- H. J. Liu, Z. Y. Feng, X. W. Huang, Z. Q. Long, M. Wang, Y. F. Xiao and Y. K. Hou, J. Rare Earths, 2013, 31, 174–179 CrossRef CAS.
- P. H. Chen, C. P. Liu and C. Y. A. Tsao, Thin Solid Films, 2005, 479, 130–136 CrossRef.
- Z. L. Wang and L. F. Cheng, J. Alloys Compd., 2014, 594, 167–174 Search PubMed.
- X. S. Li, S. D. Huang and G. S. Yang, J. Rare Earths, 2004, 22, 302–306 Search PubMed.
- H. Gong, G. Pan, Z. Gu, C. L. Zou and Y. Liu, Tribol. Trans., 2014, 57, 366–372 CrossRef CAS.
- W. I. Kordonski and S. D. Jacobs, Int. J. Mod. Phys. B, 1996, 23–24, 2837–2848 CrossRef.
- Y. W. Zhao, L. Chang and S. H. Kim, Wear, 2003, 254, 332–339 CrossRef CAS.
- Z. F. Zhang, L. Yu, W. Liu and Z. Y. Song, Appl. Surf. Sci., 2010, 256, 3856–3861 CrossRef CAS.
- B. Gao, W. J. Zhai, Q. Zhai and M. Z. Zhuang, Appl. Surf. Sci., 2019, 484, 534–541 CrossRef CAS.
- H. Deng, K. Hosoya, Y. Imanishi, K. Endo and K. Yamamura, Electrochem. Commun., 2015, 52, 5–8 CrossRef CAS.
- J. Tichy, J. A. Levert and L. Shan, J. Electrochem. Soc., 1999, 146, 1523–1528 CrossRef CAS.
- Q. Xie, Y. Wang, B. Pan, H. Wang, W. Su and X. Wang, Catal. Commun., 2012, 27, 21–25 CrossRef CAS.
- N. Shehata, K. Meehan, M. Hudait and N. Jain, J. Nanopart. Res., 2012, 14, 1–5 CrossRef.
- X. L. Wang, S. Z. Yi, E. W. Liang, Y. Y. Wu and Z. X. Fang, Adv. Mater. Res., 2013, 785–786, 480–483 Search PubMed.
- J. Lee, Q. Zhang and F. Saito, J. Am. Ceram. Soc., 2001, 84, 863–865 CrossRef CAS.
- D. S. Bae, B. Lim, B. I. Kim and K. S. Han, Mater. Lett., 2002, 56, 610–613 CrossRef CAS.
- W. Stoeckenius, J. H. Schulman and L. M. Prince, J. Phys. Chem., 1960, 169, 170–180 CAS.
- W. Y. Wu, X. S. Li, J. Chen, G. S. Yang and G. F. Tu, J. Rare Earths, 2007, 25, 124–125 CrossRef.
- L. M. Cook, J. Non-Cryst. Solids, 1990, 120, 152–157 CrossRef CAS.
- X. S. Li and G. S. Yang, J. Rare Earths, 2004, 22, 236–240 Search PubMed.
| This journal is © The Royal Society of Chemistry 2019 |

