 Open Access Article
A tri-phase percolative ceramic composite with high initial permeability and composition-independent giant permittivity
Wei
Tian†
a,
Bin
Xiao†
ab,
Zuhuang
Chen
a,
Yu
Tang
 ac,
Ning
Ma
a,
Zongrong
Wang
*a and
Piyi
Du
 *a
*a
aState Key Laboratory of Silicon Materials, School of Materials Science and Engineering, Zhejiang University, Hangzhou, 310027, China. E-mail: dupy@zju.edu.cn; zrw@zju.edu.cn
bDepartment of Materials Science and Engineering, Shenzhen Engineering Research Center for Novel Electronic Information Materials and Devices, Southern University of Science and Technology, Shenzhen, 518055, China
cDepartment of Materials Science and Engineering, College of Aerospace Science and Engineering, National University of Defense Technology, Changsha, 410073, China
First published on 27th September 2019
Abstract
The drastic change of properties near the percolation threshold usually limits the practical applications of percolative composite materials. In this work, a tri-phase system, i.e. a BaTiO3 (BTO)/Ni0.5Zn0.5Fe2O4 (NZFO)/BaFe12O19 (BFO) ceramic composite, is proposed and investigated in detail. The BFO phase was in situ formed during a hybrid process of sol–gel and self-combustion methods. The content of the BFO phase could be tuned conveniently by controlling the preparation conditions. The as-prepared BTO/NZFO/BFO tri-phase composite exhibited unprecedented stable dielectric properties that were distinct from those of conventional percolative composites above the percolation threshold due to the existence of a third phase. When the volume fraction of the NZFO phase exceeds 55%, the electrical conductivity and effective permittivity of the composite remain at a stable value of about 10−5 S cm−1 and 10![[thin space (1/6-em)]](https://www.rsc.org/images/entities/char_2009.gif) 000, respectively, which is almost independent of the composition. Such behavior is the result of the synergistic control effect of the percolation effect and specific phase composition in the system. It is evident that the stability of the dielectric properties of the composite is chiefly contributed by the introduction of the BFO phase. Meanwhile, the composite exhibited a relatively high permeability of ∼17 with 90% NZFO loading, and its saturated magnetization is larger than 73 emu g−1, approximately 95% of the pure NZFO phase. The finding of our BTO/NZFO/BFO tri-phase ceramic composite with stable giant permittivity and extremely high permeability paves a new way to solve the difficulty of property instability above the percolation threshold in the utilization of percolative materials.
000, respectively, which is almost independent of the composition. Such behavior is the result of the synergistic control effect of the percolation effect and specific phase composition in the system. It is evident that the stability of the dielectric properties of the composite is chiefly contributed by the introduction of the BFO phase. Meanwhile, the composite exhibited a relatively high permeability of ∼17 with 90% NZFO loading, and its saturated magnetization is larger than 73 emu g−1, approximately 95% of the pure NZFO phase. The finding of our BTO/NZFO/BFO tri-phase ceramic composite with stable giant permittivity and extremely high permeability paves a new way to solve the difficulty of property instability above the percolation threshold in the utilization of percolative materials.
Introduction
Many efforts have been devoted to the investigation of multiferroic materials both experimentally and theoretically due to their capability to satisfy the fast growing demands in advanced electronic devices, such as memory devices with multi-state data storage, solid-state transformers and high sensitivity magnetic field sensors.1–6 Ferroelectric/ferromagnetic composite materials are potential candidates to meet the requirements of miniaturization and multi-functionality in next-generation electronic devices. For example, integrated capacitance-inductance elements and anti-electro-magnetic interference (anti-EMI) filters usually require more space saving in circuit boards or replacement of passive filters constructed from separate capacitance and inductance elements in order to realize the purpose of miniaturization and multi-functionality simultaneously. However, according to the composite law, the capacitance and inductance characteristics with respect to the corresponding constituent phases are dependent on their relative volume fraction in the system. In this scenario, the contribution of the ferroelectric phase would get inevitably undermined if the content of the ferromagnetic phase further increases, or vice versa. Once a nonmagnetic phase has been introduced into the system, the magnetic particles could be blocked or isolated, leading to lower permeability. The same situation may also occur when excessive ferromagnetic phase has been introduced into composite, giving rise to a decreased permittivity. Zhang's group reported a BaTiO3–Ni0.2Cu0.2Zn0.6Fe2O4 ferroelectric/ferromagnetic composite prepared by solid phase synthesis method, neither the permittivity nor the permeability of which was satisfactorily high as anticipated although a combination of both dielectric and magnetic properties could be obtained. In particular, when 30% BaTiO3 had been added, the permittivity of the composite was reduced to lower than 40 and the permeability was only around 10.7 Therefore, limited by the composite law of such systems, it is still quite challenging to prepare composites with both satisfactorily high dielectric and magnetic properties. To solve this problem, materials scientists have tried to utilize percolation effect to avoid the negative influence of the composite law and have successfully obtained a number of percolative composites that could exhibit giant permittivity and high permeability simultaneously.8,9 Representatively, Carlos Pecharromán et al. carried out many systematic studies involving the Ni/BaTiO3 percolative system10 and C. J. Won discovered that the Ni2MnGa/BaTiO3 composite system also exhibited percolative behavior with a percolation threshold of 0.4.11 By varying the concentration and types of the ferrite fillers, it is feasible to prepare different percolative materials with diverse properties.The debut of percolative composites undoubtedly casts light on the design of novel functional materials. However, some new problems are still unsolved for such systems. One of them involves the instability of properties near the percolation threshold (fc) as they usually exhibit a nonlinear behavior at this critical point. It is well known that the conductivity (σ) and permittivity (ε) of the composites would increase to a considerable extent following a scaling law near fc, which is usually expressed as:9,12
| σ ∝ σD (fc − f)−q, f < fc | (1) |
 | (2) |
Generally, the permittivity and conductivity of a percolative composite will increase sharply and nonlinearly near percolation threshold fc, and their dependence on the volume fraction of the conductive phase near fc abides by the scaling law as described by eqn (1) and (2). In conventional percolative NZFO/BTO system, the NZFO ferrite phase is a typical semiconductor with lower conductivity compared with general percolative fillers such as metal particles.14 It is well known that the percolation threshold is achieved once the conductive particles begin to connect with each other, leading to a steep increase in the permittivity and conductivity of the composites due to the formation of percolation paths. Therefore, if using semiconductive NZFO ferrite as the conductive phase, the percolation threshold of the composite will increase most probably to a higher value compared with those of conventional percolative composites.13,15 Moreover, in the composite prepared by liquid enwrapping method, Ba-rich layers with relatively high resistivity would easily enwrap and separate the semiconductive NZFO particles, preventing the formation of conductive paths between the ferrite particles. As a result, the percolation threshold would generally shift to even higher values such as fc = 0.8 − 0.9 in this case.13,16
Our previous work revealed that the BTO/NZFO composite is a typical percolative system with super high percolation threshold and resultant giant permittivity and high permeability.13,15,17,18 It should be pointed out that due to the fast nonlinearly increment in the electrical properties in the vicinity of the percolation threshold, some inconvenience will be brought to the practical applications of the composite materials. The inability of properties is a big problem especially under the circumstances where huge change in properties is not acceptable.
Hereby, we propose a feasible way of solving the difficulties of property instability near the percolation threshold of percolative composites. For the BTO/NZFO composite system, the ionic interdiffusion or chemical reactions are exploited during the sintering process to facilitate the formation of additional phase such as barium ferrite (BaFe12O19) in the composite, a commonly used microwave absorbing materials, has also been widely investigated.19–23 With the formation of this phase, a Debye platform appears in the permittivity–frequency curve of the composite, which is quite distinctive from that of traditional percolative ceramic composites especially at low frequency. In this work, we report the impressively stable dielectric and magnetic properties of the BaTiO3/Ni0.5Zn0.5Fe2O4 ceramic composite coexisting with the BaFe12O19 phase. The physical mechanism behind this behavior is also investigated in-depth theoretically.
Experimental
Samples preparation
Characterization
The density of the samples were measured and calculated using conventional Archimedes method. The surfaces of the samples were polished for XRD observation and phase analysis (RIGAKUD/MAX-C type X-ray diffractometer, Cu Kα, Tokyo, Japan.). SEM microscopy was performed to investigate in the microstructure and morphology of the composites using SIRION-type field emitting scanning electron microscope (Japan FEI Corporation). Before the test of electrical properties, the polished samples were cleaned ultrasonically and painted with silver electrodes. The dielectric properties were analyzed by Precision Impedance Analyzer (HP4294A-LRC) between 100 Hz and 1 MHz. The magnetic hysteresis loops were measured by Vibrating Sample Magnetometer (VSM, USA). The frequency dependence of permeability was measured by Agilent 16451B precision impedance analyzer (Palo Alto, CA) between 100 kHz and 110 MHz.Results and discussion
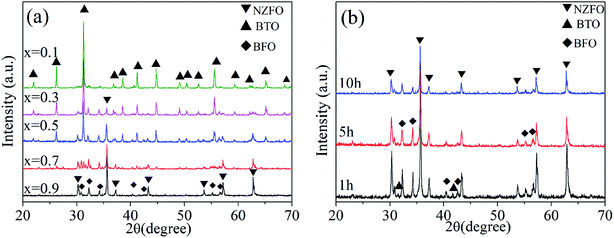
Fig. 1a shows the XRD patterns of the ceramic composite xNZFO/(1 − x) BTO sintered at 1300 °C for 10 h with different molar contents of NZFO ferrite (x = 0.1, 0.3, 0.5, 0.7, 0.9). It can be seen that there are three constituent phases, i.e. NZFO, BTO and BFO, coexisting in the composite. The peak intensity of the BTO phase decreases gradually with the increase in x, which is opposite to the fast increment in that of the NZFO phase. Meanwhile, the peak intensity of the BFO phase also increases with increasing x as shown in Fig. 1a. Fig. 1b shows the XRD patterns of the composite with x = 0.9 sintered at 1300 °C for 1 h, 5 h and 10 h, respectively. It demonstrates that the peak intensity of the BFO phase declines to a large extent with the prolongation of calcination time.The XRD patterns show that the composite is constituted by perovskite BTO phase, magnetoplumbite BFO phase and spinel NZFO phase. Among these phases, the BFO phase is formed in situ and exists as a third constituent phase in the composite, leading to the formation of a completely new tri-phase composite. The formation of the BFO phase could be attributed to two mechanisms during the sintering process. The first one is the elemental interdiffusion and reactions between the ferroelectric BTO phase and the ferromagnetic NZFO phase, which would inevitably occur during the calcination process.14 Since the formation of BFO needs more Fe source than Ba source, the increase in NZFO content would facilitate the generation of BFO in the composite. As a result, an increment in the volume content of BFO was observed with the increase of x, as illustrated in Fig. 1a. The second mechanism is the chemical reaction between BaTiO3 and α-Fe2O3, which usually exists in BTO/NZFO composite that underwent a pre-sintering process.24 The formation of α-Fe2O3 is closely related with NZFO content. In this case, as x increases, abundant Fe source results in the formation of more α-Fe2O3 and further more BFO due to more reactions between α-Fe2O3 and the BTO phase in the final sintering process. It indicates that the existence of NZFO ferrite may promote the formation of BFO phase. Moreover, the content of BFO can be tuned easily by controlling the calcination time. As shown in Fig. 1b, longer sintering time would reduce the content of the BFO phase in the composite, which means the composition of the tri-phase composite is artificially controllable. The reduction in the peak intensity of BFO in the composite with longer duration supports the prediction that the BFO phase is formed via the elemental interdiffusion between BTO and NZFO, because the transportation of the constituent elements requires sufficient time, thus longer duration ensures the diffusion of the Ba and Fe elements into the interior of the crystals to form solid solution rather than form a third phase. More clearly, sufficiently long sintering time results in the diffusion of the constituent elements and finally the formation of the BTO and NZFO phase without BFO phase. It has been reported that if the duration is prolonged to 12 h, only BTO and NZFO could be identified.14
Fig. 2 shows the density of the bi-phase BTO/NZFO ceramic composite sintered at 1200 °C, 1250 °C, 1280 °C and the tri-phase BTO/BFO/NZFO composite sintered at 1300 °C for 10 h with x = 0.7, 0.8 and 0.9, respectively. It can be noticed that the composite has a low density when sintered at a relatively low temperature such as 1200 °C. However, the density of the composite increases dramatically with increasing sintering temperature and reaches a maximum value at 1300 °C for x = 0.7 and x = 0.8. As for the composite with x = 0.9, the highest density was obtained at 1280 °C and a sharp decrease in density appears at 1300 °C. Obviously, unlike the bi-phase composite, the density of tri-phase BTO/BFO/NZFO composite with x = 0.9 exhibits a decrement at 1300 °C as shown in Fig. 2. This decrement is ascribed to the existence of the BFO phase, which has a lower density of only 5.28 g cm−3 compared with those of BTO (5.86 g cm−3) and NZFO (5.33 g cm−3) in the composite.25 Since the volume content of the BFO phase is more dominant at high ferrite loading as shown in Fig. 1a, the decrement in the density of the composite with x = 0.9 can be well understood.
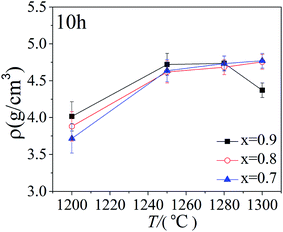 | ||
| Fig. 2 Plots of the density of the ceramic composite sintered at 1200 °C, 1250 °C, 1280 °C and 1300 °C for 10 h. | ||
Fig. 3 shows the cross-sectional SEM images of the composite with x = 0.9 sintered at 1200 °C, 1250 °C, 1280 °C and 1300 °C for 10 h, respectively. As can be seen, the microstructure seems porous and the grains are not well-crystallized at 1200 °C. However, the grains grow larger with elevated sintering temperature and the microstructure becomes dense above 1280 °C. The SEM image in Fig. 3d illustrates that the largest grain size and densest microstructure are simultaneously obtained at 1300 °C, which seems inconsistent with the fact that its density exhibits a sharp decrease as shown in Fig. 2.
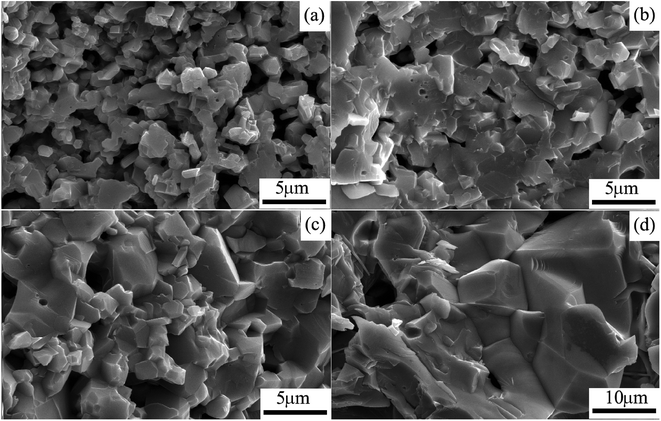 | ||
| Fig. 3 Cross-sectional SEM images of the composite with x = 0.9 sintered at (a) 1200 °C, (b) 1250 °C, (c) 1280 °C and (d) 1300 °C for 10 h, respectively. | ||
As mentioned above, concerning the theoretical density of BTO, BFO and NZFO, the density of the composite may decrease owing to the formation of the BFO phase in the composite. Experimentally, the BFO phase only forms at a high temperature such as 1300 °C with appropriate sintering duration (10 h in this case). Meanwhile, the crystallinity and amount of the BFO phase in the composite decreases apparently with prolonging sintering time as shown in Fig. 1b.
It is reasonable to deduce that the BFO phase may originate from the chemical reaction that usually happens at a high temperature with proper duration. In general, sufficient sintering time assures the migration of the constituent elements in the composite to approach an equilibrium status. The BFO phase is most probably formed during the initial stage of the crystallization of the composite. The longer the reaction time is, the closer to the BTO/NZFO binary-equilibrium status will be. When the sintering time is prolonged to 12 h at 1300 °C, there is enough time for the chemical reaction to reach equilibrium state, where the BFO phase completely decomposed in the composite.13,14 This is why only the BTO/NZFO binary composite was formed when sintered for 12 h in previous researches,14,26 and it is also consistent with the gradual change of the peak intensity of the BFO phase as shown in Fig. 1b. In this work, a tri-phase composite comprised of BTO/NZFO/BFO could be formed at 1300 °C with a sintering duration of 10 h.
Fig. 4a shows the frequency dependence of the effective permittivity of the tri-phase BTO/NZFO/BFO composite with different x sintered at 1300 °C for 10 h. The effective permittivity of the composite decreases with increasing frequency when x is smaller than 0.5. However, it exhibits a wide plateau over several orders of frequencies in low frequency range above x = 0.5. A rapid decrement and a low value of effective permittivity were observed in high frequency range for all samples, as shown in Fig. 4a. Fig. 4b shows the dielectric loss of the tri-phase composite. As can be seen, the peaks move to higher frequencies with the increase in NZFO content. The minimum dielectric loss of the tri-phase composite increases from 0.038 at x = 0.1 to 0.607 at x = 0.9.
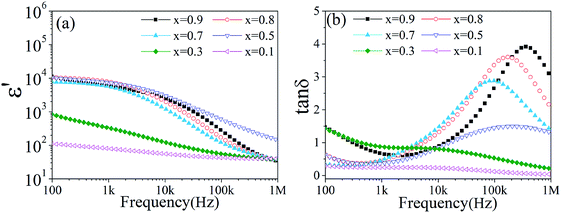 | ||
| Fig. 4 (a) Effective permittivity and (b) dielectric loss of the tri-phase BTO/NZFO/BFO ceramic composite as a function of frequency. | ||
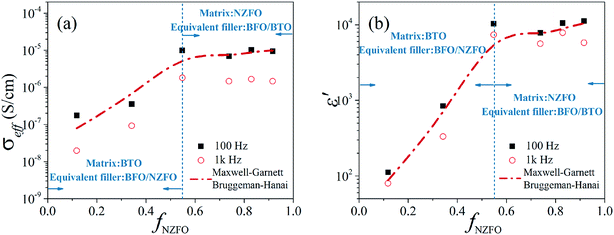
The increment in dielectric loss can be attributed to enhanced Maxwell–Wagner effect caused by increased space charge polarization at interfaces such as phase boundaries and grain boundaries on the grounds that the introduction of BFO phase may lead to more interfaces in the composite.18,27 More interestingly, the effective permittivity of the tri-phase composite seems to keep constant above x = 0.5 as shown in Fig. 4a. This behavior is quite different from that of binary BTO/NZFO composite, whose effective permittivity usually increases nonlinearly with increased NZFO content.13 For clarity, the conductivity and effective permittivity of the tri-phase composite as a function of the volume fraction of NZFO ferrite (fNZFO) at frequency of 100 Hz and 1 kHz are provided in Fig. 5a and b, respectively. The molar content of NZFO ferrite x = 0.1, 0.3, 0.5, 0.7, 0.8, 0.9 corresponds to the volume fraction of fNZFO = 0.118, 0.342, 0.548, 0.738, 0.829 and 0.916, respectively. It illustrates clearly that the conductivity and the effective permittivity of the composite increases rapidly until fNZFO = 0.548, and tends to maintain constant above it. The effective permittivity increases from only about 112 (fNZFO = 0.118) to 10![[thin space (1/6-em)]](https://www.rsc.org/images/entities/char_2009.gif) 340 (fNZFO = 0.548) at 100 Hz by almost two orders of magnitude. Correspondingly, the conductivity increases also by nearly two orders of magnitude from 1.74483 × 10⁻⁷ S cm−1 at fNZFO = 0.118 to 9.86525 × 10⁻⁶ S cm−1 at fNZFO = 0.548 at the same frequency. However, they preserve a stable value of approximately 11
340 (fNZFO = 0.548) at 100 Hz by almost two orders of magnitude. Correspondingly, the conductivity increases also by nearly two orders of magnitude from 1.74483 × 10⁻⁷ S cm−1 at fNZFO = 0.118 to 9.86525 × 10⁻⁶ S cm−1 at fNZFO = 0.548 at the same frequency. However, they preserve a stable value of approximately 11![[thin space (1/6-em)]](https://www.rsc.org/images/entities/char_2009.gif) 000 for effective permittivity and 1 × 10⁻⁵ S cm−1 for conductivity when the volume fraction of ferrite content is above fNZFO = 0.548.
000 for effective permittivity and 1 × 10⁻⁵ S cm−1 for conductivity when the volume fraction of ferrite content is above fNZFO = 0.548.
It can be seen from Fig. 5 that the conductivity and effective permittivity of the tri-phase composite almost keeps constant above a certain point, i.e. fNZFO = 0.548 in this case. This particular point is very close to the percolation threshold of the BTO/NZFO composite (fc = 0.55 − 0.65).26,28 In this work, the BFO phase is formed in situ due to the chemical reactions between BTO and NZFO, hence it most probably forms at the phase boundaries of the two phases. It is speculated that the percolation threshold of the BTO/NZFO/BFO composite is the same as that of the BTO/NZFO composite, i.e. 0.55 in this case, and the following model could be used to interpret the atypical dielectric behaviour of the composite. Below fc, the matrix is insulating BTO phase, and the NZFO particles are dispersed uniformly in the matrix, thus the BFO phase is formed around the NZFO phase. However, above fc, the matrix is semiconducting NZFO phase with the BTO particles dispersed in it, hence the BFO phase is probably formed around the BTO phase.
In fact, if it possesses a core–shell structure, the Bruggeman–Hanai approximation model (B–H model), which is expressed as below, can not be used to calculate the effective dielectric constant of the composite.13,15
 | (3) |
Now the theoretical calculation can be carried out as follows: firstly, the volume fraction of each constituent phase in the composite is obtained by summing up its integral intensity of all peaks in XRD patterns, as shown in Fig. 1a. It indicates that above fc, the volume content of the BFO phase maintains a stable value of about 20–25%.
Secondly, below fc, the BTO exists as the matrix, while the NZFO/BFO is assumed to be the equivalent filler. On the contrary, above fc, the NZFO is assumed as the matrix, and the BTO/BFO exists as the equivalent filler. As mentioned above, we consider the NZFO/BFO and BTO/BFO as a whole below and above fc. The NZFO/BFO and BTO/BFO equivalent fillers possess a core–shell structure, where the BFO is seen as the shell. Besides, for the core–shell structure, the Maxwell-Garnett model (M-G model) is used to calculate its effective dielectric constant, which is expressed as follows:13,15
 | (4) |
| f NZFO | Matrix 1 | Filler 1 | Effective permittivity (M-G) | Electrical conductivity (S cm−1) (M-G) | Matrix | Equivalent filler (matrix 1/filler 1) | Effective permittivity (B–H) | Electrical conductivity (S cm−1) (B–H) |
|---|---|---|---|---|---|---|---|---|
| 0.118 | BFO | NZFO | 22 | 2 × 10⁻⁸ | BTO | NZFO/BFO | 88 | 9 × 10⁻⁸ |
| 0.342 | NZFO | BFO | 6006 | 6 × 10⁻⁶ | BTO | NZFO/BFO | 615 | 6 × 10⁻⁷ |
| 0.548 | NZFO | BFO | 8583 | 9 × 10⁻⁶ | BTO | NZFO/BFO | 8316 | 8 × 10⁻⁶ |
| 0.738 | BTO | BFO | 45 | 5 × 10⁻⁸ | NZFO | BTO/BFO | 7316 | 7 × 10⁻⁶ |
| 0.829 | BFO | BTO | 20 | 2 × 10⁻⁸ | NZFO | NZFO/BFO | 8931 | 9 × 10⁻⁶ |
| 0.916 | BFO | BTO | 18 | 2 × 10⁻⁸ | NZFO | BTO/BFO | 10![[thin space (1/6-em)]](https://www.rsc.org/images/entities/char_2009.gif) 492 492 |
1 × 10⁻⁵ |
Finally, we use the B–H model to calculate the effective dielectric constant of the tri-phased ceramic composite by putting the values of the matrix and the equivalent filler under different f (volume content of NZFO) into the formula as listed in Table 1.
The calculation result is shown in Fig. 5b, in which the red line represents the prediction of M-G model and B–H model. Obviously, the calculated results that employ the M-G model as well as B–H model fit well with the experimental data at 100 Hz and 1 kHz as shown in Fig. 5b. The physical model proposed above can also be applied to describe the behavior of the electrical conductivity of the composite as shown in Fig. 5a, which also fits well with our experimental data. It should be noted that the ceramic composite synthesized via a liquid coating process could form a core/shell structure first, nevertheless a higher sintering temperature such as 1300 °C would destroy the core/shell structure. It is speculated that there may exist a concentration gradient in the ceramic composite, which means that the semiconductive NZFO was surrounded by Ba-rich layer, resulting in the obstruction of the formation of electric channels and constitution of micro-capacitances (situation similar to the structure of boundary layer capacitor). As a consequence, the series-parallel connection of micro-capacitances is physically responsible for the remarkable increase in the effective permittivity of the composite in terms of equivalent circuit. As shown in Fig. 1a, the content of BTO in the ceramic composite declined and the content of BFO increased with increasing NZFO content. BFO, a commonly used microwave absorbing material, possesses high resistivity and relatively small effective permittivity compared with BTO. Hence, with the enlargement of x, although the thinning of dielectric layer between NZFO makes the term of  (eqn (2)) larger, the increment of BFO in the dielectric layers results in the diminution of the whole effective permittivity in the dielectric layer (ε0 in eqn (2)), which synergistically make the permittivity to exhibit an almost composition-independent behavior in a wide composition range above the percolation threshold compared with the case in traditional percolative composites. Therefore, the engendering of a third phase (BFO) compensates the nonlinear increase in the dielectric properties of such percolative composite.
Fig. 6 shows the magnetic hysteresis loops of the tri-phase BTO/NZFO/BFO composite with various x measured at room temperature, in which the enlarged low field region for x = 0.9 is shown as inset. The saturation magnetization of the composite decreases with decreasing ferrite content from 73.2 emu g−1 at x = 0.9 to 36.8 emu g−1 at x = 0.7. For x = 0.9, the coercivity of the composite is about 50 Oe, larger than that of conventional BTO/NZFO composite,29 indicating that the formation of the BFO phase with a high coercivity of >50 Oe (ref. 30) may cause an increment in the coercivity of the tri-phase system to some extent.
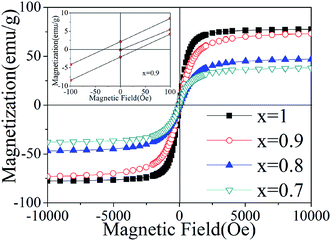 | ||
| Fig. 6 Room temperature magnetic hysteresis loops of the tri-phase BTO/NZFO/BFO ceramic composites sintered at 1300 °C for 10 h. The inset shows the low field region of x = 0.9. | ||
The saturation magnetization is mainly originated from the ferrite phase, and it is closely dependent on the parameters such as grain size and density following the expression of:31
| Ms = (1 − p) δsds | (5) |
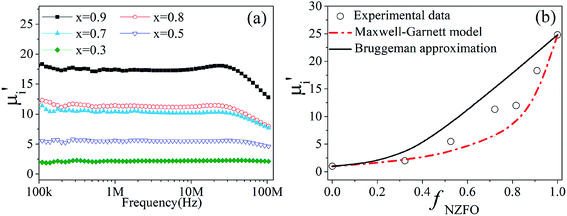
The frequency dependence of the effective permeability of the tri-phase BTO/NZFO/BFO composite on ferrite content x is shown in Fig. 7a. As is expected, the effective permeability increases with increasing ferrite content in accordance with the composite law. The cut-off frequencies are found to be above 20 MHz, which broadens the applicability of the composite in a wide frequency region. It is also noticed that the value of effective permeability is much smaller than that of the BTO/NZFO system.29
In fact, two factors should be considered in understanding the decrease of saturation magnetization and effective permeability with decreasing NZFO content. One is the composite effect, that is, the introduction of nonmagnetic BTO and hard-magnetic BFO phase weakens the interactions and continuum among the NZFO crystalline particles. As a result, the initial permeability decreases due to lower ferrite content and further weakening effect of other two constituent phases (BTO and BFO). It can be deduced that the magnetic response of such tri-phase composite can be modulated by controlling ferrite content in the system. The other is the emergence of demagnetizing filed that usually exists between the interfaces of the constituent phases according to grain boundary demagnetizing field theory, which can be written as:32
 | (6) |
The plots of the initial permeability of the composite as a function of NZFO content (fNZFO) are shown in Fig. 7b. For simplifying analysis, the BTO and BFO phase are considered wholly as dielectric matrix while only NZFO phase is thought as magnetic filler. The theoretical calculation can be conducted using the aforementioned Maxwell-Garnett model (eqn (4)) and Bruggeman–Hanai approximation (eqn (3)). The calculation results are illustrated in Fig. 7b, in which the solid line represents the results of Bruggeman equation while the dot-dashed line represents the prediction of M-G model.
The calculated values from M-G equation agree well with the experimental values when the NZFO content is below 30%. However, obvious deviation occurs between the measured values and theoretical predictions at higher NZFO content above 50%. It is known that the M-G theory can only be applied in the situation where all the interactions between the filler particles are ignored, while the Bruggeman equation takes the local influence of adjoining particles into consideration and treats the constituent phases in the composite equally. Hereby we assume that the BFO phase is as homogenous as the BTO phase in controlling the magnetic properties of the composite, thus the small difference between BFO and BTO can be neglected. When the NZFO content is below 50%, the ferrite particles form dispersive microstructure in the BTO matrix. This situation fits well with the description of M-G model. Therefore, a good agreement between the experimental results and theoretical predictions is observed. However, as the NZFO content increases, the filler particles begin to contact with one another and finally form percolating topological microstructure, causing the interactions to occur between the interfaces of constituent phases inevitably. Obviously, the effect of such interactions will become dominant in the composite above x = 0.5. Although the ceramic composites were prepared by liquid coating method and a core/shell structure was formed during the preparation process, the elemental interdiffusion will get serious and the third constituent phase will damage the core/shell structure at a high sintering temperature of 1300 °C, leading to a structure which is more close to the situation in which the Bruggeman equation will be more suitable. Consequently, the experimental points fall between the theoretical values of the M-G model and the Bruggeman equation. It is worth noting that BFO may help to isolate the magnetic NZFO particles, preventing them to get aggregating with neighbouring particles. Due to this effect, the majority of the experimental points tend to fall onto the M-G curve instead of the Bruggeman curve as shown in Fig. 7b.
On the whole, in our tri-phase composite, the effective permittivity can keep a stable high value of ∼10![[thin space (1/6-em)]](https://www.rsc.org/images/entities/char_2009.gif) 000 (Zhang's group reported a BaTiO3–Ni0.2Cu0.2Zn0.6Fe2O4 system with a permittivity lower than 40; the Bi4Ti3O12/Ni0.25Cu0.2Zn0.55Fe2O4 system posseses permittivity of as low as 170)7,33 above 50% ferrite loading. The plateau of both conductivity and permittivity between 50% and 90% filler content contributes to the stability of performance within a wide composition range. It suggests that after being increased to an expected high value of permittivity with the help of percolation effect, introducing low-dielectric phase into the composite could help compensate the nonlinear increase in dielectric properties. The findings of this work offer us a promising way to prevent electrical properties from drastic change with varying composition around the percolation threshold. The tri-phase ferroelectric/ferromagnetic composite is thus of great applicable interest in advanced electronic devices due to its stable giant permittivity and extremely high permeability.
000 (Zhang's group reported a BaTiO3–Ni0.2Cu0.2Zn0.6Fe2O4 system with a permittivity lower than 40; the Bi4Ti3O12/Ni0.25Cu0.2Zn0.55Fe2O4 system posseses permittivity of as low as 170)7,33 above 50% ferrite loading. The plateau of both conductivity and permittivity between 50% and 90% filler content contributes to the stability of performance within a wide composition range. It suggests that after being increased to an expected high value of permittivity with the help of percolation effect, introducing low-dielectric phase into the composite could help compensate the nonlinear increase in dielectric properties. The findings of this work offer us a promising way to prevent electrical properties from drastic change with varying composition around the percolation threshold. The tri-phase ferroelectric/ferromagnetic composite is thus of great applicable interest in advanced electronic devices due to its stable giant permittivity and extremely high permeability.
Conclusions
The as-prepared BTO/NZFO ceramic composites exhibits a larruping dielectric response combined by the percolation effect with a percolative threshold larger than 0.5 and the existence of the BFO phase, which has a lower permittivity compared with the BTO matrix. When the volume fraction of NZFO is less than 50%, the behavior of the composite is similar to that of conventional percolative composites, however, when the ferrite content becomes larger than 50%, the permittivity preserves a high value of approximately 10![[thin space (1/6-em)]](https://www.rsc.org/images/entities/char_2009.gif) 000 owing to the existence and adjustment effect of the BFO phase. The formation of the BFO phase did not jeopardize the dielectric properties of the ceramic composites, on the contrary, the permittivity can be nailed at a stable value through appropriate adjustment of the volume fraction of the BFO phase. The phase transformation makes the effective permittivity of the insulating layers much lower and hence helps the composite exhibit stable properties. The BTO/BFO/NZFO ternary ceramic composite is characterized by its impressive dielectric properties and may become a promising candidate for next-generation electronic device applications.
000 owing to the existence and adjustment effect of the BFO phase. The formation of the BFO phase did not jeopardize the dielectric properties of the ceramic composites, on the contrary, the permittivity can be nailed at a stable value through appropriate adjustment of the volume fraction of the BFO phase. The phase transformation makes the effective permittivity of the insulating layers much lower and hence helps the composite exhibit stable properties. The BTO/BFO/NZFO ternary ceramic composite is characterized by its impressive dielectric properties and may become a promising candidate for next-generation electronic device applications.
Conflicts of interest
There are no conflicts to declare.Acknowledgements
This work was supported by the Natural Science Foundation of China under grant no. 51772269 and 51802345.References
- C. Israel, N. D. Mathur and J. F. Scott, Nat. Mater., 2008, 7, 93–94 CrossRef CAS.
- W. Eerenstein, N. D. Mathur and J. F. Scott, Nature, 2006, 442, 759–765 CrossRef CAS.
- C. A. Vaz, J. Hoffman, C. H. Ahn and R. Ramesh, Adv. Mater., 2010, 22, 2900–2918 CrossRef CAS.
- N. M. Triet, T. Q. Trung, N. T. D. Hien, S. Siddiqui, D.-I. Kim, J. C. Lee and N.-E. Lee, Nano Res., 2015, 8, 3421–3429 CrossRef.
- Y. Tang, Y. Zhang, G. Ma, N. Ma and P. Du, J. Phys. Chem. C, 2015, 119, 17995–18005 CrossRef CAS.
- Y. Tang, Y. Zhang, N. Ma and P. Du, J. Mater. Chem. C, 2015, 3, 9076–9088 RSC.
- H. Zhong and H. W. Zhang, J. Magn. Magn. Mater., 2005, 288, 74–78 CrossRef CAS.
- A. L. Efros, Phys. Rev. B: Condens. Matter Mater. Phys., 2011, 84 Search PubMed.
- C. Pecharromán, F. Esteban-Betegón, J. F. Bartolomé, S. López-Esteban and J. S. Moya, Adv. Mater., 2001, 13, 1541–1544 CrossRef.
- C. Pecharromán, F. Esteban-Betegón and R. Jiménez, Ferroelectrics, 2010, 400, 81–88 CrossRef.
- C. J. Won, R. C. Kambale and N. Hur, J. Alloys Compd., 2011, 509, 6969–6972 CrossRef CAS.
- C.-W. Nan, Y. Shen and J. Ma, Annu. Rev. Mater. Res., 2010, 40, 131–151 CrossRef CAS.
- H. Zheng, Y. L. Dong, X. Wang, W. J. Weng, G. R. Han, N. Ma and P. Y. Du, Angew. Chem., Int. Ed. Engl., 2009, 48, 8927–8930 CrossRef CAS.
- B. Xiao, Y. L. Dong, N. Ma and P. Y. Du, J. Am. Ceram. Soc., 2013, 96, 1240–1247 CrossRef CAS.
- J. Q. Huang, P. Y. Du, L. X. Hong, Y. L. Dong and M. C. Hong, Adv. Mater., 2007, 19, 437–440 CrossRef CAS.
- B. Xiao, W. Zheng, Y. L. Dong, N. Ma and P. Y. Du, J. Phys. Chem. C, 2014, 118, 5802–5809 CrossRef CAS.
- Q. Chen, P. Y. Du, L. Ji, W. J. Weng and G. R. Han, Appl. Phys. Lett., 2007, 91, 22912 CrossRef.
- Z. H. Chen, J. Q. Huang, Q. Chen, C. L. Song, G. R. Han, W. J. Weng and P. Y. Du, Scr. Mater., 2007, 57, 921–924 CrossRef CAS.
- R. C. Pullar, Prog. Mater. Sci., 2012, 57, 1191–1334 CrossRef CAS.
- R. M. Almeida, W. Paraguassu, D. S. Pires, R. R. Corrêa and C. W. de Araujo Paschoal, Ceram. Int., 2009, 35, 2443–2447 CrossRef CAS.
- D. Suastiyanti, A. Sudarmaji and B. Soegijono, AIP Conf. Proc., 2012, 1454, 238–241 CrossRef CAS.
- C. C. Yang, Y. J. Gung, C. C. Shih, W. C. Hung and K. H. Wu, J. Magn. Magn. Mater., 2011, 323, 933–938 CrossRef CAS.
- Y. Wang, Y. Huang and Q. F. Wang, J. Magn. Magn. Mater., 2012, 324, 3024–3028 CrossRef CAS.
- M. T. Buscaglia, V. Buscaglia, L. Curecheriu, P. Postolache, L. Mitoseriu, A. C. Ianculescu, B. S. Vasile, Z. Zhe and P. Nanni, Chem. Mater., 2010, 22, 4740–4748 CrossRef CAS.
- B. Xiao, J. C. Wang, N. Ma and P. Y. Du, Advances in Multifunctional Materials and Systems II: Ceramic Transactions, 2014, vol. 245, pp. 23–34 Search PubMed.
- B. Xiao, W. Zheng, M. K. Zhu, W. J. Zhao, N. Ma and P. Y. Du, J. Mater. Chem. C, 2014, 2, 7482 RSC.
- Z. J. Wang, W. Y. Zhou, X. Z. Sui, L. N. Dong, H. W. Cai, J. Zuo, X. R. Liu and Q. G. Chen, Polym. Compos., 2018, 39, 887–894 CrossRef CAS.
- H. Zheng, L. Li, Z. J. Xu, W. J. Weng, G. R. Han, N. Ma and P. Y. Du, J. Phys. D: Appl. Phys., 2013, 46, 185002 CrossRef.
- B. Xiao, Y. Tang, G. D. Ma, N. Ma and P. Y. Du, Appl. Phys. A, 2015, 119, 1291–1300 CrossRef CAS.
- R. E. El Shater, E. H. El-Ghazzawy and M. K. El-Nimr, J. Alloys Compd., 2018, 739, 327–334 CrossRef CAS.
- R. V. Mangalaraja, S. Ananthakumar, P. Manohar and F. D. Gnanam, Mater. Lett., 2003, 57, 2666–2669 CrossRef CAS.
- H. Rikukawa, IEEE Trans. Magn., 1982, 18, 1535–1537 CrossRef.
- W. W. Ling, H. Nie, Y. X. Li and H. W. Zhang, J. Alloys Compd., 2012, 525, 120–125 CrossRef CAS.
Footnote |
| † These authors contributed equally to this work. |
| This journal is © The Royal Society of Chemistry 2019 |

