 Open Access Article
SF6 abatement in a packed bed plasma reactor: study towards the effect of O2 concentration†
Yuan
Tian
a,
Xiaoxing
Zhang
 a,
Bowen
Tang
*a,
Zhaolun
Cui
*a,
Guozhi
Zhang
a,
Zhenwei
Chen
a and
Hao
Wang
b
a,
Bowen
Tang
*a,
Zhaolun
Cui
*a,
Guozhi
Zhang
a,
Zhenwei
Chen
a and
Hao
Wang
b
aSchool of Electrical Engineering and Automation, Wuhan University, Wuhan 430072, China. E-mail: Zhaoluncui@163.com; sm0719@yeah.net
bState Grid Hubei Electric Power Company Maintenance Company, Wuhan 430050, China
First published on 29th October 2019
Abstract
SF6 is a greenhouse gas with extremely high global warming potential value (GWP). In this paper, oxygen and a packed bed plasma reactor (PBR) were applied to remove it. The synergistic effect between oxygen and PBRs was evaluated by the destruction and removal efficiency (DRE) and energy yield (EY) at different oxygen concentrations. The results show that excessive oxygen weakened the micro-discharge in a PBR to suppress SF6 degradation while the addition of a proper amount of oxygen (1–4%) can improve the DRE and EY. 2% O2 in the system had the best promoting effect on the destruction of 6–10% SF6, which made the maximum energy yield (EY) increase by 50.99% to 37.99 g kW−1 h−1 (SF6 concentration was 10%, flow rate was 150 mL min−1). Moreover, in the flow rate range of 100 mL min−1 to 250 mL min−1, the DRE decreased and the EY increased with the flow rate. In addition, the selectivity of different products were affected by the oxygen concentration. For 6% SF6, SO2F2 selectivity was always the highest while SO2 was always the lowest; when the oxygen concentration did not exceed 2%, SOF2 selectivity was higher than SOF4, otherwise, SOF4 selectivity was higher than SOF2. This paper provided experimental support for better understanding of the effect of additional gas concentration on SF6 decomposition in a PBR.
1 Introduction
SF6 is widely used in the power industry as an excellent insulating gas, but due to its extremely high global warming potential value (GWP), it is also listed as one of the six restricted gases by the Kyoto Protocol.1 However, it is still used in large quantities because there is no reliable SF6 replacement gas.2–4 It is estimated that the current global SF6 usage is above 10![[thin space (1/6-em)]](https://www.rsc.org/images/entities/char_2009.gif) 000 tons, and more than 80% is used in the power industry.5 Every year, the power industry is facing the problem of recycling and emission of huge amounts of SF6. Therefore, how to deal with SF6 has become a hot issue in the field of environmental protection.
000 tons, and more than 80% is used in the power industry.5 Every year, the power industry is facing the problem of recycling and emission of huge amounts of SF6. Therefore, how to deal with SF6 has become a hot issue in the field of environmental protection.
Scholars have done a lot of research on the treatment of low concentrations SF6. Methods like radio frequency plasma, microwave plasma and photolysis degradation were applied to remove it,6–8 but the effective treatment concentrations of the above studies were no more than 1%. However, the concentration of SF6 used in power industry is high. Up to now, scholars around the world are still lacking in research on high concentration SF6 treatment.
Dielectric barrier discharge (DBD) technology has been widely used in the reduction of industrial exhaust due to its high efficiency and economy.9,10 DBD can generate reactive species in the discharge gap to physically and chemically interact with the waste gas molecules resulting in the decomposition of them.11 In recent years, Zhang et al. used DBD plasma to destruct SF6 (2%) under static conditions. Although high destruction and removal efficiency (DRE) was obtained, there were still some problems such as low energy yield (EY) and long treatment cycle.11,12 Those obstacles inhibit the further application of DBD.
Changing gas composition has been applied to enhance the processing efficiency of DBD reactors. Lee et al. destructed SF6 in Ar/N2/O2 system to study the effects of additional gases on DBD reduction of SF6.13 Zhang et al. added NH3 to the DBD reactor to promote the SF6 destruction.14 The above studies show that the additional gases can significantly impact the EY of DBD treatment of SF6. Meanwhile, some research has shown that packing materials in DBD reactors can greatly improve the EY of DBD.15–18 Lee et al. used packed bed reactors (PBRs, DBD reactors containing packing materials) to degrade SF6 and CF4.18 Both methods have a greatly influence on the EY of SF6 abatement, but there is no report on the synergistic effect of oxygen on PBRs degradation of high concentration SF6. If oxygen and packing materials can obtain good synergy, it will provide the possibility for PBRs to handle flowing high concentration SF6 (2–10%). The treatment of flowing high concentration SF6 not only can improve the processing efficiency but also can save a large amount of carrier gas, which has significant economic benefits. In addition, the effect of oxygen concentration on the products selectivity has not been studied, although the relationship between them is crucial for the waste gas treatment.
Oxygen is a commonly used oxidant. Its active O radicals in the plasma region can oxidize low fluorine sulfides, thereby promoting the degradation of SF6, but it is also an electronegative gas, excessive oxygen in the system also has an adverse effect on destruction.13,19,20 Therefore, there is a balance to be achieved between the reaction of O radicals with low fluorine sulfides, and the negative effect of oxygen on SF6 degradation in PBRs. This paper aims to study the synergistic effect of different concentration of oxygen and PBRs, and to investigate the selective effect of oxygen concentration on SF6 degradation by-products, so as to provide guidance for further treatment of SF6.
2 Method
2.1. Test platform
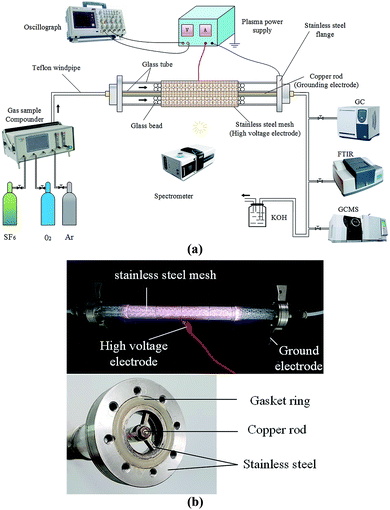
The overall schematic and physical picture of the PBR plasma system test platform are shown in Fig. 1(a) and (b). The whole system consists of three parts: gas distribution system, discharge system and detection system.The gas distribution system which was used to provide different mixing ratio gases required for the degradation process included a gas distribution meter (GC500, Tunkon Electric Technology Co., Ltd.) and a gas source (Newradar Gas Co., Ltd., Wuhan). The gas distribution meter's maximum output flow rate was 3000 mL min−1, gas distribution accuracy ±1% F.S., maximum dilution ratio 300![[thin space (1/6-em)]](https://www.rsc.org/images/entities/char_2009.gif) :
:![[thin space (1/6-em)]](https://www.rsc.org/images/entities/char_2009.gif) 1. The flow rate was controlled by a gas rotameter (50–250 mL min−1). The gas used in this test was 99.999% SF6, 99.999% O2 and 99.999% Ar.
1. The flow rate was controlled by a gas rotameter (50–250 mL min−1). The gas used in this test was 99.999% SF6, 99.999% O2 and 99.999% Ar.
The discharge system was used to remove SF6, which consisted of a plasma power supply (CTP-2000 K, Nanjing Suman Electronics Co., Ltd.) and a PBR. The plasma was generated by the plasma power supply with discharge working voltage 0–30 kV, output power 0–300 W, discharge frequency 0–20 kHz; a stainless steel mesh (high-voltage electrode) was wrapped tightly around a coaxial dual dielectric quartz tube with dielectric thickness of 2 mm and an inner diameter of 20 mm. The inner ground electrode was a copper rod with an external diameter of 4 mm, installed along the axis of the quartz tube. The discharge length was about 200 mm with a discharge gap of 6 mm. The gap was filled with 3.5 mm diameter glass beads as packing materials. The packing fraction was about 0.59 and the gas gap volume of discharge area was 21.68 cm3. Fixed packing fraction was maintained throughout the test, because this parameter would affect the performance of the whole system.21
The detection system consists of a digital oscilloscope (DPO7254C, Tektronix Technology Co., Ltd.), an emission spectrometer (MX2500C, Ocean Optics Co., Ltd.), Gas Chromatograph (GC, GC-450, Shanghai Huishi Instrument), Fourier Transform Infrared Spectrophotometer (FTIR IRTracer-100, SHIMADZU Co., Ltd.) and Gas Chromatography Mass Spectrometer (GC-MS Shimadzu Ultra 2010 plus with CP-Sil 5 CB column, SHIMADZU Co., Ltd.). The digital oscilloscope (4-channel 1G bandwidth, maximum real-time sampling rate 20 GS per s) was used to monitor the instantaneous discharge voltage and current in the PBR. The input power of the plasma power source was read directly from the power supply. The emission spectrometer was a three-channel one which includes three gratings (GRATING_#H5U-UV-UPGD 1200 Line Holographic, H1–H14 and HC-1). It could measure the wavelength from 300 nm to 810 nm, and its optical resolution is 0.1 nm, the integration time was 1 ms to 65 s, and the trigger delay and trigger jitter were 450 ns and 10 ns. The GC was used to detect the concentration of SF6 in the exhaust gas (detector sensitivity was greater than 5000 mV mL mg−1, using the area internal standard method). Among them, in the test, GC used 99.999% He as carrier gas, and the peak time of separation SF6 was 2.2–2.4 min. The exhaust gas also passed through GC-MS (inlet temperature was 200 °C, injection was performed in split injection mode with a split ratio of 109![[thin space (1/6-em)]](https://www.rsc.org/images/entities/char_2009.gif) :
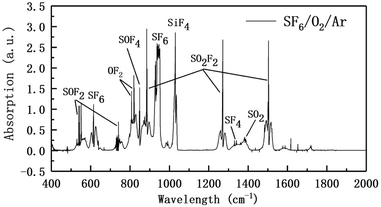
:![[thin space (1/6-em)]](https://www.rsc.org/images/entities/char_2009.gif) 1 and inlet pressure of 56.1 kPa); column flow rate was 1.2 mL min−1), 99.999% He was used as carrier gas, and internal peak integration method could be used to quantitatively detect SO2F2, SOF2, SO2, SOF4 four kinds of decomposition gases. The remaining products were qualitatively detected by FTIR. The relevant parameters were: detection band 4000–400 cm−1; fraction 1 nm; scan times 10 times; infrared detection pool optical path 10 cm. The tail gas was further treated by a KOH solution scrubber.
1 and inlet pressure of 56.1 kPa); column flow rate was 1.2 mL min−1), 99.999% He was used as carrier gas, and internal peak integration method could be used to quantitatively detect SO2F2, SOF2, SO2, SOF4 four kinds of decomposition gases. The remaining products were qualitatively detected by FTIR. The relevant parameters were: detection band 4000–400 cm−1; fraction 1 nm; scan times 10 times; infrared detection pool optical path 10 cm. The tail gas was further treated by a KOH solution scrubber.
The test conditions are summarized as follows: the input power was fixed at 110 W, the power frequency was fixed at 8.7 kHz, Ar was used as the carrier gas to reduce the breakdown voltage of the gas mixture. All the experiments in this paper were conducted at room temperature (298 K) under atmosphere (101.3 kPa). The applied oxygen concentration was 0–8%, and the SF6 concentration was 2–10%. All tests were carried out twice to ensure that the test results were accurate enough.
2.2. Parameter calculation method
In this paper, the DRE of SF6 is defined as follows: | (1) |
EY is obtained based on DRE and input power, and the formula is as follows:
 | (2) |
The selectivity equation for the main sulfur-containing products is as follows:
 | (3) |
3 Results and discussion
3.1. DRE
Shown in Fig. 2 are DREs plotted against SF6 concentration in the presence of no oxygen, 2% O2 and 8% O2. Noted that the 2% O2 group has the highest DRE, followed by the no O2 group and the lowest in the 8% O2 group. When the concentration of SF6 was 2%, high DREs were obtained under three oxygen concentration conditions. With the increase of SF6 concentration, all DREs decreased, but the no O2 group and the 8% O2 group decreased rapidly while the 2% O2 group decreased slowly.Based on the above test results, combined with the study of Zhang et al., this paper summarizes the decomposition process of SF6 into two stages.22–24 The first stage is the collision decomposition stage of SF6 molecules, which includes the formation of micro-discharge channels, the transport of charges, and the excitation, decomposition, and ionization processes of atoms and molecules.
| e + Ar → e + Ar* | (4) |
| Ar* + SF6 → SFx + (6 − x)F + Ar | (5) |
| SF6 + e → SFx + (6 − x)F + Ar | (6) |
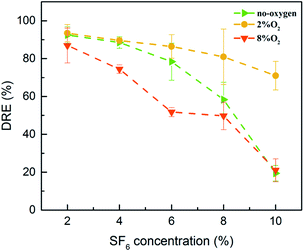
Additionally, Fig. 2 shows that when the concentration of SF6 was 2%, the DREs of the no O2 group and the 2% O2 group were 92.50% and 93.42%, respectively; the DRE of 8% O2 group was slightly lower, 86.93%. These results illustrate that when the concentration of SF6 is low, the auxiliary effect of oxygen is not obvious. As the concentration of SF6 increased, the three curves gradually decreased. When the concentration of SF6 reached 10%, the DREs of no O2 group and 8% O2 group decreased significantly, which was 19.43% and 21.03%, respectively. The DRE of 2% O2 group was much higher than that of the previous two groups, which was 71.00%. This is because SF6 is a strong electronegative gas, and a high concentration of SF6 gas absorbs a large amount of seed electrons (electrons before collision) thereby destroying the removal conditions, resulting in lower DREs.
| SFx + (6 − x)F → SF6 | (7) |
The second stage was the recombination of low-fluorine sulfide and the reaction with O radicals. Low-fluorine sulfides were less stable than SF6, and they could easily combine with F radicals to form SF6,25,26 as shown in eqn (7). When the concentration of SF6 was low, the recombination was not easy to occur because the concentration of SF6 by-products in the reaction zone was also low, and the degradation process of SF6 was much faster than the recombination process. However, as the concentration of SF6 increased, the composite reaction of its products continued to increase. At this point, the recombination must be blocked to achieve better abatement. The addition of O2 blocked the reaction (7), consuming a portion of the low fluoride, such as eqn (19)–(22) and (27), thereby promoting the SF6 decomposition.
Furthermore, Fig. 2 suggests that when the concentration of SF6 was 6–10%, the DRE of 2% O2 group was much higher than that of no O2 group, because the addition of 2% O2 consumed some low-fluorine sulfide. The recombination of SF6 molecules was slowed down, and more SF6 molecules were decomposed, thus obtaining a higher DRE.
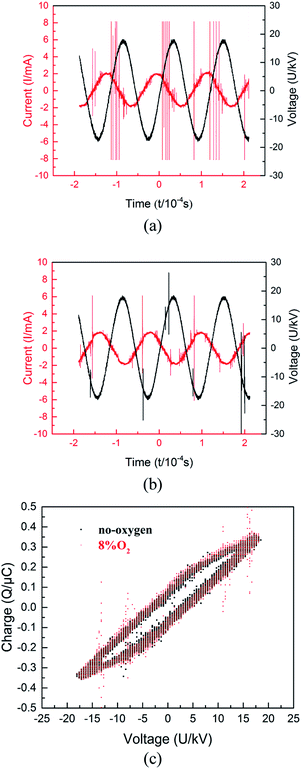
Fig. 3 compared the electrical signals of the no O2 group and the 8% O2 group. The above two figures showed that the phase of the current was ahead of the voltage. This was easy to understand, because the discharge tube was equivalent to a coaxial capacitor, when the air gap was broken down, it could be equivalent to a parallel connection of capacitor and resistance. Moreover, the breakdown of air gap would lead to the distortion of current waveform, because this process made the electrical parameters non-linear. Furthermore, there was no obvious difference between the applied voltage amplitude, but the amplitude and shape of the current waveform were different. Firstly, the current amplitude of 8% oxygen group was slightly smaller than that of no-oxygen group. This might be due to the inhibition of oxygen on discharge, which reduced the charge transfer between electrodes in each discharge cycle. Moreover, it could be seen that the discharge pulse of the no O2 group was more than that of the 8% O2 group, and its amplitude was higher. Therefore, under the same conditions, O2 could weaken the micro-discharge in the reaction tube (the difference in discharge pulse was not obvious when the oxygen concentration was low, so it was not given in this paper). Similar to SF6, this might be because oxygen was also an electronegative gas, which had a good affinity for electrons, and adsorbed a part of free electrons to form negative oxygen ions,27 resulting in a decrease in free electron density in the reaction region. Accordingly, the charge density of the electrode surface was reduced, and the induced voltage generated by the electrode was also reduced, thereby causing the voltage of the gas to rise and the breakdown voltage thereof to rise accordingly. These changes were detrimental to impact ionization within the reaction tube and result in fewer S–F bonds being broken. This also explained the fact that the DRE of the 8% O2 group in Fig. 2 was always the lowest.
Fig. 3(c) shows the Lissajous figures of SF6 abatement at no-oxygen and 8% O2 conditions. The area of the Lissajous figure represents the discharge power in a period and the slope of four edges corresponds to the equivalent capacitance, but as shown in the figure, the addition of oxygen does not change them.22,28,29 The above phenomena illustrate that the external gas has no effect on the electrical parameters of the discharge circuit. That may be due to the difference of electric constant between oxygen, argon and sulfur hexafluoride can be neglected. Therefore, the addition of oxygen does not change the electrical parameters of PBR.
This section analyzed the effect of oxygen concentration on the DREs of SF6. The discharge current waveform of PBRs proves that excess oxygen will affect its discharge process to hinder the decomposition of SF6. In this context, the oxygen concentration is preferably between 0 and 4%, higher than this value is excessive. However, The DREs decreases with the SF6 concentration in the system, the higher concentration of SF6 was not studied in this paper, because too low DRE makes no sense to reduce emissions.
3.2. EY
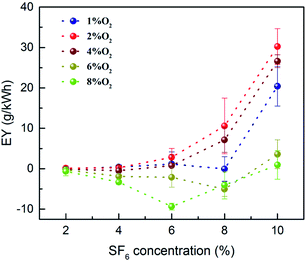
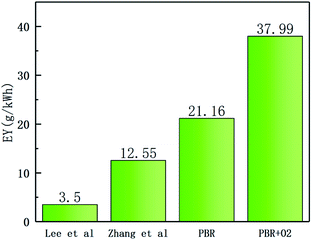
In Fig. 4, the effect of oxygen concentration on EYs of the PBR degradation under different SF6 concentrations is shown. In this paper, EYs were calculated by DREs. In order to facilitate the observation of the effect of oxygen concentration on EY, the EY of the oxygen-containing group was subtracted one by one from the EY of the no O2 group. Fig. 4 demonstrates that the EY of 6% O2 and 8% O2 groups are all below the zero line, indicating that oxygen in this concentration range has a negative impact on the SF6 degradation. Meanwhile, the line diagrams of 1%, 2%, and 4% O2 groups are all located above the zero line. It can be seen that O2 promotes the decomposition of SF6 in this oxygen concentration range. Moreover, when the concentration of SF6 was 6% or less, the promoting effect was not obvious, and the promoting effect was obvious when it was higher than 6%.In this experiment, the highest EY of the no O2 group occurred when the concentration of SF6 was 6%, which was 25.16 g kW−1 h−1; the highest EY of the oxygen-containing group appeared under the condition of 10% SF6 and 2% O2, which was 37.99 g kW−1 h−1. The maximum EY increased by 50.99%. This suggests that the addition of 2% O2 enables the PBR to treat higher concentrations of SF6. Fig. 5 compares the literature,13,14 and the maximum EY obtained in this paper, which shows a significant synergy between the proper amount of oxygen and the PBR.
The flow rate has a great influence on the degradation of SF6. Under the same experimental conditions, the DRE and EY of SF6 at different flow rates were studied.
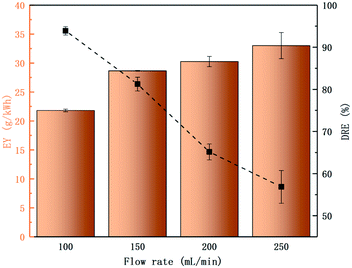
The data presented in Fig. 6 shows that as the flow rate increases, the DRE decreased from 93.90% (100 mL min−1) to 56.86% (250 mL min−1), and the EY increased from 21.81 g kW−1 h−1 (100 mL min−1) to 33.02 g kW−1 h−1 (250 mL min−1). This indicates that SF6 cannot be completely degraded at high flow rates, but the amount of SF6 molecules that were degraded at high flow rates was greater. Within a certain flow rate range (100–250 mL min−1, the corresponding average residence time of the mixed gas is 17.34–5.20 s), the number of SF6 molecules entering the PBR per unit time increased with the increase of flow rate, and the average residence time of each SF6 molecule in the PBR was reduced, which causing a part of SF6 to be discharged out of the tube without reaction, thereby reducing the DRE; but at the same time, a larger number of SF6 molecules are degraded, so that the EY increased.
This section analyzed the EY of the PBR at different oxygen concentrations and flow rates, demonstrating a clear synergistic effect between oxygen and the PBR. However, the high EY obtained was accompanied by a lower DRE, which would become an obstacle to improve EY. Such a situation can be solved by secondary degradation, that is, the degraded exhaust gas is again degraded by PBRs.30,31 Secondly, limited by the size of the device, the PBR used herein is suitable for the abatement of SF6 gas with a flow rate not exceeding 150 mL min−1. To handle larger flows of gas, multiple PBRs can be used in parallel, both of which are the subject of our further research.
3.3. By-products analysis
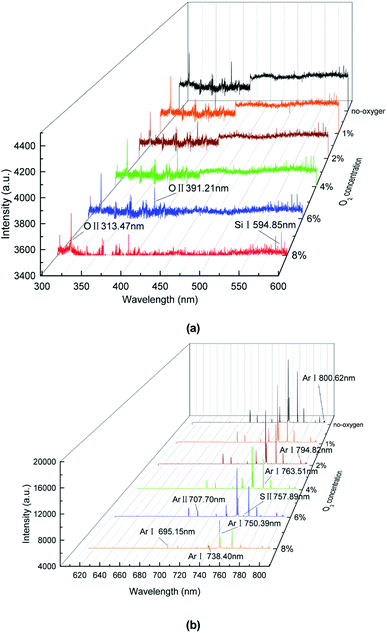
Fig. 7(b) shows the other two elements detected (Ar I 695.15 nm, Ar I 750.39 nm, nm, Ar I 763.51 nm, Ar I 794.82 nm, Ar I 800.62 nm). Compared with other elements, Ar has the highest line emission intensity because argon has the highest proportion of the whole system, reaching over 86%. These lines show that a large amount of argon atoms were excited. When the energy of electrons exceeds 11.5 eV, argon atoms can be excited. Calculations show that, under this condition, the energy of most of the free electrons in the system can exceed this value, so a large number of argon atoms were excited.11Eqn (4) shows the process. In addition, due to the environment noise and the spectrometer error, some spectral lines can not be well diagnosed. We also made a possible analysis of it. Those lines may include O II 313.57 nm, O II 391.51 nm, S II 757.89 and Ar II 707.70 nm. The argon lines have been analyzed previously. In addition, the existence of O radicals may be due to the involvement of oxygen or tube wall (SiO2) in the reaction. Furtherly, the S radicals may be as a result of SF6 molecules decomposition.
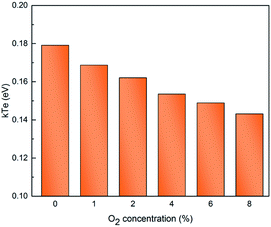
Furthermore, Fig. 7(b) shows the intensity of Ar lines decrease with the oxygen concentration. Because the emission line intensity of the spectral line is proportional to the population density of the excited state involved in the optical emission. Under the local thermal equilibrium condition (LTE), the electron temperature was measured by using the well-known Boltzmann plot:33
 | (8) |
Fig. 8 shows a decreasing trend in the electron temperature with rise of oxygen concentration. Such descending trend in electron temperature may be due to the decline of electrons kinetic energy in the discharge plasma. For atmospheric pressure PBRs, although the mean free path of the electrons within the discharge remains constant, due to an increase in oxygen concentration, electrons are increasingly affected by the adsorption of oxygen molecules, which eventually leads to less and less energetic electrons are available for plasma chemical reaction. Therefore, the oxygen molecules suppress the excitation and ionizing of the neutral plasma species and consequently the electron temperature.
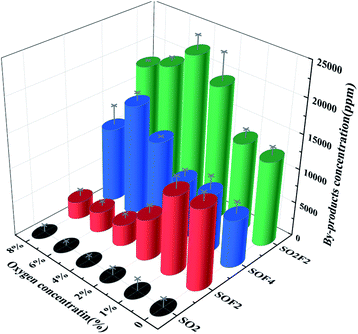
Firstly, the concentration of SO2F2 was the lowest at 12![[thin space (1/6-em)]](https://www.rsc.org/images/entities/char_2009.gif) 444.67 parts per million (ppm) under no O2 conditions. As the oxygen concentration reached 4%, the concentration of SO2F2 reached a maximum of 22
444.67 parts per million (ppm) under no O2 conditions. As the oxygen concentration reached 4%, the concentration of SO2F2 reached a maximum of 22![[thin space (1/6-em)]](https://www.rsc.org/images/entities/char_2009.gif) 385.36 ppm. This may be because the O radicals in the system were capable of oxidizing SOF2, SOF4 and SFX to SO2F2, as shown in eqn (23) and (24). Therefore, as the oxygen concentration boosted, the concentration of SO2F2 also increased. However, as the oxygen concentration further increased, its concentration began to decrease. When the oxygen concentration was 8%, its concentration was only 17
385.36 ppm. This may be because the O radicals in the system were capable of oxidizing SOF2, SOF4 and SFX to SO2F2, as shown in eqn (23) and (24). Therefore, as the oxygen concentration boosted, the concentration of SO2F2 also increased. However, as the oxygen concentration further increased, its concentration began to decrease. When the oxygen concentration was 8%, its concentration was only 17![[thin space (1/6-em)]](https://www.rsc.org/images/entities/char_2009.gif) 873.33 ppm. This might be because as the oxygen became excessive, the EY of the system decreased. As shown in Fig. 4, the amount of handled SF6 molecules was correspondingly reduced, eventually resulting in a decrease in products concentration, which contributed to the decrease of SO2F2.
873.33 ppm. This might be because as the oxygen became excessive, the EY of the system decreased. As shown in Fig. 4, the amount of handled SF6 molecules was correspondingly reduced, eventually resulting in a decrease in products concentration, which contributed to the decrease of SO2F2.
Under the no O2 environment, the concentration of SOF2 was the highest, which was 11![[thin space (1/6-em)]](https://www.rsc.org/images/entities/char_2009.gif) 820.21 ppm. With the increase of oxygen concentration, the concentration continued to decrease. When the oxygen concentration reached 8%, the concentration of SOF2 was only 2538.07 ppm. This indicated that oxygen has an inhibitory effect on the formation of SOF2. It was known from the eqn (21), (22) and (24), Table 3 that SOF2 was mainly formed by reacting a low fluorine sulfide with an O radical, and it could further react with an O radical to form SO2F2. Probably because the secondary oxidation process was faster than the primary oxidation. Therefore, under no O2 condition, the concentration of O radicals in the system was lower, and more SOF2 was generated; as the oxygen concentration increased, more and more SOF2 was further oxidized to form SO2F2, and meanwhile, the concentration of SOF2 would decrease further as the EY decreased.
820.21 ppm. With the increase of oxygen concentration, the concentration continued to decrease. When the oxygen concentration reached 8%, the concentration of SOF2 was only 2538.07 ppm. This indicated that oxygen has an inhibitory effect on the formation of SOF2. It was known from the eqn (21), (22) and (24), Table 3 that SOF2 was mainly formed by reacting a low fluorine sulfide with an O radical, and it could further react with an O radical to form SO2F2. Probably because the secondary oxidation process was faster than the primary oxidation. Therefore, under no O2 condition, the concentration of O radicals in the system was lower, and more SOF2 was generated; as the oxygen concentration increased, more and more SOF2 was further oxidized to form SO2F2, and meanwhile, the concentration of SOF2 would decrease further as the EY decreased.
The concentration of SOF4 slowly increased with increasing oxygen concentration, reaching a maximum value of 15![[thin space (1/6-em)]](https://www.rsc.org/images/entities/char_2009.gif) 975.24 ppm at an oxygen concentration of 6%, and then decreased. From eqn (19)–(20), both SF4 and SF5 could generate SOF4 with O radicals. Meanwhile, it was known from the eqn (23) that the substance can be further oxidized to form SO2F2. Therefore, as the oxygen concentration increased, more and more low-fluorine sulfides were oxidized to form SOF4, but at the same time, some SOF4 was further oxidized. Consequently, overall showing a slow increase in SOF4 concentration. When the oxygen concentration was excessive, the low EY of the system also leaded to a decrease in the concentration of SOF4.
975.24 ppm at an oxygen concentration of 6%, and then decreased. From eqn (19)–(20), both SF4 and SF5 could generate SOF4 with O radicals. Meanwhile, it was known from the eqn (23) that the substance can be further oxidized to form SO2F2. Therefore, as the oxygen concentration increased, more and more low-fluorine sulfides were oxidized to form SOF4, but at the same time, some SOF4 was further oxidized. Consequently, overall showing a slow increase in SOF4 concentration. When the oxygen concentration was excessive, the low EY of the system also leaded to a decrease in the concentration of SOF4.
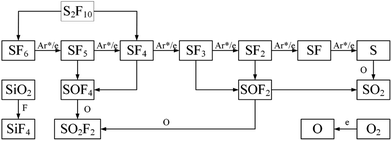
The concentration of SO2 decreased with the increase of oxygen concentration, refer to the reaction eqn (25) and (26). It could be observed that the reaction to generate SO2 was not much, and eqn (25) was the easiest to occur, but at the same time, it was known from eqn (13)–(18) that S radicals are extremely low in the system because only the six S–F bonds of SF6 broken could it generate a S radical. Eqn (26) should be the main generation path of SO2, but as the reactant SOF2 decreased sharply, the SO2 generated by the path also decreases rapidly. The degradation path of SF6 was in Fig. 11.
Fig. 12 shows the selectivity of four products as a function of oxygen concentration during 6% SF6 gas degradation. The selectivity of SO2F2 is always the highest, ranging from 32.93% to 45.43%, because the substance has the highest stability and is the final product of SF6 (as shown in the Fig. 11). The selectivity of SO2 is always low, close to zero, and has been analyzed from its source. The selectivity of SOF2 and SOF4 changed greatly with the increase of oxygen concentration. When the oxygen concentration is less than 2%, the selectivity of SOF2 is greater than SOF4, otherwise, SOF4 is more selective. This may be because when the oxygen concentration is low, the source of O radicals in the system is mainly SiO2. As shown in eqn (29), SiO2 can react with four F radicals to form SiF4 and two O radicals. As the oxygen concentration increases, the concentration of O radicals in the system increases, which undoubtedly inhibits the participation of SiO2, causing the content of SiF4 in the product is relatively reduced, while one SOF4 molecule is capable of immobilizing 4 F atoms. Therefore, SOF4 is more selective at higher oxygen concentrations.
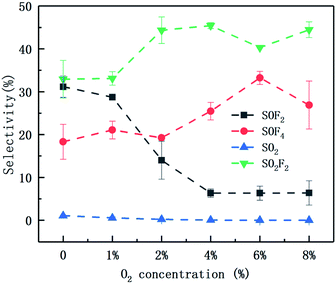 | ||
| Fig. 12 Selectivity of four products under different oxygen concentrations (6% SF6, 110 W, 150 mL min−1). | ||
Table 2 lists the physicochemical properties of several major products. SO2F2, SOF2, SO2, SF4, SOF4 can react with lye (KOH) to form KF and K2SO4, which effectively prevents the products from recombination and can also achieve the further processing of products.35
| Product | Melting point (°C) | Boiling point (°C) | Chemical properties |
|---|---|---|---|
| SO2F2 | −124.7 | –55.4 | Slow hydrolysis in lye |
| SOF2 | −130 | −43.8 | Hydrolysis produces HF (reacts with lye) and SO2 |
| SO2 | −72.7 | −10 | Reaction with lye |
| SF4 | −99.6 | −49.0 | Hydrolysis produces SOF4 |
| SOF4 | −120 | −55.4 | Hydrolysis produces SO2F2 and HF |
| S2F10 | −55 | 29 | Easily decomposed into SF6 and SF4 |
| SiF4 | −90 | −86 | Easy to react with alkali to form silicate |
In this part, the reactive species, electron temperature and products in the degradation process of SF6 were analyzed by emission spectrometer, FTIR and GCMS, and the decomposition path of SF6 in oxygen-containing environment was summarized. The concentration variation and selectivity of four products at different oxygen concentrations were discussed, demonstrating that oxygen participates in the second stage of the SF6 degradation process, that was, the process of combining low-fluoride sulfide with reactive species such as O to form secondary degradation products to affect the decomposition of SF6. The by-products also confirmed that the concentration of the applied gas can also affect the selectivity of the products.
4. Conclusion
In this paper, the degradation of high concentration SF6 by the PBR was carried out at different oxygen concentrations. The synergistic effect of oxygen and the PBR on SF6 degradation was investigated.The results show that an appropriate amount of oxygen in the system can greatly improve the EY of SF6 degradation in the PBR. The highest EY can be obtained when the concentration of SF6 is 10%, which is 37.99 g kW−1 h−1 under the condition of 2% O2. However, when the oxygen in the system is excessive, the degradation effect will be worse than that of the no O2 group. Moreover, the current waveform of PBR also demonstrates that 8% O2 has a weakening effect on the micro-discharge. From the perspective of EY, oxygen concentration within 4% promotes degradation, above which it hinders degradation. Meanwhile, the flow rate can significantly affect the degradation efficiency. In the flow rate range of this paper, the DRE decreases with the increase of the flow rate, and the EY increases with the increase of the flow rate. Furthermore, the exist of active radicals such as Ar and Si suggests the exciting process in the PBR. The intensity of the emission spectra and electron temperature reveal the fact that the addition of oxygen will suppress the collision in the system and weaken the degradation effect. In addition, the products obtained herein mainly include SO2F2, SiF4, SOF2, SOF4, SF4, SO2 and so on. Among the four degradation products (SO2F2, SOF2, SOF4, SO2) of SF6 under all conditions, the highest selectivity is SO2F2, and the lowest selectivity is SO2. The concentration and selectivity of SOF2 and SOF4 are related to the oxygen concentration. When the oxygen concentration does not exceed 2%, the SOF2 selectivity is higher than SOF4 in the degradation process of 6% SF6. Conversely, SOF4 selectivity is higher than SOF2.
It is proved that the EY can be improved and the product selection could be adjusted by controlling the oxygen concentration in the PBR plasma system. This paper provided experimental support for further engineering application of SF6 exhaust gas treatment and better understanding of the effect of oxygen concentration has on the SF6 degradation in a PBR.
Appendix
| No | Reaction | Reaction heat (kcal mol−1) |
|---|---|---|
| (9) | e* + O2→ O + O + e | 112.51 |
| (10) | e* + O2→ O + O− | 90.57 |
| (11) | e* + O2 → O+ + O + 2e | 324.53 |
| (12) | O− → O + e | 21.05 |
| (13) | SF6 → F + SF5 | 86.09 |
| (14) | SF5 → F + SF4 | 41.46 |
| (15) | SF4 → F + SF3 | 97.15 |
| (16) | SF3 → F + SF2 | 53.32 |
| (17) | SF2 → F + SF | 86.18 |
| (18) | SF → F + S | 113.79 |
| (19) | SF5 + O → SOF4 + F | −42.53 |
| (20) | SF4 + O → SOF4 | −126.63 |
| (21) | SF3 + O → SOF2 + F | −77.57 |
| (22) | SF2 + O → SOF2 | −130.89 |
| (23) | SOF4 + O → SO2F2 + 2F | −87.39 |
| (24) | SOF2 + O → SO2F2 | −39.03 |
| (25) | S + 2O → SO2 | −274.71 |
| (26) | SOF2 + O → SO2 + 2F | −68.33 |
| (27) | 2F + O → OF2 | — |
| (28) | S2F10 → SF4 + SF6 | — |
| (29) | SiO2 + 4F → SiF4 + 2O | — |
Conflicts of interest
There are no conflicts to declare.Acknowledgements
This work was supported by the National Natural Science Foundation of China (NSFC, under Grant 51777144) and State Grid Science and Technology Project (SGHB0000KXJS1800554).References
- J. Reilly, et al., Multi-gas assessment of the Kyoto protocol, Nature, 1999, 401(6753), 549–555 CrossRef CAS.
- Y. Li, X. Zhang, S. Tian, S. Xiao, Y. Li and D. Chen, Insight into the decomposition mechanism of C6F12O–CO2 gas mixture, Chem. Eng. J., 2019, 360, 929–940 CrossRef CAS.
- Y. Li, X. Zhang, J. Zhang, S. Xiao, B. Xie, D. Chen, Y. Gao and J. Tang, Assessment on the toxicity and application risk of C4F7N: a new SF6 alternative gas, J. Hazard. Mater., 2019, 368, 653–660 CrossRef CAS PubMed.
- Y. Li, X. Zhang, J. Zhang, X. Cheng, X. Shao, Z. Wang, D. Chen and X. Song, Study on the thermal decomposition characteristics of C4F7N–CO2 mixture as eco-friendly gas insulating medium, High Voltage DOI:10.1049/hve.2019.0032.
- M. Rabie and C. M. Franck, Assessment of eco-friendly gases for elec-trical insulation to replace the most potent industrial greenhouse gas SF6, Environ. Sci. Technol., 2018, 52(2), 369-380 CrossRef PubMed.
- M. Shih, W.-J. Lee and C.-Y. Chen, Decomposition of SF6 and H2S Mixture in Radio Frequency Plasma Environment, Ind. Eng. Chem. Res., 2003, 42, 2906–2912 CrossRef CAS.
- C.-H. Tsai and J.-M. Shao, Formation of fluorine for abating sulfur hexafluoride in an atmospheric-pressure plasma environment, J. Hazard. Mater., 2008, 157, 201–206 CrossRef CAS PubMed.
- X. Song, X. Liu, Z. Ye, J. He, R. Zhang and H. Hou, Photodegradation of SF6 on polyisoprene surface: implication on elimination of toxic byproducts, J. Hazard. Mater., 2009, 168, 493–500 CrossRef CAS PubMed.
- X. Wang, Dielectric Barrier Discharge and Its Application, High Voltage, 2009, 35(1), 1–11 CrossRef CAS PubMed.
- T. Shao, Z. Cheng and W. Ruixue, et al., Atmospheric-pressure pulsed gas discharge and pulsed plasma application, High Voltage., 2016, 42(3), 685–706 CAS.
- X. Zhang, H. Xiao and X. Hu, Effects of Reduced Electric Field on Sulfur Hexafluoride Removal for a Double Dielectric Barrier Discharge Reactor, IEEE Trans. Plasma Sci., 2018, 46(3), 563–570 CAS.
- X. Zhang, H. Xiao and J. Tang, et al., Recent advances in decomposition of the most potent greenhouse gas SF6, Crit. Rev. Environ. Sci. Technol., 2017, 47(18), 1763–1782 CrossRef CAS.
- H. M. Lee, M. B. Chang and K. Y. Wu, Abatement of sulfur hexafluoride emissions from the semiconductor manufacturing process by atmospheric pressure plasmas, J. Air Waste Manage. Assoc., 2004, 54(8), 960–970 CrossRef CAS PubMed.
- X. Zhang, Z. Cui and Y. Li, et al., Abatement of SF6 in the presence of NH3 by dielectric barrier discharge plasma, J. Hazard. Mater., 2018, 360, 341–348 CrossRef CAS PubMed.
- H. L. Chen, H. M. Lee, S. H. Chen and M. B. Chang, Review of Packed-Bed Plasma Reactor for Ozone Generation .and Air Pollution Control, Ind. Eng. Chem. Res., 2008, 47, 2122–2130 CrossRef CAS.
- C. L. Chang and T. S. Lin, Decomposition of Toluene and Acetone in Packed Dielectric Barrier Discharge Reactors, Plasma Chem. Plasma Process., 2005, 25(3), 227–243 CrossRef CAS.
- H. H. Kim, H. Kobara, A. Ogata and S. Futamura, Comparative Assessment of Different Non-thermal Plasma Reactors on Energy Efficiency and Aerosol Formation from the Decomposition of Gas-Phase Benzene, IEEE Trans. Ind. Appl., 2005, 41(1), 206–214 CrossRef CAS.
- H. L. Chen, H.-M. Lee, L. Cheng, M. B. Chang, S. J. Yu and S. Li, Influence of Nonthermal Plasma Reactor Type on CF4 and SF6 Abatements, IEEE Trans. Plasma Sci., 2008, 36(2), 509–516 CAS.
- X. Zhang, Z. Cui, Y. LI, H. Xiao, L. Yi and J. Tang, Study on Degradation of SF6 in the Presence of H2O and O2 Using Dielectric Barrier Discharge, IEEE Access, 2018, 6, 72748–72756 Search PubMed.
- Y. S. Mok and D.-H. Kim, Decomposition of Sulfur Hexafluoride by Using a Nonthermal Plasma-assisted Catalytic Process, J. Korean Phys. Soc., 2011, 59(61), 34–37 Search PubMed.
- M. Y. Naz and S. A. Sulaiman, PTV profiling of particles motion from the top and side of a swirling fluidized bed, J. Instrum., 2016, 11(5), P05019–P05036 CrossRef.
- X. Zhang, X. Hu and Z. Cui, et al., Experimental study on the effect of different background gases on the degradation of SF6 gas by dielectric barrier discharge, J. Electrical. Eng. Technol., 2018, 38(3), 937–946 Search PubMed.
- H. Xiao, X. Zhang and X. Hu, et al., Experimental and simulation analysis on by-products of treatment of SF6 using dielectric barrier discharge, IEEE Trans. Dielectr. Electr. Insul., 2017, 24(3), 1617–1624 CAS.
- X. Zhang, W. Yao and J. Tang, et al., Current Status and Development of Gas Fraction Analysis of SF6 Discharge Decomposition, High Voltage, 2008, 34(4), 664–747 CAS.
- J. Tang, F. Liu and Q. Meng, et al., Partial Discharge Recognition through an Analysis of SF6 Decomposition Products Part 2: Feature Extraction and Decision Tree-based Pattern Recognition, IEEE Trans. Dielectr. Electr. Insul., 2012, 19(1), 37–44 CAS.
- D. Chen, X. Zhang, H. Xiong, Y. Li, J. Tang, S. Xiao and D. Zhang, A first-principles study of the SF6 decomposed products adsorbed over defective WS2 monolayer as promising gas sensing device, IEEE Trans. Device Mater. Reliab., 2019, 19(3), 473–483 CAS.
- H. Xiao, Study on atmospheric pressure dielectric barrier discharge and its synergistic catalytic degradation of SF6 gas, Ph.D thesis, Chongqing University, 2018 Search PubMed.
- T. Butterworth, R. Elder and R. Allen, Effects of particle size on CO2 reduction and discharge characteristics in a packed bed plasma reactor, Chem. Eng. J., 2016, 293, 55–67 CrossRef CAS.
- D. Mei, X. Zhu, Y.-L. He, D. Y. Joseph and X. Tu, Plasma-assisted conversion of CO2 in a dielectric barrier discharge reactor: understanding the effect of packing materials, Plasma Sources Sci. Technol., 2015, 24, 015011 CrossRef CAS.
- H. M. Lee, M. B. Chang and R. F. Lu, Abatement of Perfluorocompounds by Tandem Packed-Bed Plasmas for Semiconductor Manufacturing Processes, Ind. Eng. Chem. Res., 2005, 44, 5526–5534 CrossRef CAS.
- K. R. Ryan and I. C. Plumb, Gas-phase combination reactions of SF4 and SF5 with F in plasmas of SF6, Plasma Chem. Plasma Process., 1988, 8(3), 281–291 CrossRef CAS.
- NIST Atomic Spectra Database Lines Data, [on line], https://physics.nist.gov/cgibin/ASD Search PubMed.
- M. Y. Naz, S. Shukrullah, A. Ghaffar, N. U. Rehman and M. Sagir, A Low-Frequency Dielectric Barrier Discharge System Design for Textile Treatment, Synth. React. Inorg., Met.-Org., Nano-Met. Chem., 2016, 46(1), 104–109 CrossRef CAS.
- R. K. C. Beyer and H. M. H. D. Klockow, Application of infrared spectroscopy to monitoring gas insulated high-voltage equipment: electrode material-dependent SF6 decomposition, Anal. Bioanal. Chem., 2002, 373, 639–646 CrossRef PubMed.
- J. Wang, Decomposition gas and treatment of sulfur hexafluoride, Chem. Propellants Polym. Mater., 2003, 1(6), 16–18 Search PubMed.
Footnote |
| † Electronic supplementary information (ESI) available. See DOI: 10.1039/c9ra05629g |
| This journal is © The Royal Society of Chemistry 2019 |

