 Open Access Article
Study on the growth and morphology evolution of titanium oxide clusters in molten iron with molecular dynamics simulation
Likun
Yang
 a,
Wei
Zhang
ab,
Liang
He
a,
Huigai
Li
*a and
Shaobo
Zheng
*a
a,
Wei
Zhang
ab,
Liang
He
a,
Huigai
Li
*a and
Shaobo
Zheng
*a
aState Key Laboratory of Advanced Special Steel, Shanghai Key Laboratory of Advanced Ferrometallurgy, School of Materials Science and Engineering, Shanghai University, Shanghai 200444, China. E-mail: lihuigai@shu.edu.cn; sbzheng@staff.shu.edu.cn
bShanghai Institute of Applied Physics, Chinese Academy of Sciences (CAS), Shanghai 201800, China
First published on 14th October 2019
Abstract
Formation of nano-scale titanium oxides is a desirable result in the deoxidation process of steelmaking. However, the nucleation of nano-scale titanium oxide inclusions remains unknown up to now because of the difficulty in observing and detecting inclusions in steel melt. In this work, we studied the formation and evolution of titanium oxygen clusters in molten iron by molecular dynamics (MD) simulation using empirical atomic interaction potentials. The structures of small titanium oxygen clusters in iron are reasonable compared to the first-principles simulation results. The growth process of small clusters into larger clusters was simulated and it is found the clusters grow through the collision mechanism, with the intermediate products exhibiting chain structures. The iron environment was found to play an important role in the structural form of the titanium oxygen clusters. This study is useful to provide the details of formation and the growth mechanism of titanium oxygen clusters and to provide a valuable picture for the nucleation mechanism of titanium oxide in molten steel.
1. Introduction
Titanium is a widely used deoxidizing element in molten steel.1 Titanium and dissolved oxygen react to form titanium oxide during refining in the steelmaking process. The stoichiometric ratio and structure of titanium oxides depend on the ratio of titanium and oxygen concentrations in molten steel.2 Titanium oxides with a certain size and structure are effective nucleation sites for sulfides,3 nitrides,4 and intragranular acicular ferrite.5 With the aim of effectively controlling the precipitation behaviour of this kind of favorable and fine titanium oxide, it is necessary to study the growth and morphology evolution of titanium oxide clusters in molten steel. However, it is difficult to observe the nucleation process of oxides directly through experimental approaches in molten steel because of the high temperature. We tried to use a MD simulation method to reproduce this process.Regarding the nucleation process, the classical nucleation theory does not explain the existence of pre-nucleation clusters in liquid, but it was proved from CaCO3 solution,6 Fe–O–Al melt,7–10 and Fe–O–Al–Mg melt11 that the pre-nucleation clusters do exist and rearrange to form nuclei. In our previous work, Dan Zhao et al.12 studied the detailed nucleation process of titanium oxides in Fe–Ti rapid solidified alloy. Through atomic probe tomography characterization, we confirmed that the nucleation of titanium oxides includes two steps: (1) “TiO” basic units aggregated and formed (TiO)n clusters; (2) O atoms were absorbed in and around the clusters and the clusters evolved into different nuclei of titanium oxides depending on the titanium and oxygen concentrations in molten steel. This is the experimental basis for the two-step nucleation of titanium oxides. Bao et al.13 proposed the possible growth pathway of titanium oxide clusters by calculating the formation energy of different (TiO)n structures in a 4 × 4 × 4 iron matrix using first-principles calculation. They calculated the interaction force between atoms using DFT method, but the size of the simulation systems that can be treated is limited to hundreds of atoms. Classical MD method with empirical atomic potential can treat systems of much larger size, typically up to 106–109 atoms, thus it provides a way to investigate the growth process of pre-nucleation clusters.
Researchers mostly focused on the study of titanium oxide nanoclusters structure14–16 or titanium oxide nucleation.17 The structure and growth mechanism of titanium oxide cluster before nucleation in molten iron is obscure. In this work, the melting point of iron was normalized to determine the simulated temperature. Then the evolution of titanium oxygen (TixOy, x and y represent the number of titanium and oxygen atoms) clusters were simulated in molten iron with titanium concentrations between 0.02% and 1.00%. Cluster identification and reverse tracking of the atomic trajectory were utilized to trace the evolution of the TixOy clusters in molten iron. Finally, we explored the effect of molten iron on the structure of TixOy clusters, which provides a possibility to continue to explore the formation of the critical nucleation of titanium oxides.
2. Method
2.1. Simulation setup
All simulations were carried out using MD simulation code LAMMPS.18 Periodic boundary condition was used and the time step for integration is 1 fs. The key factor for MD simulation is the interaction potential between atoms. To model the interaction of Ti–O system, we chose the Ti–O potential function derived from the defect oxygen in metal titanium.19 Pencer et al.20 used this potential to accurately predict elastic constants of hcp titanium with and without interstitial oxygen solute. The Fe–O potential function came from Zhou's result.21 Jeon et al.22 employed this potential to studied the surface oxide film growth on Al–Ni–Fe alloys. Fe–Ti interaction was depicted by the potentials of EAM (embedded-atom method) format.232.2. Determination of simulated temperature
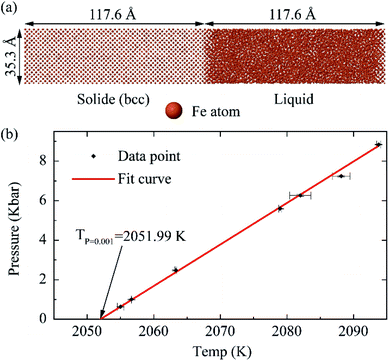
The melting temperature of iron described by the potential is essential for studying the growth and evolution of TixOy clusters in the case of high temperature molten iron. The melting point was calculated according to Morris' method,24 the coexisting system with solid and liquid phase was established under isothermal–isobaric (NPT) ensemble, as shown in Fig. 1(a), which consists of 23![[thin space (1/6-em)]](https://www.rsc.org/images/entities/char_2009.gif) 040 iron atoms.
040 iron atoms.
We changed the temperature and pressure to ensure that the system has solid–liquid coexistence under the microcanonical ensemble (NVE) after relaxed for 10 ns. The temperature of the solid–liquid coexisting system was taken as the Fe–Ti–O potential melting point (Tpot). The Tpot under different pressures were shown in Fig. 1(b). The Tpot = 2051.99 K was obtained by linear fitting under the pressure of P = 1 bar.
The Tpot value was normalized to actual melting temperature in the simulation (Ts) using the following formula:
 | (1) |
2.3. The potential function verified by small TixOy clusters
The titanium atoms are substituted atoms26 and oxygen atoms27,28 are octahedral interstitial atoms in matrix iron. Different numbers of titanium and oxygen atoms were inserted into perfect bcc Fe supercell, and the geometrical structures of small (TiO)n clusters were optimized using Fe–Ti–O potential. The energetically favored structures of (TiO)n (n ≤ 3) are shown in Fig. 2(a)–(c). These structures of small (TiO)n (n ≤ 3) clusters are similar to those obtained using the first-principle method in our previous work.13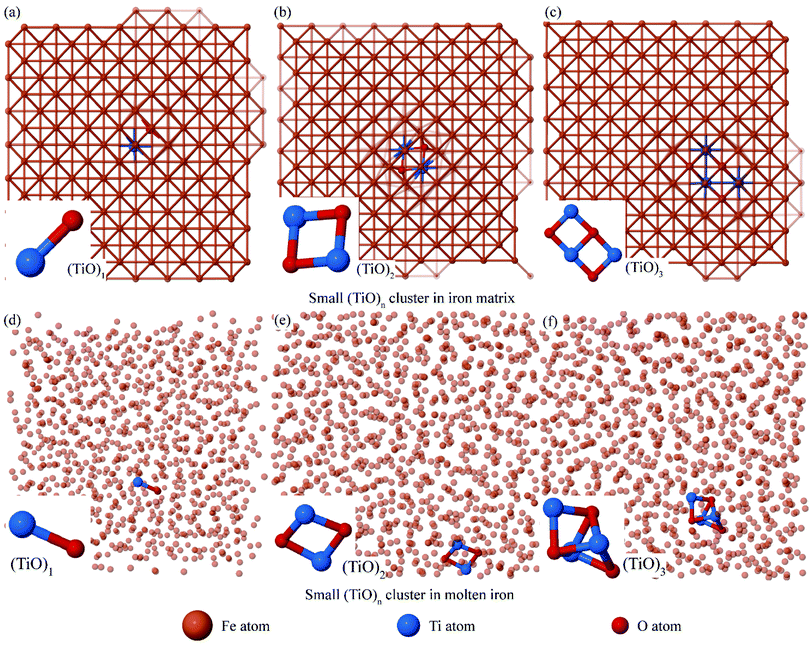 | ||
| Fig. 2 Small (TiO)n clusters were optimized in an 8 × 8 × 8 iron supercell. (a)–(c) The (TiO)n cluster structure was established at 0 K. (d)–(f) (TiO)n cluster structure was optimized at Ts = 2122 K. | ||
The atomic coordinates of (TiO)n clusters were extracted in Fig. 2(a)–(c), and then put in disordered molten iron for relaxation so as to verify the evolution of cluster at 2122 K. We found that the two structures (TiO)1 and (TiO)2 can exist stably in molten iron (shown in Fig. 2(d) and (e)). The structure (TiO)3 in Fig. 2(c) converts into a stereoscopic structure at 2122 K as shown in Fig. 2(f). We calculated the bond length of Ti–O, which is from 2.01 Å to 2.19 Å. It is reasonable compared to the experiment value (1.96 Å (ref. 29)) in rutile.
The titanium and oxygen atoms in structures in Fig. 2(a)–(c) were restricted at substitutional sites and octahedral interstitial sites in iron lattice in perfect bcc Fe supercell. Whereas titanium and oxygen obtained sufficient kinetic energy from high-temperature environment, and the liquid iron in disordered state could not restrict titanium and oxygen atoms, the structure in Fig. 2(c) evolved into more stereoscopic structure in Fig. 2(f).
2.4. Calculation process and analysis method
As a result of low content of titanium and oxygen in steel, the probability of titanium and oxygen atoms collision in molten steel is low. If free titanium and oxygen atoms are inserted into iron matrix, they will form small size TixOy clusters in a limited simulation scale. Experimental results of APT by Zhao Dan et al.12 showed that the ratio of Ti and O atoms is 1![[thin space (1/6-em)]](https://www.rsc.org/images/entities/char_2009.gif) :
:![[thin space (1/6-em)]](https://www.rsc.org/images/entities/char_2009.gif) 1 in the structure of TixOy clusters in steel. In this study, we inserted some pairs of (TiO)1 structure instead of free titanium and oxygen atoms in molten iron.
1 in the structure of TixOy clusters in steel. In this study, we inserted some pairs of (TiO)1 structure instead of free titanium and oxygen atoms in molten iron.
The concentration of titanium and oxygen can influence the titanium oxide structure. Four systems with different titanium and oxygen contents (shown in Table 1) in molten iron were simulated. The concentrations of titanium and oxygen in group (a) are 199.9 ppm and 66.1 ppm, respectively, similar with the parameters before deoxidation of titanium in actual steelmaking. The titanium and oxygen concentration in other three groups are higher than those in actual production, but the maximum concentration is not more than 1%.
| Group (a) | Group (b) | Group (c) | Group (d) | |
|---|---|---|---|---|
| Iron number | 85![[thin space (1/6-em)]](https://www.rsc.org/images/entities/char_2009.gif) 730 730 |
85![[thin space (1/6-em)]](https://www.rsc.org/images/entities/char_2009.gif) 550 550 |
85![[thin space (1/6-em)]](https://www.rsc.org/images/entities/char_2009.gif) 250 250 |
84![[thin space (1/6-em)]](https://www.rsc.org/images/entities/char_2009.gif) 750 750 |
| (TiO)1 number | 20 | 200 | 500 | 1000 |
Using PACKMOL,30 a package for building initial configurations in MD simulation, we constructed a 35 × 35 × 35 supercell (10.29 nm × 10.29 nm × 10.29 nm). Iron atoms and (TiO)1 structures (shown in Fig. 2(d)) distributed randomly in the supercell (shown in Fig. 3(a)). This periodic cell was relaxed for 0.01 ns at 0 to 2500 K to obtain overheating molten iron (hysteresis phenomenon31). Subsequently, the cell was relaxed for 0.02 ns from 2500 to Ts = 2122 K. In the above two processes, the (TiO)1 structures were fixed. Finally, the restriction on the (TiO)1 structure was released, and the system was relaxed for 60 ns at 2122 K, the pair distribution function of molten iron at 2122 K matched with the experiment.32 All these three processes were simulated with NVT ensemble. Fig. 3 shows the simulation details.
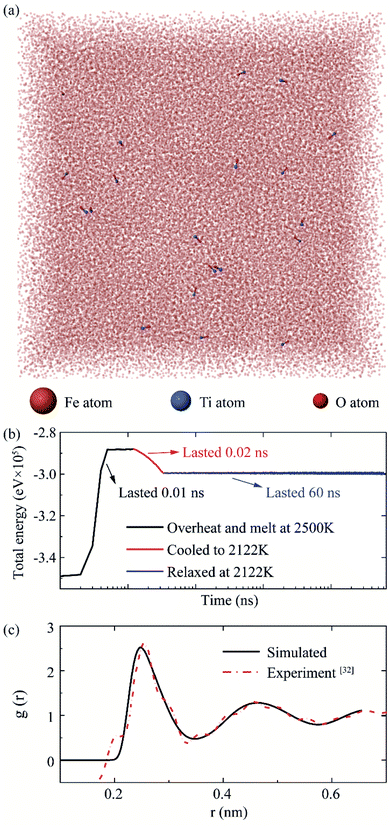 | ||
| Fig. 3 The MD simulation process for (TiO)1 structure in iron supercell. The group (a) in Table 1 as an example. (a) The atoms configurational snapshots before calculation. (b) The relationship between system total energy and time. (c) The pair distribution function of molten iron at 2122 K. | ||
Since many atomic clusters were involved in the evolution process and it was difficult to manually count the numbers of clusters and atoms in simulation, we developed a computer algorithm to analyse the TixOy clusters.
3. Results and discussion
3.1. The growth of TixOy cluster
As has been known that, the stable structures of TixOy clusters at high temperature is different from the cluster structures optimized at 0 K (discussed in Sec. 2.3). We inserted the molecular ion structure (TiO)1 into molten iron and relaxed the Fe–Ti–O ternary system at 2122 K. The aggregation process of TixOy cluster in molten iron can be studied from the number of clusters and its time evolution.In Fig. 4(a), in the first 1 ns, the numbers of clusters (N) decreased by 5, 141, 408 and 869 in groups (a), (b), (c) and (d), respectively. The TixOy clusters aggregated to form larger clusters, resulting in a reduction in the number of clusters. From 10 ns to 60 ns, the numbers of clusters decreased by 0.06, 0.22, 0.28 and 0.4 clusters per nanosecond. The TixOy cluster's aggregation rate was much slower in the 10–60 ns time range than that in the first 1 ns. More particularly, the higher the concentration of titanium and oxygen in molten iron, the faster the rate of cluster aggregation. Even though there coexists new clusters formation and cluster decomposition process, the above dynamic TixOy clusters in molten iron grew rapidly at the beginning period and then grew steadily.
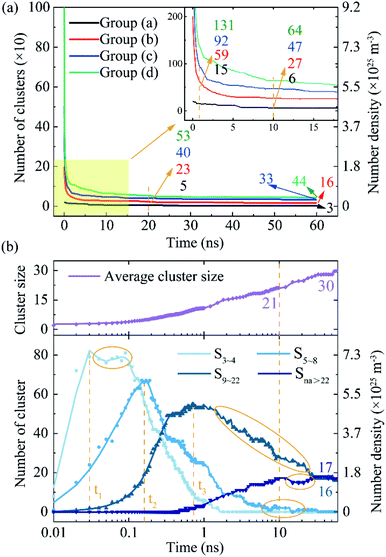 | ||
| Fig. 4 The aggregation process of TixOy clusters and TixOy clusters size distribution. (a) The number of TixOy clusters vs. time. Among the four colored curves, the initial number of clusters is 20, 200, 500 and 1000, respectively (shown in Table 1). (b) TixOy clusters size distribution as a function of time. The dots represent the calculated data points while the lines represent smoothed fit to these values, t1 (0.03 ns), t2 (0.15 ns) and t3 (0.7 ns) correspond to the time at the peak of cluster size. | ||
Fig. 4(b) combines the TixOy clusters size distribution to analyse the clusters growth. We take group (c) as an example (blue curve in Fig. 4(a)). Group (c) has an appropriate number of titanium and oxygen atoms, and the cluster aggregation law is representative and applicable to other groups. The number density of clusters (ncluster) was obtained as the number of clusters divided by the simulation system volume (V):
| ncluster = N/V | (2) |
We tracked the evolution of the TixOy clusters, then counted the TixOy cluster size distribution at different times. The cluster with n atoms is denoted as Sn, the average cluster size (Cavg_size) in molten iron was defined as follows:
| Cavg_size = Stotal/N | (3) |
It was noteworthy that the curves show fluctuation (the yellow circle in Fig. 4(b)). As the energy fluctuates, the TixOy clusters decompose to form small-sized clusters, indicating that there were decomposition and aggregation in unnucleated TixOy clusters. The average size of the clusters constantly increased (the purple curve in Fig. 4(b)). With the formation of new cluster and cluster decomposition, the cluster grew toward larger dimensions.
The growth process of the TixOy clusters can be restore from clusters size distribution (shown in Fig. 4(b)). The cluster size that appeared first was S3–4. The number of TixOy clusters with size in range of 3 ≤ na ≤ 4 increased with time till reaching a limiting value at time t1 = 0.03 ns (see Fig. 4(b), S3–4 curve). With the advancing of time, the number of clusters S3–4 was consumed and reduced and the number of clusters S5–8 increased. As time process, the size distribution range became larger and larger, the number of small clusters decreased while the number of large clusters increased (see Fig. 4(b), S5–8 and S9–22 curve).
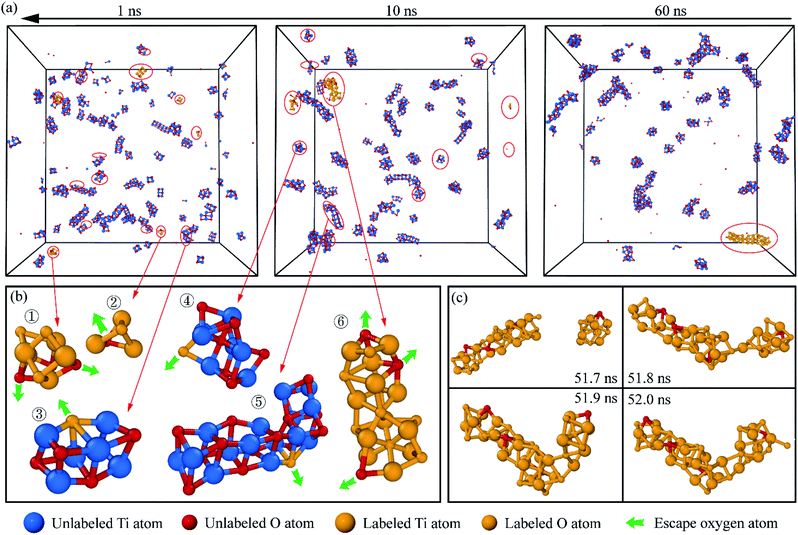
It should be mentioned that the large size TixOy clusters needed a long time to grow up. As time processed, the number density of TixOy clusters decreased which led to a decrease in the probability of cluster aggregation. It's worthwhile to further explore the growth path of TixOy clusters before nucleation. We chose one of the TixOy clusters at the end of simulation, then marked the titanium and oxygen atoms in this TixOy cluster and reverse tracked the atomic trajectory to obtain the atomic coordinates of the labeled atoms, we could ascertain the way of TixOy cluster growth. This method was implemented in the open visualization tool OVITO33 package. The results were shown in Fig. 5.
It can be seen from Fig. 5 that there were some small TixOy clusters containing a large number of labeled titanium and oxygen atoms at 1 ns (see Fig. 5(b)① and ②). These TixOy clusters collided together in molten iron and formed bigger clusters at 10 ns. The process of collision between two clusters was shown in Fig. 5(c).
Some TixOy clusters contained a small number of labeled oxygen atoms (yellow balls in the unlabeled clusters in Fig. 5(b)③–⑤). The labeled TixOy clusters also contained a small number of unlabeled oxygen atoms (red balls in the labeled clusters Fig. 5(b)⑥ and (c)). These oxygen atoms might detach from the labeled TixOy clusters after a period of movement and merged into other TixOy clusters or into molten iron. TixOy clusters would compete with iron and other TixOy structures to absorb oxygen atoms. This phenomenon indicates that the TixOy clusters will adjust the structure due to energy fluctuations before nucleation.
Collision is the fastest way for clusters to grow up, but it is limited by the density of clusters, which affects the collision probability. The dissociation of oxygen atoms can lead to positive growth and negative growth of TixOy clusters. Zhang et al.34 calculated the process of nucleation of primary inclusion and found that the collision make a huge contribution to cluster growth when the cluster size is less than 10 nm.
3.2. Morphology evolution of TixOy clusters
The process of cluster aggregation and growth becomes clear according to the above discussion. The TixOy clusters were classified according to the number of titanium and oxygen atoms at t1 = 0.03 ns, t2 = 0.15 ns and t3 = 0.7 ns in group (c) (peak position of S3–4, S5–8 and S9–22 in Fig. 4, respectively). We counted the number of different types of TixOy clusters and found that TixOy clusters with a stoichiometric Ti![[thin space (1/6-em)]](https://www.rsc.org/images/entities/char_2009.gif) :
:![[thin space (1/6-em)]](https://www.rsc.org/images/entities/char_2009.gif) O ratio of 1
O ratio of 1![[thin space (1/6-em)]](https://www.rsc.org/images/entities/char_2009.gif) :
:![[thin space (1/6-em)]](https://www.rsc.org/images/entities/char_2009.gif) 1 occupied the majority of all clusters. The proportion of (TiO)n (n ≤ 11, Ti
1 occupied the majority of all clusters. The proportion of (TiO)n (n ≤ 11, Ti![[thin space (1/6-em)]](https://www.rsc.org/images/entities/char_2009.gif) :
:![[thin space (1/6-em)]](https://www.rsc.org/images/entities/char_2009.gif) O = 1
O = 1![[thin space (1/6-em)]](https://www.rsc.org/images/entities/char_2009.gif) :
:![[thin space (1/6-em)]](https://www.rsc.org/images/entities/char_2009.gif) 1) clusters were listed in Table 2. The evolution process of TixOy cluster structure was explored by comparing the change of cluster proportion.
1) clusters were listed in Table 2. The evolution process of TixOy cluster structure was explored by comparing the change of cluster proportion.
![[thin space (1/6-em)]](https://www.rsc.org/images/entities/char_2009.gif) :
:![[thin space (1/6-em)]](https://www.rsc.org/images/entities/char_2009.gif) O does not equal to 1
O does not equal to 1![[thin space (1/6-em)]](https://www.rsc.org/images/entities/char_2009.gif) :
:![[thin space (1/6-em)]](https://www.rsc.org/images/entities/char_2009.gif) 1 in TixOy clusters
1 in TixOy clusters
| Time | t 1 | t 2 | t 3 |
|---|---|---|---|
| (TiO)2 Pct | 74 | 41 | 9 |
| (TiO)3 Pct | 18 | 28 | 12 |
| (TiO)4 Pct | 5 | 16 | 12 |
| (TiO)5 Pct | 2 | 8 | 21 |
| (TiO)6 Pct | N | 1 | 11 |
| (TiO)7 Pct | N | 1 | 8 |
| (TiO)8 Pct | N | N | 4 |
| (TiO)9 Pct | N | 1 | 1 |
| (TiO)10 Pct | N | N | 1 |
| (TiO)11 Pct | N | N | 4 |
| Others Pct | 1 | 4 | 17 |
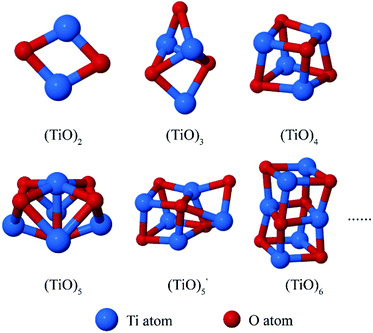
It has been found that the (TiO)n (2 ≤ n ≤ 6) accounted for the majority at the peak TixOy clusters size distribution. We have extracted the atomic coordinates of the (TiO)n (2 ≤ n ≤ 6) clusters in Fig. 6 to show the cluster structures.
The structures of (TiO)2 and (TiO)3 were the same as discussed in 2.3 Section. The structure of (TiO)4 was the first complete cubic-like structure. When n = 5, (TiO)5 and  clusters coexisted in molten iron. The energy of the
  structure was 2.81 eV higher than that of (TiO)5 structure. This proved that (TiO)5 was more stable than
  . When n ≥ 6, the (TiO)n clusters would evolve to chain-like structures (as shown in Fig. 5(b) and (c)).
Xiang et al.35 obtained two types of (TiO)n clusters using the ab initio calculations: cubic-like structure and ring-like structure. They found that the ring-like structures are more stable than cubic-like structures as the size of clusters increasing. The cluster structures in Fig. 6 were similar to the cubic-like structure showed in Xiang's result.35 With the effect of high temperature and iron atoms, the cubic-like structure was easier to form than the ring-like structure when n < 6.
Fig. 7 shows the atomic coordinates after the energy minimization. Comparing the four images, the difference in the concentration of titanium and oxygen atoms affects the amount and size of the TixOy clusters. But there is not much difference in cluster structure. Where the structures of TixOy clusters are mostly chain-like as shown in Fig. 7②, ③, ⑤, ⑦ and ⑧, branched structure as shown in Fig. 7④ and ⑨, cubic-like structure as shown in Fig. 7① and ⑥. The length of the longest cluster ⑥ is about 5 nm, and the length of other clusters are about 0.5 nm to 3 nm. Demichelis36 observed stable prenucleation clusters from early stages of calcium carbonate formation, the prenucleation clusters consist of chains, branches and rings, which can fold and coil like a polymer. But we did not find the folding phenomenon of chain-like or branched structures in molten iron.
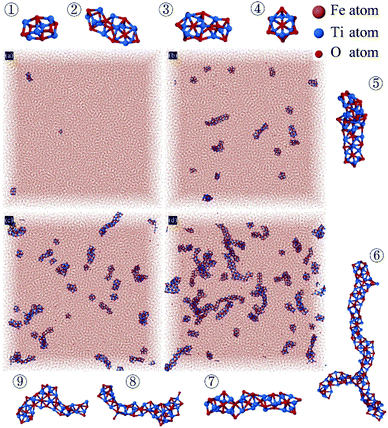 | ||
| Fig. 7 Atomic coordinates snapshots in simulation box after energy minimization and typical species of TiO structures observed in simulation. (a)–(d) Correspond to systems with different concentration of Ti and O corresponding to Table 1. Illustration ①–⑨ are some typical cluster structures observed in the system. | ||
3.3. Effect of molten iron on TixOy clusters structure
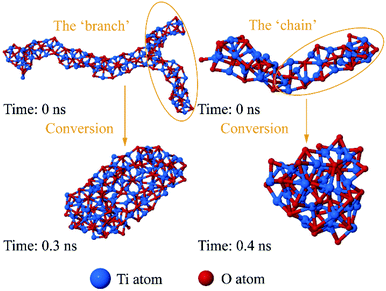
Many researchers studied the structural evolution process of particles, ignoring the influence of environment. But the influence of the matrix on the cluster structure cannot be ignored. To find out the effect of molten iron on the structure of TixOy clusters, we extracted some chain-like and branched structure's (shown in Fig. 7) atomic coordinates to explore their optimal structures without iron atoms at 2122 K. We examined plenty of clusters and displayed typical structural evolutions in Fig. 8.The ‘branch’ and the ‘chain’ in TixOy clusters folded without iron atoms obstruction, and evolved into near-spherical or cage structures. These chain-like and branched structures can be regarded as dynamic structure. The dynamic structures can constantly evolve but the iron atoms hindered the structures from folding and coiling. It is possible that the interactions between Fe–Ti37,38 and Fe–O39 makes titanium and oxygen atoms difficult to move freely, which can be seen from the interfacial energy between Fe and TixOy clusters. As for how these chain-like structures grow to form critical nuclei in molten steel, the question remains to be further studied.
4. Conclusions
The formation of TixOy clusters before nucleation is clarified by MD simulations of the Fe–Ti–O system in the actual smelting process for up to 60 ns. The structure of small (TiO)n clusters obtained by MD was compared with the results of first-principles calculation, ensuring the applicability of the atomic interaction potential. Fe–Ti–O system with titanium concentrations between 0.02% and 1.00% was simulated to prove that the concentration will affect TixOy cluster aggregation rate and size. Visual inspection, cluster identification and reverse tracking of the atomic trajectory were employed to explore the growth process and morphology evolution of TixOy cluster before nucleation. The detailed conclusions are as follow:(1) TixOy clusters appear a size distribution variation with time, clusters of a certain size are dominant during a certain amount of time, as time process, the size of the largest number of clusters will become larger. As the energy fluctuates, a part of TixOy cluster will decompose into small clusters, but average cluster size keeps increasing.
(2) Collision is the main way for TixOy cluster to grow up in molten iron, in the meantime, oxygen atoms will detach from the TixOy cluster or merge into another TixOy cluster due to the competition between iron and titanium atoms.
(3) When the number of atoms in TixOy clusters is greater than 3 but less than 12, cluster structure with Ti to O stoichiometric ratio of 1![[thin space (1/6-em)]](https://www.rsc.org/images/entities/char_2009.gif) :
:![[thin space (1/6-em)]](https://www.rsc.org/images/entities/char_2009.gif) 1 holds the largest proportion, which are cubic-like structure.
1 holds the largest proportion, which are cubic-like structure.
(4) When TixOy cluster grows, larger cluster has a dynamic chain structure. The ‘chain’ or ‘branch’ structure in TixOy cluster will fold and coil without the influence of molten iron, and evolved into near-spherical or cage structures.
Conflicts of interest
We declare that we do not have any commercial or associative interest that represents a conflict of interest in connection with this work.Acknowledgements
This work is supported by Open Project of State Key Laboratory of Advanced Special Steel, Shanghai University. We also thank High Performance Computing Center, Shanghai University for the technical support. The authors would like to express gratitude to Prof. Yongquan Wu for the valuable discuss and suggestions.Notes and references
- J. I. Takamura and S. Mizoguchi, The Sixth International Iron and Steel Congress, Nagoya, 1990, vol. 5 Search PubMed.
- L. Huigai, W. Chunfeng, Z. Dan, Z. Shaobo and Z. Qijie, Shanghai Met., 2011, 33, 36–39 Search PubMed.
- C. C. Zheng, X. M. Wang, S. R. Li, C. J. Shang and X. L. He, Sci. China: Technol. Sci., 2012, 55, 1556–1565 CrossRef CAS.
- J. H. Park, Calphad, 2011, 35, 455–462 CrossRef CAS.
- W. Z. Mu, P. G. Jonsson and K. Nakajima, J. Mater. Sci., 2016, 51, 2168–2180 CrossRef CAS.
- A. F. Wallace, L. O. Hedges, A. Fernandez-Martinez, P. Raiteri, J. D. Gale, G. A. Waychunas, S. Whitelam, J. F. Banfield and J. J. De Yoreo, Science, 2013, 341, 885–889 CrossRef CAS.
- W. Masamitsu and S. Nobuo, ISIJ Int., 2007, 47, 627 CrossRef.
- K. Wasai and K. Mukai, Metall. Mater. Trans. B, 1999, 30, 1065–1074 CrossRef.
- G. C. Wang, Q. Wang, S. L. Li, X. G. Ai and D. P. Li, Acta Metall. Sin., 2015, 28, 272–280 CrossRef CAS.
- G. C. Wang, Q. Wang, S. L. Li, X. G. Ai and C. G. Fan, Sci. Rep., 2014, 4, 5082 CrossRef CAS.
- N. Zong, Y. Liu and P. He, RSC Adv., 2015, 5, 48382–48390 RSC.
- D. Zhao, W. Q. Bao, H. G. Li, S. B. Zheng and K. C. Chou, J. Alloys Compd., 2018, 744, 797–800 CrossRef CAS.
- W. Q. Bao, W. Zhang, H. G. Li, S. B. Zheng and Q. J. Zhai, RSC Adv., 2017, 7, 52296–52303 RSC.
- T. Albaret, F. Finocchi and C. Noguera, Appl. Surf. Sci., 1999, 144–45, 672–676 CrossRef.
- Z.-w. Qu and G.-J. Kroes, J. Phys. Chem. C, 2007, 111, 16808–16817 CrossRef CAS.
- W. Meng-Hsiung, C. Chuan and J. Shin-Pon, Chin. J. Catal., 2009, 30, 384–390 CrossRef.
- O. L. G. Alderman, L. B. Skinner, C. J. Benmore, A. Tamalonis and J. K. R. Weber, Phys. Rev. B: Condens. Matter Mater. Phys., 2014, 90, 094204 CrossRef.
- S. Plimpton, Fast Parallel Algorithms for Short-Range Molecular Dynamics, 1995 Search PubMed.
- W. J. Joost, S. Ankem and M. M. Kuklja, Modell. Simul. Mater. Sci. Eng., 2014, 23, 015006 CrossRef.
- J. Pencer, E. Torres, J. Alexander and D. D. Radford, Comput. Mater. Sci., 2016, 125, 110–116 CrossRef CAS.
- X. W. Zhou and H. N. G. Wadley, J. Phys.: Condens. Matter, 2005, 17, 3619–3635 CrossRef CAS.
- B. Jeon, S. K. Sankaranarayanan and S. Ramanathan, J. Phys. Chem. C, 2011, 115, 6571–6580 CrossRef CAS.
- F. Streitz and J. Mintmire, J. Adhes. Sci. Technol., 1994, 8, 853–864 CrossRef CAS.
- J. R. Morris and X. Song, J. Chem. Phys., 2002, 116, 9352–9358 CrossRef CAS.
- J. P. Kruth, L. Froyen, J. Van Vaerenbergh, P. Mercelis, M. Rombouts and B. Lauwers, J. Mater. Process. Technol., 2004, 149, 616–622 CrossRef CAS.
- Y. Jiang, J. R. Smith and G. R. Odette, Phys. Rev. B: Condens. Matter Mater. Phys., 2009, 79, 064103 CrossRef.
- A. Claisse and P. Olsson, Nucl. Instrum. Methods Phys. Res., Sect. B, 2013, 303, 18–22 CrossRef CAS.
- Y. Wang, Z. Pan, Y. Ho, Y. Xu and A. Du, Nucl. Instrum. Methods Phys. Res., Sect. B, 2001, 180, 251–256 CrossRef CAS.
- O. Alderman, L. Skinner, C. Benmore, A. Tamalonis and J. Weber, Phys. Rev. B: Condens. Matter Mater. Phys., 2014, 90, 094204 CrossRef.
- L. Martínez, R. Andrade, E. G. Birgin and J. M. Martínez, J. Comput. Chem., 2009, 30, 2157–2164 CrossRef.
- S. Z. Chavoshi, S. Z. Xu and S. Goel, Proc. R. Soc. A, 2017, 473, 20170084 CrossRef.
- Z. Qijie, Fundamentals of structure refinement technology for metal solidification, Science Press, China, 2018, pp. 9–11 Search PubMed.
- A. Stukowski, Modell. Simul. Mater. Sci. Eng., 2010, 18, 2154–2162 Search PubMed.
- L. Zhang, W. Pluschkell and B. G. Thomas, Nucleation and growth of alumina inclusions during steel deoxidation, 85th Steelmaking Conference, 2002, vol. 85, pp. 463–476 Search PubMed.
- J. Xiang, X. Yan, Y. Xiao, Y. Mao and S. Wei, Chem. Phys. Lett., 2004, 387, 66–69 CrossRef CAS.
- R. Demichelis, P. Raiteri, J. D. Gale, D. Quigley and D. Gebauer, Nat. Commun., 2011, 2, 590 CrossRef.
- A. Sutton and W. Hume-Rothery, The London, Edinburgh, and Dublin Philosophical Magazine and Journal of Science, 1955, 46, 1295–1309 CrossRef CAS.
- J. L. Murray, Bull. Alloy Phase Diagrams, 1981, 2, 320–334 CrossRef.
- J. Byggmästar, M. Nagel, K. Albe, K. Henriksson and K. Nordlund, J. Phys.: Condens. Matter, 2019, 31(21), 215401 CrossRef.
| This journal is © The Royal Society of Chemistry 2019 |

