 Open Access Article
Novel and green synthesis of a nanopolymer and its use as a drug delivery system of silibinin and silymarin extracts in the olfactory ensheathing cells of rats in normal and high-glucose conditions
Sabah Shiriab,
Naser Abbasi*bc,
Kamal Alizadeh *a and
Elahe Karimib
aDepartment of Chemistry, Lorestan University, Khorramabad, 6813717133, Iran. E-mail: alizadehkam@yahoo.com; alizadeh.k@lu.ac.ir; Fax: +98-66-33120612; Tel: +98-66-33120612
bBiotechnology and Medicinal Plants Research Center, Ilam University of Medical Sciences, Ilam, Iran. E-mail: abbasi-n@medilam.ac.ir; Fax: +98-84-32223081; Tel: +98-84-3223081
cDepartment of Pharmacology, Medical School, Ilam University of Medical Sciences, Ilam, Iran
First published on 27th November 2019
Abstract
Drug delivery systems have been of interest to researchers. The effects of synthesized nano-polymers as silibinin and silymarin extract drug delivery systems on olfactory ensheathing cells under normal and high-glucose conditions were studied. The structure of the nanopolymer was characterized by IR, HNMR, GPC, DLS, and AFM. The toxicity was evaluated by an MTT assay. The production of ROS and the generation of NO were evaluated by a probe of fluorescein diacetate and Griess methods, respectively. The expressions of the protein levels of ILK, VEGF, BDNF, and NGF were investigated by western blotting. The polymer size was between 50 and 150 nm. The loading capacities for silibinin and silymarin were 68.5% and 56.4%, respectively, and the drug release for them was estimated at 54.1% and 50.8%, respectively. In high-glucose conditions, the cells were protected (EC50 = 4.88 ± 0.5 μM) by silibinin and nanopolymer in low concentrations by reducing the amount of ROS and NO, maintaining ILK, reducing VEGF and increasing NGF and BDNF. Incubation with silibinin and nanopolymer at high concentrations increased cell death with LC50 = 57.36 ± 2.5 and 43.18 ± 1.8 μM, respectively, in high-glucose states. Thus, the cells were protected by silibinin and nanopolymer in protective concentrations by reducing the amount of ROS and NO, maintaining ILK, reducing VEGF, and increasing BDNF and NGF. The mentioned mechanisms were totally reversed at high concentrations.
1. Introduction
Diabetic polyneuropathy (DPN) is a common disorder of peripheral neurons. The earliest symptoms of DPN can be the loss of sensory terminals in target organs.1 The subsequent changes due to DPN may lead to changes in gene expressions.2Nowadays, polymers are widely used as biomaterials due to their favorable properties such as good biocompatibility, non-toxicity, easy design and preparation, a variety of structures and interesting bio-mimetic character.3 Especially, in the field of smart drug delivery, polymers play a significant role because they can deliver therapeutic agents directly into the intended site of action with superior efficacy.4 The drug delivery systems should possess some important features such as a pre-scheduled rate as well as self-controlled, targeted, predetermined time and delivery monitoring.5 A smart drug delivery system enhances the polymer nanoparticles to a better stage in its therapy regimen.6 The controlled release of drugs at the site of action is a key issue for nanoparticle carriers.7 Recently, the drug delivery systems to reduce blood glucose in diabetics has been considered.8 The advantages of this drug delivery system are increased solubility in blood, prolonged drug exposure time, selective drug delivery to the target, improved therapeutic outcome, decreased toxic effects, and low drug resistance.9 However, the most important concept to consider while designing a drug delivery system is a way to overcome toxicity.10 One strategy to overcome this shortcoming is to use polyester dendrimers, which have been shown to be non-toxic and biocompatible.11–13 By attaching a drug to a suitable carrier, it is possible to enhance its aqueous solubility, target certain tissues, improve drug transit, and decrease drug metabolism.14,15 Citric acid is a cheap and biocompatible compound that is used on a large scale in the food and drug industries.16 Glycerol is a key component in the synthesis of phospholipids.17 Oleic acid is a fatty acid that exists naturally in various animals and vegetable fats and oils and is classified as a monounsaturated omega-9 fatty acid.18,19 Nanopolymers with citric acid and glycerol building blocks can be synthesized through step-by-step melting polycondensation.20
Silibinin is the major active component of silymarin. Silibinin is the mixture of two diastereomers: silibinin A and silibinin B. Both in vitro and animal studies suggest that silibinin has anti-hepatotoxicity properties.21
The olfactory nerve is the only cerebral nerve where its olfactory neurons have an unlimited lifetime.11 Olfactory ensheathing cells (OECs) are high-capacity stem cells and Schwann cells that are only found in the CNS and peripheral nervous system (PNS), respectively.22 In this study, the neurotrophic effects of polymers synthesized as silibinin and silymarin extract carriers at various concentrations in OECs in normal (NG) and high-glucose (HG) conditions were investigated.
2. Materials and methods
2.1. Plant extraction and identification of silibinin by HPLC
The fruit of Silybum marianum was gathered from the Ilam Province and dried at room temperature in shadow. The silibinin standard (Sigma) and acetonitrile solvent (Merck) were prepared. The dried seeds of Silybum marianum were powdered and 50 g of powder was poured into thimbles and located into Soxhlet (HM6-500 England model) by using 600 ml acetonitrile (90 percent) at 90 °C within 3 h in order to extract the Flavonolignans. Then, 600 ml of the yellow solution was placed into a rotary (IKA-Germany) for an hour with around 30 at 50 °C in order to evaporate acetonitrile. After that, the extract was placed in an oven to dry for three days at 40 °C. The amount of extract gained was 2.730 g (5.46 percent). To identify and measure the amount of silibinin available in silymarin extract, HPLC (platin blue model from Knauer German Company, DAD detector, HGP pump, and C18 column) was used. The peaks obtained from the silymarin extract were compared with that of silibinin standard. A stock solution of silibinin standard was prepared in HPLC-grade methanol, filtered and further diluted in the same solvent to obtain 10, 20, 40, 80, 120 and 150 μM solutions. Two prepared samples of silymarins extract as well as 1![[thin space (1/6-em)]](https://www.rsc.org/images/entities/char_2009.gif) :
:![[thin space (1/6-em)]](https://www.rsc.org/images/entities/char_2009.gif) 50, 1
50, 1![[thin space (1/6-em)]](https://www.rsc.org/images/entities/char_2009.gif) :
:![[thin space (1/6-em)]](https://www.rsc.org/images/entities/char_2009.gif) 100 which they had been diluted in order to precipitate of the impurities were centrifuged and then filtered. Two prepared concentrations were injected into HPLC individually. Water and acetonitrile in the ratio of 65
100 which they had been diluted in order to precipitate of the impurities were centrifuged and then filtered. Two prepared concentrations were injected into HPLC individually. Water and acetonitrile in the ratio of 65![[thin space (1/6-em)]](https://www.rsc.org/images/entities/char_2009.gif) :
:![[thin space (1/6-em)]](https://www.rsc.org/images/entities/char_2009.gif) 35 with 1 ml min−1 flow and 287 nm wavelength were used as the mobile phase. The samples were identified and measured. Then, the chromatogram curve of each sample was drawn.
35 with 1 ml min−1 flow and 287 nm wavelength were used as the mobile phase. The samples were identified and measured. Then, the chromatogram curve of each sample was drawn.
2.2. Preparation of the citric acid–glycerol nanopolymer and citric acid–glycerol–oleic acid nanopolymer
Citric acid–glycerol nanopolymer (CGNP) was synthesized via esterification polymerization according to the reported procedure.13 By using citric acid (CA) (Carlo Erba) as the AB3 monomer and glycerol (G) (Carlo Erba) as the A3 monomer at different CA/G molar feed ratios, the nano branching polymers (NP) were synthesized through melting polycondensation. CA monohydrate and G were mixed in a polymerization ampule equipped with a gas inlet, vacuum inlet, magnetic stirrer at 90 °C and heated to 110 °C for 20 min under constant stirring. Then, the temperature was increased to 120 °C, and the mixture was stirred at this temperature for 30 min. The mixture was also stirred at 130, 140, 145, and 150 °C for 40, 40, 50, and 60 min, respectively, under vacuum to remove the water formed during the reaction. The mixture was then kept at room temperature to cool down, and the product was dissolved in THF and filtered to obtain a clear solution. Next, the solution was concentrated under reduced pressure, and the product was precipitated in n-hexane several times. The precipitated compound was dialyzed against THF for 4 h. It was dissolved in THF (10 ml) and then placed in a dialysis bag immersed in THF (150 ml). Then, the whole system was left at room temperature and at predetermined time intervals, THF in the outside medium of the dialysis bag was replaced with a fresh solvent. Dialysis was continued for 4 h and then, the contents of the dialysis bag were put into a reaction flask. Finally, THF was evaporated under reduced pressure to obtain the pure product as a colorless and viscous compound. In the second step, citric acid–glycerol–oleic acid nanopolymer (CGONP) was synthesized. First, 3 g CGNP was poured into a polymerization capsule and then, 192 μl oleic acid was added. After that, they were heated at 90, 100, 120, 140, and 160 °C and set in 1000 rpm magnetic stirrer for 5 h under a vacuum condition. CGONP and oleic acid were washed by n-hexane; as a result, extra oleic acid was produced. Washing was repeated two times, and reaction accomplished. In the next step, the remaining CGONP was washed in 20 ml ethanol and retaliation accomplished in order to completely remove extra n-hexane and ethanol. The produced polymer and ethanol solvent were put into a dialysis bag at room temperature for 4 h to separate any reacted molecules from the polymer, and purification was accomplished.2.3. Chemical characterizations
![[thin space (1/6-em)]](https://www.rsc.org/images/entities/char_2009.gif) :
:![[thin space (1/6-em)]](https://www.rsc.org/images/entities/char_2009.gif) 35 v/v). The flow rate was set at 1 ml min−1. The column temperature, injection volume, and detection wavelength were set at 30 °C, 1 μl, and 287 nm, respectively.
35 v/v). The flow rate was set at 1 ml min−1. The column temperature, injection volume, and detection wavelength were set at 30 °C, 1 μl, and 287 nm, respectively.2.4. Primary cell culture
The ethical approval for this study was obtained from the Animal Care and Ethics Committee (ACEC) of the Ilam University of medical science (IR.MEDILAM.REC.1397.86). According to ACEC recommendations, we tried our best to minimize animal pain and suffering during research. To minimize the effects of transportation-induced physiological changes in subsequent biomedical research, it is advisable to consider two factors. According to the first factor, in the present study, it was noted that the animal transfer according to the physiological conditions in accordance with international protocols with the least stress to the animal was carried out; according to the second factor, in general, mediators of the stress response to reach the desired conditions (for example, for 24 h) were considered. The cultured cells were exposed to NG (glucose 5.5 mM), HG (glucose 30 mM) or mannitol (30 mM) at 24, 48, and 72 and 48 h.
2.5. MTT assay
The cell viability and toxicity were measured using the 3-(4,5-dimethylthiazol-2-yl)-2,5-diphenyltetrazolium bromide color reduction test, which was performed to determine the cytotoxic effect of the drug delivery system at different concentrations. This method is based on the ability of surviving cells to metabolize yellow tetrazolium salt (MTT) to purple formazan crystals by mitochondrial dehydrogenases.32,33 The cells were plated onto 96-well flat-bottom culture plates with different concentrations (20, 40, 80, 120 μm) of silibinin, CGONP-silibinin (NP-S), CGONP-extract (NP-E) and extract. All cultures were incubated for 24, 48, and 72 h at 37 °C in a humidified incubator. After 24, 48, and 72 h treatment, 10 μl of MTT reagent was added to each well. The plates were incubated for 4 h. Absorbance was measured at 595 nm with an ELISA reader (Spectra MAX; Molecular Devices, USA).2.6. Determination of reactive oxygen species (ROS)
The intracellular H2O2 levels were determined by measuring the fluorescent probe 2′,7′-dichlorofluorescein diacetate (DCFH-DA).34 The cells were incubated in 10 μm DCFH-DA at 37 °C for 30 min and were analyzed by a fluorescent plate reader (Biotek-FLx800). DCF fluorescence was assessed at 485 nm excitation and 520 nm emissions. ROS production was determined from the H2O2 standard curve (10–200 nm).2.7. Assay of nitric oxide (NO) levels
The amount of nitrite, the final product of NO generation, was assessed by Griess reaction.35 The cells (3 × 10⁴ cells per well) were seeded in 96-well plates and pre-incubated with glucose (5.5 and 30 mM) containing 5% CO2 at 37 °C for 48 h.2.8. Investigating the expression of ILK, BDNF, VEGF and NGF proteins by western blot
OECs were prepared in lysis buffer (137 mM NaCl, 20 mM Tris–HCl pH 8.0, 1% NP-40, 10% glycerol, 1 mM phenylmethyl sulfonic fluoride, 10 μg ml−1 aprotinin, 1 μg ml−1 leupeptin, and 0.5 mM sodium vanadate). Homogenates were centrifuged at 12![[thin space (1/6-em)]](https://www.rsc.org/images/entities/char_2009.gif) 500 rpm for 20 min at 4 °C, and the supernatants were stored at 70 °C. The total protein content was measured according to the Micro BCA procedure (Pierce. Rockford, IL, USA). An equal amount (3000 μg) of protein from each sample was loaded onto 10% polyacrylamide gels for sodium dodecyl sulfate-polyacrylamide gel electrophoresis. Proteins were electrotransferred to polyvinylidene difluoride (PVDF) membranes, which were then blocked with 5% skim milk and 0.1% Tween-20 in Tris-buffered saline at room temperature for 1 h. The membranes were incubated with primary antibodies, followed by appropriate anti-primary IgG horseradish peroxidase-conjugated secondary antibodies. Chemiluminescence detection of the immunocomplexes was performed using the ECL kit (Amersham Pharmacia Biotech Inc., Piscataway, NJ, USA) according to the manufacturer's instructions, and the results were then quantified using Gel-Pro analyzer imaging software (Bio-Rad, USA). Protein analysis was performed with antihuman ILK (ab-76468, Priab 1/5000, Sec ab 1/2000), VEGF, BDNF (SAB4300702, 1:750, Sigma), NGF (ab – P5498, Priab 1/500, Sigma).
500 rpm for 20 min at 4 °C, and the supernatants were stored at 70 °C. The total protein content was measured according to the Micro BCA procedure (Pierce. Rockford, IL, USA). An equal amount (3000 μg) of protein from each sample was loaded onto 10% polyacrylamide gels for sodium dodecyl sulfate-polyacrylamide gel electrophoresis. Proteins were electrotransferred to polyvinylidene difluoride (PVDF) membranes, which were then blocked with 5% skim milk and 0.1% Tween-20 in Tris-buffered saline at room temperature for 1 h. The membranes were incubated with primary antibodies, followed by appropriate anti-primary IgG horseradish peroxidase-conjugated secondary antibodies. Chemiluminescence detection of the immunocomplexes was performed using the ECL kit (Amersham Pharmacia Biotech Inc., Piscataway, NJ, USA) according to the manufacturer's instructions, and the results were then quantified using Gel-Pro analyzer imaging software (Bio-Rad, USA). Protein analysis was performed with antihuman ILK (ab-76468, Priab 1/5000, Sec ab 1/2000), VEGF, BDNF (SAB4300702, 1:750, Sigma), NGF (ab – P5498, Priab 1/500, Sigma).
2.9. Statistical analysis
All the experiments were carried out in triplicates (n = 3), and the statistical analysis between different treatments or groups was done using a t-test. The analysis of variance (two-way ANOVA) and the data were presented as mean ± S.D. A probability p-value of less than 0.05 was considered to be statistically significant. The terms half-maximal effective concentration (EC 50) and half-maximal lethal concentration (LC 50) refer to the concentration of a chemical, drug or toxic substance that produces a response halfway between the baseline and maximum after a specified exposure time.3. Results
3.1. Characterization of CGNP and CGONP
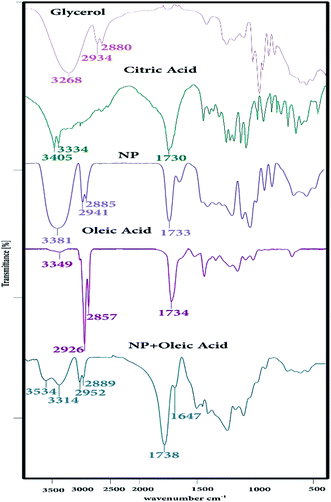
The IR spectrum of CGNP and CGONP compounds is shown in Fig. 1. The peak at 1647 cm−1 can be associated with the C–O (–C–OH) stretching vibration. The strong peak at 1738 cm−1 was attributed to the C![[double bond, length as m-dash]](https://www.rsc.org/images/entities/char_e001.gif) O stretching vibration and the broad peak at 3314 cm−1 was assigned to O–H stretching frequency, indicating the presence of hydroxyl groups.36 The FT-IR spectra of glycerol, citric acid, CGNP, oleic acid, and CGONP are shown in Fig. 1. The spectrum of CGNP compared to those of citric acid and glycerol showed important shifts. Two bands corresponding to the O–H and –COOR groups were exhibited at 3381 and 1733 cm−1. We observed in the spectrum of CGNOP that the intensity of O–H decreased in comparison to that of O–H of CGNP, and the intensity of –COOR increased in comparison to the intensity of –COOR of CGNP. The strong peaks at 1738 cm−1 and 3534 cm−1 demonstrated the validity of our claim.
O stretching vibration and the broad peak at 3314 cm−1 was assigned to O–H stretching frequency, indicating the presence of hydroxyl groups.36 The FT-IR spectra of glycerol, citric acid, CGNP, oleic acid, and CGONP are shown in Fig. 1. The spectrum of CGNP compared to those of citric acid and glycerol showed important shifts. Two bands corresponding to the O–H and –COOR groups were exhibited at 3381 and 1733 cm−1. We observed in the spectrum of CGNOP that the intensity of O–H decreased in comparison to that of O–H of CGNP, and the intensity of –COOR increased in comparison to the intensity of –COOR of CGNP. The strong peaks at 1738 cm−1 and 3534 cm−1 demonstrated the validity of our claim.
The 1H NMR spectrum of CGNP is shown in Fig. 2a; it has five peaks of five kinds of hydrogens. Peak H1 concerns single hydrogen (–CH) of glycerol that emerges in one multiple at 3.8 ppm. Peaks H2 and H3 are ascribed to the –CH2 hydrogen of glycerol that appear as two doublet peaks at 2.3–2.6 ppm. Peaks H4 and H5 correspond to the –CH2 hydrogen of citric acid that appear as a single peak at 4.7 ppm. The 13C NMR spectrum of CGNP presented in Fig. 2b shows six kinds of carbon. Peaks C1, C2 and C3 are related to glycerol and appear at 73.4 and 62.5 ppm. Peaks C4 and C5 correspond to two equivalent carbons of the fourth kind that emerge at 164.3 ppm. Peak C9 is ascribed to the carbon of the fourth kind that appears at 171.9 ppm and holds the most shifts. Peaks C7 and C8 emerge at 14.1 ppm; peak C6 due to its connection with the hydroxyl group appears at 43.6 ppm.
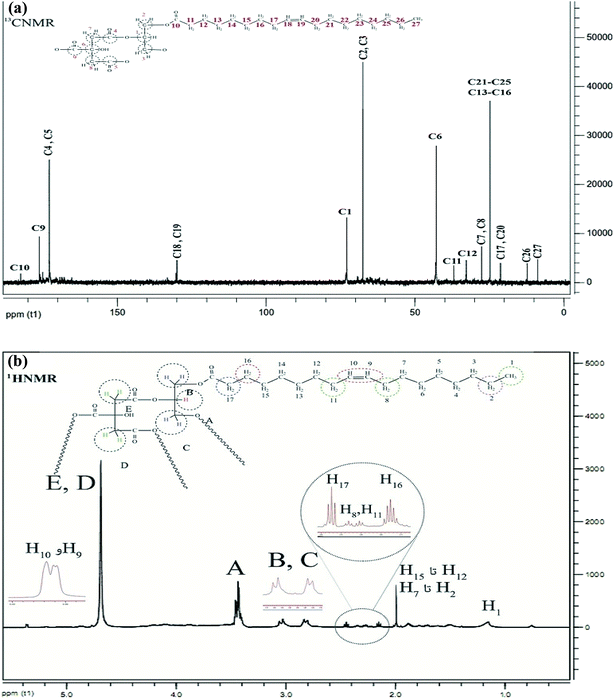
The 1H NMR spectrum of CGONP is represented in Fig. 3a. The peaks A to E are related to the part CGNP of the molecule that is interpreted in Fig. 3b. It is noteworthy that these peaks show some mobility in comparison to the primary molecule.
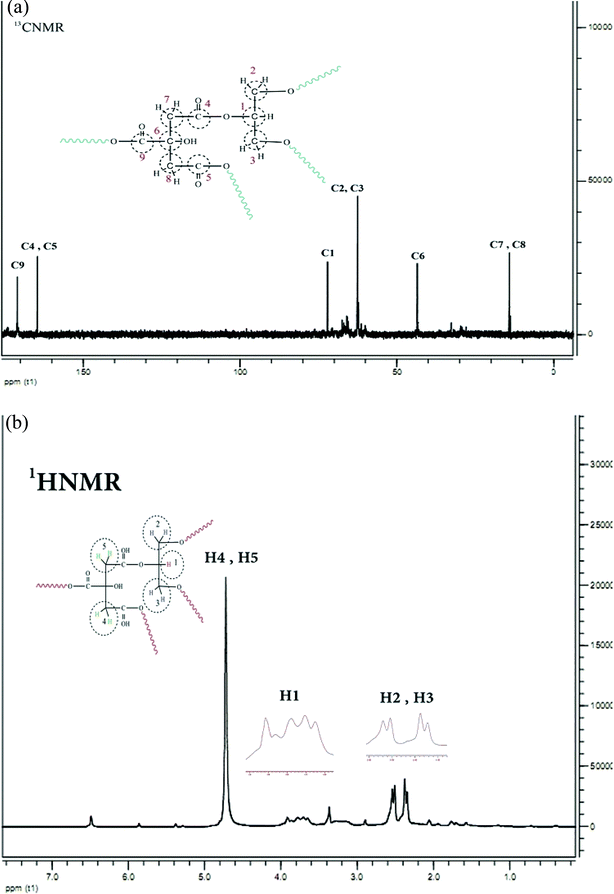 | ||
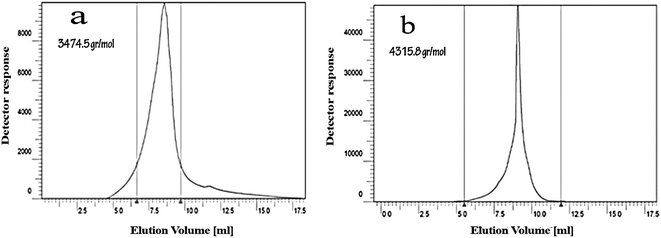
| Fig. 3 (a) 13C NMR spectrum of CGONP in D2O. (b) 1H NMR spectrum of CGONP in D2O. The molecular weight was determined using Knauer gel permeation chromatography (GPC). The obtained molecular weight (Mw) for CGNP was about 3474.5 g mol−1 (Fig. 4a). After adding oleic acid, the molecular weight of CGONP increased and became about 4315.8 g mol−1 (Fig. 4b). | ||
H1 is related to the hydrogens of the methyl group, which is reported to have mobility at 1.2 ppm. Hydrogens H2 to H7 and H12 to H15 represent a single peak at 1.9 ppm as they are equivalent. Hydrogens H8 and H11 appear as triplet peaks at 2.3–2.4 ppm. H16 appears as a multiple peak at 2.1–2.2 ppm and H17 appears at 2.4–2.5 ppm with a little more mobility. Finally, the hydrogens of binary bonds with more mobility emerge at 5.35 ppm.
The 13C NMR spectrum of CGNOP is displayed in Fig. 3a. The interpretation of the 13C NMR spectrum of CGNOP is represented in Fig. 3b. C10 is the carbon of the carbonyl group in the combination with oleic acid, which appears at 183 ppm with the most mobility. C18 and C19 show two peaks at 131 ppm, which are related to the carbons of the binary bonds. C13 to C16 and C21 to C25 are equivalent carbons in the carbon chain of oleic acid that emerge as a peak at 23 ppm. C27 is a carbon in the methyl group with the least mobility at 9 ppm. C26 and C17 to C20, C12 and C11 appear at 13 ppm, 21 ppm, 33 ppm, and 39 ppm, respectively.
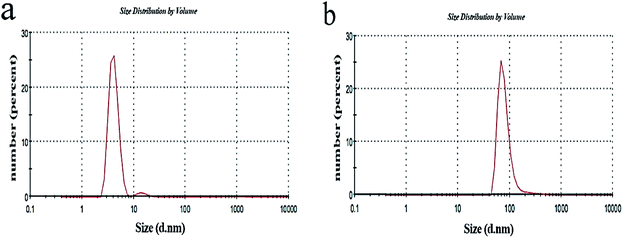
Fig. 5 shows the DLS diagrams (zeta size ZS, Malvern Instruments) for CGNP and CGONP. The peak indicates the fact that there is also a particle size of the sample solution larger than 150 nm, but the diameter of most particles is estimated to be about 150 nm (PDI = ((402.768/200))2 = 4.05) according to the chart, which is a good measure for drug delivery.
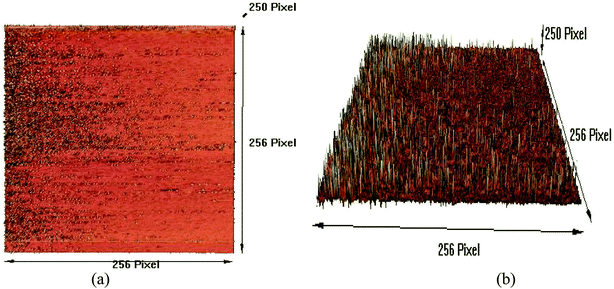
For a high-resolution synthetic CGONP topographical study, the AFM images of the CGONP sample are presented for 2D and 3D surface morphologies in Fig. 6a and (b), respectively. As seen, in these images, the nano-polymers are needle-shaped and completely confirm the information obtained from the DLS images, determining the size of the nano-polymers to be about 50 to 150 nm.
3.2. Extraction and identification
The silibinin HPLC chromatogram was obtained as a standard broad peak with a retention time of 3.817 min at a wavelength of 287 nm. In the same conditions, the standard chromatogram of the methanol extract of silymarin was similar to that of standard silibinin in 3.817 min (Fig. 7a and b). Well-separated peaks were obtained for silibinin in the silymarin extract compared to that for its respective standards, as shown in Fig. 7. The quantitative analysis revealed that silibinin was found to be predominant in the methanol fraction (2.64 mg g−1 of silibinin) of the silymarin extract. The assay method was validated and the calibration curve was linear (R2 = 0.9999, Y = 178399X − 4122.01).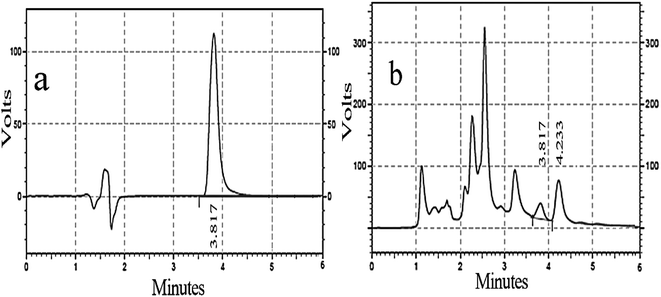 | ||
Fig. 7 (a) Silibinin standard of chromatogram with 120 μM concentration; (b) silymarin chromatogram with 1![[thin space (1/6-em)]](https://www.rsc.org/images/entities/char_2009.gif) : :![[thin space (1/6-em)]](https://www.rsc.org/images/entities/char_2009.gif) 100 μM concentration. 100 μM concentration. | ||
3.3. Investigation of the loading and releasing capacity of CGONP
The loading capacity of silibinin into CGONP was investigated by HPLC. The standard curve of free silibinin was obtained and used to calculate the loaded silibinin into CGONP. According to the HPLC results, by using a linear equation, the loading capacities of CGONP for loading silibinin and silymarin extract were 68.5% and 56.4%, respectively. The calibration curve in six different concentrations (10, 20, 40, 80, 120, 150 μM) of the silibinin standard exhibited good correlation with the equation Y = 9913.7X + 221232. The r-square value of the calibration curve was 0.9988, which confirmed the linearity of the method. The release of silibinin and silymarin extract was estimated at 54.1% and 50.8%, respectively. The percentage of loading capacity and release was calculated using the following formulas:| Release (%) = (amount of silibinin released/initial concentration of silibinin loaded) × 100 |
| The percentage of drug loading efficiency = the amount of the drug loaded/total amount of drug added × 100 |
3.4. The effects of CGONP-silibinin (CGONP-S) and CGONP-extract (CGONP-E)
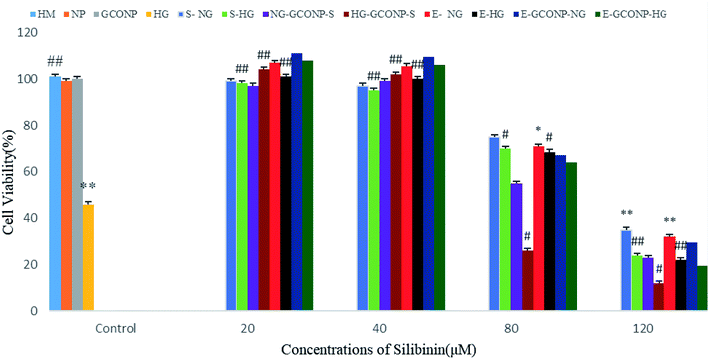
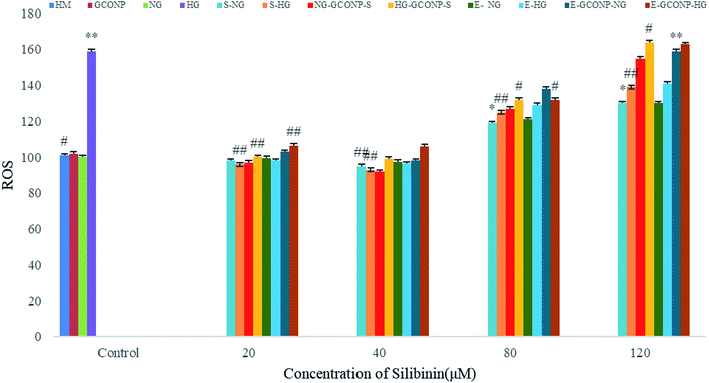
According to Fig. 8, CGONP-S and CGONP-E at concentrations of 20 and 40 μM and free CGONP did not have any significant effect on cell death. However, the cells incubated with silibinin, CGONP-S, CGONP-E, and extract (E) (80, 120 μM) showed low cell viability (p < 0.001 vs. control) in both the NG and HG states. Treatments with silibinin at low concentrations (20, 40 μM) prevented cell death with EC50 = 4.88 ± 0.5 μM and at high concentrations, reduced cell viability with LC50 = 57.36 ± 2.5 in the NG state was observed. Under the HG condition, treatments with high concentrations (80, 120 μM) reduced the cell viability with LC50 of 43.18 ± 1.8.As shown in Fig. 9, silibinin, CGONP-S, CGONP-E, and extract at 80 and 120 μM significantly increase the intracellular H2O2 levels (P < 0.001 vs. control), but the incubation of the cells with free silibinin and silymarin extract at the same concentrations (80, 120 μM) does not significantly increase the intracellular H2O2 levels. Also, 20 and 40 μM silibinin, CGONP-S, CGONP-E, extract (E), and free CGONP did not increase intracellular reactive oxygen species (ROS).
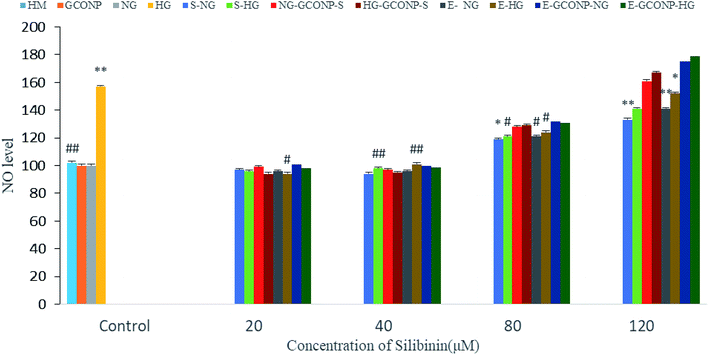
NO production was significantly reduced by silibinin, CGONP-S, CGONP-E, and extract (E) at the concentrations of 20 and 40 μM in OECs (P < 0.001 vs. control); however, NO release was reduced after treatments by high concentrations of silibinin, CGONP-S, CGONP-E, and extract (E) in both NG and HG-treated OECs (Fig. 10).
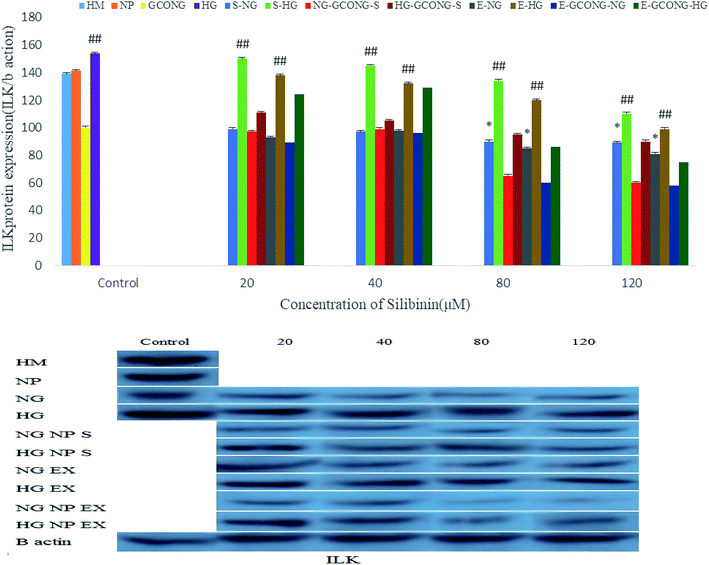
The expression of integrin-linked kinase (ILK) protein in high-glucose conditions (HG) and also in HM conditions increased. ILK increased by silibinin and extract at the concentrations of 20 and 40 μM. However, CGONP-S and CGONP-E at 80 and 120 μM concentrations in both the NG and HG conditions decreased, as represented in Fig. 11.
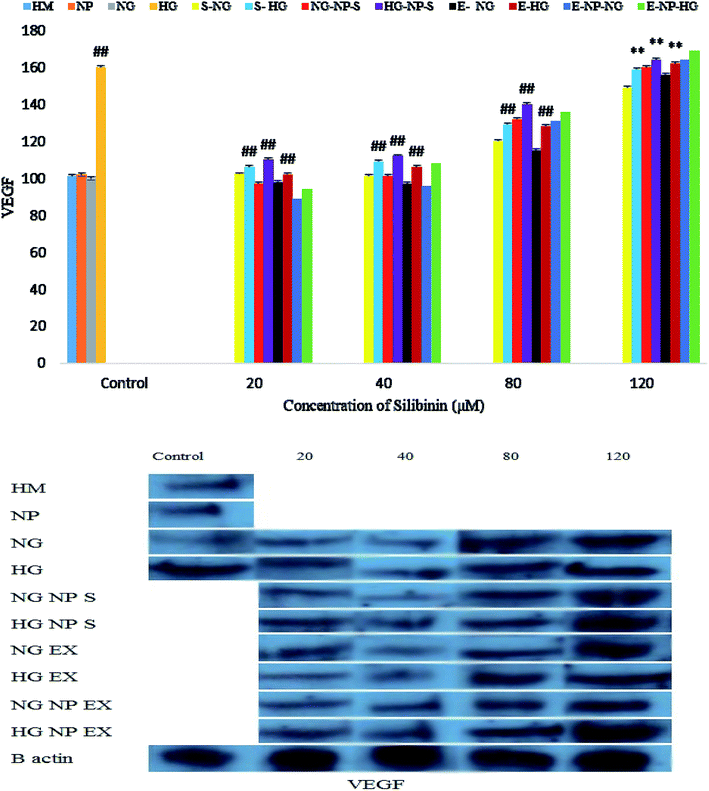
Silibinin, CGONP-S, CGONP-E and extract (E) at 80 and 120 μM concentrations in high-glucose conditions increased VEGF and at 20 and 40 μM, they did not show any meaningful changes (Fig. 12).
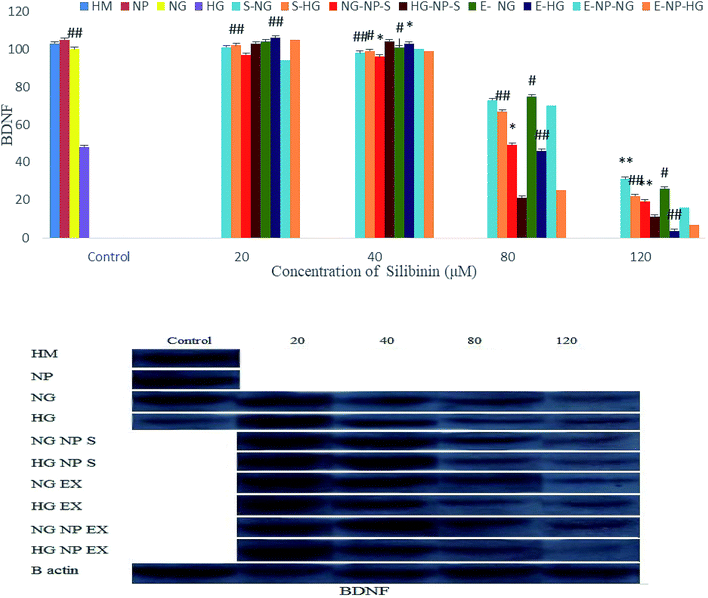
Fig. 13 shows that silibinin, CGONP-S, CGONP-E, and extract (E) at high concentrations (80 and 120 μM) in both high- and normal-glucose conditions decrease BDNF. At 20 and 40 μM concentrations, the decrease in BDNF was not significant.
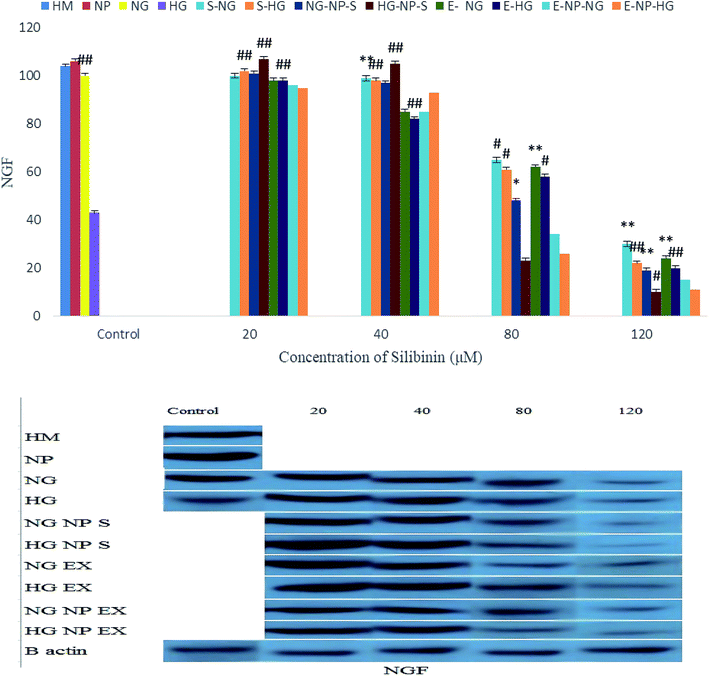
As shown in Fig. 14, treatments with low concentrations of silibinin, CGONP-S, CGONP-E, and extract (E) cause an increase in the NGF expression under the HG state, whereas treatments with silibinin, CGONP-S, CGONP-E, and extract (E) at high concentrations cause a decrease in the NGF expression in both the NG and HG states.
4. Discussion
Diabetic neuropathies are amongst the most common chronic complications, targeting approximately 50% of people with diabetes.37 Diabetic neuropathies develop diverse clinical characterizations such as sensory loss and pain and put patients at high risk for foot ulcers and amputation, an irreversible complication.36,38,39In this study, the synthesized drug delivery system at low concentrations of silibinin and silymarin extract protected OECs from the toxic effects of high glucose, whereas at high concentrations, this effect was reversed.
To reduce the side-effects and reduction of dosing intervals, researchers are now focusing on drug delivery and design systems. Using nanotechnology systems, the rate and time of drug release will be determined and controlled. Drug carriers are 10–220 nm in size and include polymer micelles, dendrimers, and vesicles. Furthermore, the chemical tailoring of the nanopolymer with ligands, which are capable of connecting to special receivers and finding targets more accurately in cancer cells, can have increased therapeutic efficacy.40
In this study, the polymer structure was analyzed with different analytical techniques such as FTIR, 1H NMR, 13C NMR, GPC, DLS, and AFM.
The FT-IR spectrum illustrated the presence of hydroxyl and carbonyl groups at 2977–1632 and 1733 cm−1, respectively. The 1H NMR spectrum showed five types of hydrogens. Two types of multiple signals were seen for hydrogen glycerol at 2.00–2.10 ppm and for methyl and methylene at 4.10–4.25 ppm; also, three types of hydrogens for citric acid could be seen in the methylene protons at 2.6–2.9 ppm. The 13C NMR spectrum shows six types of carbons. Glycerol shows two types of signals and citric acid shows four types of signals for their carbons. 13C and 14C signals correspond to the carbonyl groups, (C2) is ascribed to the methylene groups, and the (C1) signal is attributed to the fourth carbon of citric acid. C5 and C6 are ascribed to methyl and methylene, respectively. Using GPC, the CGONP molecular weight was found to be about 4315.8 mol g−1. According to the DLS and AFM tests, the radiation polyester hydrodynamic diameter was about 50–150 nm.
Silybum marianum (milk thistle) is a medicinal plant containing 1 to 4 percent flavonoids like silibinin and their stereoisomers like isosilibinin, silychristine, isosilychristine and silydianin.16 Silibinin has increased neuronal survival against peroxide and decreases hypoxia/ischemic damage in the middle brain arteries. Also, it has been illustrated that silibinin decreases autologous cell death in nerve cells after ischemic re-perfusions.23 Silibinin is the most basic (70 to 80 percent) and active component of silymarin,17 and it has neuroprotective, anticancer, antioxidant and anti-inflammatory effects.19 Previous studies have reported that silibinin is able to have the neuroprotective effect in brain damage caused by the brain ischemic re-perfusion, diabetes and memory disorders that are caused by amyloid peptide.19 Also, the behavioral disorders in Alzheimer's disease can be improved by silibinin.24 Thus, in this study, due to silibinin neuroprotective properties, the effects of its different concentrations on the survival rate and expression of neurotrophic proteins NGF, VEGF, and BDNF of the olfactory ensheathing cells were investigated.
According to previous studies, the HPLC method has been used in order to determine the amount of co-polymer loading capacity.29 For this purpose, after standard curve measurements, the co-polymer silibinin and silymarin extract loading capacities obtained were more than 68.5% and 56.4%, respectively.
Silibinin was exposed to OECs at concentrations of 1, 10, 20, 40, 80, 100, and 120 μM under high and normal glucose conditions. Treatments with silibinin at low concentrations (20, 40 μM) prevented cell death with EC50 = 4.88 ± 0.5 μM and at high concentrations, reduced cell viability with LC50 = 57.36 ± 2.5 was observed in the NG state. Under the HG condition, treatments with high concentrations (80, 120 μM) reduced the cell viability with LC50 of 43.18 ± 1.8. It seems that the cytotoxicity of CGNOP-S and CGNOP-E was almost equipotent in either the NG or HG conditions. In the same vein, it has previously been reported that silibinin has a toxic effect on hepatoma cells with an EC50 value of 36 μM.41 In a study, anti-HIV activities were evaluated, and the silibinin derivative showed higher activity (LC50 = 73 μM) than silibinin.42
In this study, CGNOP-S and CGNOP-E at high concentrations significantly increased the intracellular ROS levels but free silibinin at the same concentrations did not. It has been shown that the gold nanoparticles carrying the silymarin extract can protect the nerve cells in rats by reducing reactive oxygen species (ROS) at low concentrations.43 Also, it has been reported that the reduction in ROS production and mitochondrial membrane potential is due to the impact of silibinin in neuronal cells.44 In addition to enhanced ROS production, intracellular antioxidant mechanisms (i.e., glutathione peroxidase activity and protein content) are reduced and the brain mitochondrial nitric oxide (NO) levels increase in diabetic rats.45 In this study, the NO release was significantly reduced in OECs; however, the NO release was reduced after treatments with high concentrations of silibinin and extract in both NG- and HG-treated OECs. It was demonstrated that silymarin at low concentrations, similar to our results, inhibited the production of inflammatory mediators, such as nitric oxide, and reduced the damage to dopaminergic neurons. Silibinin also protected the primary hippocampal neurons against oxidative stress-induced apoptosis.46
It has been indicated that diabetes affects the expression of ILK in the retina. ILK may be involved in the diabetes-induced damage and/or alterations of neural and microvascular structures.47 Our results showed that in OECs, the HG condition increased the ILK protein expression. This situation was also seen with mannitol. Silibinin and extract at low concentrations maintained ILK over-expressions caused by HG, whereas at high concentrations decreased the ILK expression in both the NG and HG states. A study showed the inhibitory effect of silymarin on PGE2-induced cell migration through the blocking of the EP2 activation and effect on integrins in Caki cells.48 The increase in the expression of VEGF was in agreement with the previous results on dorsal root ganglia (DRG), which indicated that the compensatory increase in the VEGF expression was connected to its role in the protection of DRG neurons from the damage caused by hyperglycemia as well as its role in the regulation of neuronal regeneration.49 In the present study, CGONP-S and CGONP-E at 80 and 120 μM concentrations in high and normal glucose conditions caused VEGF to increase; at 20 and 40 μM, they did not show any significant changes.
It has been demonstrated that silymarin reduces AGE-induced migration in a dose-dependent manner. This effect is mediated through the GSK-3β-dependent inhibition of VEGF release.40 It has been shown that the ratio of BDNF to β-actin products is significantly reduced in a diabetic brain.50 Our results showed that by increasing the concentrations of silibinin, extract, CGONP, CGONP-S, and CGONP-E, the values of BDNF in the high and normal glucose conditions reduced significantly. At 20 and 40 μM concentrations, the decrease in BDNF was not significant. It has been indicated that silibinin exerts neuroprotective effects against AlCl3-induced cognitive impairment and neurochemical changes by increasing the BDNF level. Recently, a role for NGF has been postulated in the pathophysiology of diabetic neuropathy.51 Studies have shown that there may be both a decrease in the NGF production and a decrease in the retrograde axonal transport of NGF and other proteins in diabetic animals.52,53 This diminished delivery of NGF can lead to reduced levels within peripheral ganglia, the location of the nerve cell bodies. It has been shown in a study that a Silybum marianum (milk thistle) extract enhances nerve growth factor (NGF)-induced neurite outgrowth in PC-12 neural cells and prolongs their survival in culture.46
5. Conclusions
In summary, the structure of the synthesized CGONP was characterized by using different methods such as IR, 1H NMR, 13C NMR GPC, DLS, and AFM. In this study, for obtaining the amount of the loading capacity of CGONP, we used the HPLC method. The main aim of our study was to determine the exposure concentrations for the cytoprotective and cytotoxic actions of silibinin, extract, CGONP, CGONP-S, and CGONP-E in OECs under normal and glucotoxicity conditions. Our results may have important implications for the pharmacological manipulation of diabetes microvascular complications. However, the protective activities of the low concentrations of silibinin, extract, CGONP, CGONP-S, and CGONP-E were reversed by high concentrations. Our findings suggest that the cytoprotective levels of silibinin, extract, CGONP, CGONP-S, and CGONP-E are lower by a factor of approximately 4 than the cytotoxic concentration range in OECs. The precise molecular mechanisms by which silibinin, extract, CGONP, CGONP-S, and CGONP-E exert the cytoprotective and/or cytotoxic effects have not yet been thoroughly elucidated in OECs. Our results showed that the protective effects of silibinin against hyperglycemic stress in OECs may be attributed to its inhibition of intracellular ROS formation and NO production. In addition, the increased expressions of ILK and VEGF in glucotoxicity conditions were maintained, while the expression of the BDNF and NGF proteins decreased in these conditions. The mentioned mechanisms were totally reversed by silibinin, extract, CGONP, CGONP-S, and CGONP-E at high concentrations. It appears that silibinin, extract, CGONP, CGONP-S, and CGONP-E exert their action, at least in part, by modulating the ILK expression, which is associated with the regulation of the VEGF, BDNF, and NGF expressions as well as NO and ROS production.Conflicts of interest
The authors declare that they have no conflict of interest.Acknowledgements
The authors would like to thank Lorestan University and the Medical University of Ilam, Iran, for financial support to accomplish this project.References
- D. W. Zochodne, Clinical features of diabetic polyneuropathy, 2014, p. 640 Search PubMed.
- J. P. Klein and S. G. Waxman, The brain in diabetes: molecular changes in neurons and their implications for end-organ damage, Lancet Neurol., 2003, 2(9), 548–554 CrossRef CAS PubMed.
- Y. Kawashima, Panoparticulate systems for improved drug delivery, Adv. Drug Delivery Rev., 2001, 47(1), 1–2 CrossRef CAS PubMed.
- K. S. Soppimath, T. M. Aminabhavi, A. R. Kulkarni and W. E. Rudzinski, Biodegradable polymeric nanoparticles as drug delivery devices, J. Controlled Release, 2001, 70(1–2), 1–20 CrossRef CAS PubMed.
- J. Panyam and V. Labhasetwar, Biodegradable nanoparticles for drug and gene delivery to cells and tissue, Adv. Drug Delivery Rev., 2003, 55(3), 329–347 CrossRef CAS PubMed.
- I. Brigger, C. Dubernet and P. Couvreur, Nanoparticles in cancer therapy and diagnosis, Adv. Drug Delivery Rev., 2002, 54(5), 631–651 CrossRef CAS PubMed.
- G. Tiwari, R. Tiwari, B. Sriwastawa, L. Bhati, S. Pandey and P. Pandey, et al., Drug delivery systems: an updated review, Int. J. Pharm. Invest., 2012, 2(1), 2–11 CrossRef PubMed.
- L. Zhao, L. Wang, Y. Zhang, S. Xiao, F. Bi and J. Zhao, et al., Glucose Oxidase-Based Glucose-Sensitive Drug Delivery for Diabetes Treatment, Polymers, 2017, 9(7), 255 CrossRef PubMed.
- R. Singh and J. W. Lillard Jr, Nanoparticle-based targeted drug delivery, Exp. Mol. Pathol., 2009, 86(3), 215–223 CrossRef CAS PubMed.
- J. K. Twibanire and T. B. Grindley, Polyester Dendrimers: Smart Carriers for Drug Delivery, Polymers, 2014, 6(1), 179–213 CrossRef.
- E. R. Gillies, E. Dy, J. M. Frechet and F. C. Szoka, Biological evaluation of polyester dendrimer: poly(ethylene oxide) “bow-tie” hybrids with tunable molecular weight and architecture, Mol. Pharmaceutics, 2005, 2(2), 129–138 CrossRef CAS PubMed.
- X. Ma, Z. Zhou, E. Jin, Q. Sun, B. Zhang and J. Tang, et al., Facile Synthesis of Polyester Dendrimers as Drug Delivery Carriers, Macromolecules, 2013, 46(1), 37–42 CrossRef CAS.
- M. V. Walter and M. Malkoch, Simplifying the synthesis of dendrimers: accelerated approaches, Chem. Soc. Rev., 2012, 41(13), 4593–4609 RSC.
- N. Malik, E. G. Evagorou and R. Duncan, Dendrimer-platinate: a novel approach to cancer chemotherapy, Anticancer Drugs, 1999, 10(8), 767–776 CrossRef CAS PubMed.
- S. H. Medina and M. E. H. El-Sayed, Dendrimers as Carriers for Delivery of Chemotherapeutic Agents, Chem. Rev., 2009, 109(7), 3141–3157 CrossRef CAS PubMed.
- A. T. Naeini, M. Adeli and M. Vossoughi, Poly(citric acid)-block-poly(ethylene glycol) copolymers – new biocompatible hybrid materials for nanomedicine, Nanomedicine, 2010, 6(4), 556–562 CrossRef CAS PubMed.
- W. He, F. J. Miao, D. C. Lin, R. T. Schwandner, Z. Wang and J. Gao, et al., Citric acid cycle intermediates as ligands for orphan G-protein-coupled receptors, Nature, 2004, 429(6988), 188–193 CrossRef CAS PubMed.
- A. L. Tardy, B. Morio, J. M. Chardigny and C. Malpuech-Brugere, Ruminant and industrial sources of trans-fat and cardiovascular and diabetic diseases, Nutr. Res. Rev., 2011, 24(1), 111–117 CrossRef CAS.
- J. A. Young, Chemical Laboratory Information Profile: Oleic Acid, J. Chem. Educ., 2002, 79(1), 24 CrossRef.
- M. Grossi, G. D. Lecce, T. G. Toschi and B. Riccò, Fast and Accurate Determination of Olive Oil Acidity by Electrochemical Impedance Spectroscopy, IEEE Sens. J., 2014, 14(9), 2947–2954 Search PubMed.
- P. R. Davis-Searles, Y. Nakanishi, N. C. Kim, T. N. Graf, N. H. Oberlies and M. C. Wani, et al., Milk thistle and prostate cancer: differential effects of pure flavonolignans from Silybum marianum on antiproliferative end points in human prostate carcinoma cells, Cancer Res., 2005, 65(10), 4448–4457 CrossRef CAS PubMed.
- E. Verdu, G. Garcia-Alias, J. Fores, R. Lopez-Vales and X. Navarro, Olfactory ensheathing cells transplanted in lesioned spinal cord prevent loss of spinal cord parenchyma and promote functional recovery, Glia, 2003, 42(3), 275–286 CrossRef PubMed.
- M. L. Adams, A. Lavasanifar and G. S. Kwon, Amphiphilic block copolymers for drug delivery, J. Pharm. Sci., 2003, 92(7), 1343–1355 CrossRef CAS PubMed.
- R. Tian, H. Wang, R. Niu and D. Ding, Drug delivery with nanospherical supramolecular cell penetrating peptide-taxol conjugates containing a high drug loading, J. Colloid Interface Sci., 2015, 453, 15–20 CrossRef CAS PubMed.
- J. C. Alwine, D. J. Kemp and G. R. Stark, Method for detection of specific RNAs in agarose gels by transfer to diazobenzyloxymethyl-paper and hybridization with DNA probes, Proc. Natl. Acad. Sci. U. S. A., 1977, 74(12), 5350–5354 CrossRef CAS PubMed.
- J. Renart, J. Reiser and G. R. Stark, Transfer of proteins from gels to diazobenzyloxymethyl-paper and detection with antisera: a method for studying antibody specificity and antigen structure, Proc. Natl. Acad. Sci. U. S. A., 1979, 76(7), 3116–3120 CrossRef CAS PubMed.
- M. M. Koç, M. J. McNally, K. von Haeften and M. J. Watkins, AFM induced self-assembling and self-healing mechanism of silicon oxide nanoparticle linear array domains templated on Moiré superlattice patterns on HOPG, Surf. Sci., 2019, 679, 230–239 CrossRef.
- W. N. Burnette, Western blotting: electrophoretic transfer of proteins from sodium dodecyl sulfate-polyacrylamide gels to unmodified nitrocellulose and radiographic detection with antibody and radioiodinated protein A, Anal. Biochem., 1981, 112(2), 195–203 CrossRef CAS.
- D. Majumdar, K. H. Jung, H. Zhang, S. Nannapaneni, X. Wang and A. R. Amin, et al., Luteolin nanoparticle in chemoprevention: in vitro and in vivo anticancer activity, Cancer Prev. Res., 2014, 7(1), 65–73 CrossRef CAS PubMed.
- Q. Lv, A. Yu, Y. Xi, H. Li, Z. Song and J. Cui, et al., Development and evaluation of penciclovir-loaded solid lipid nanoparticles for topical delivery, Int. J. Pharm., 2009, 372(1–2), 191–198 CrossRef CAS PubMed.
- M. Azizi, M. Bakhtiari, F. Farahmand Ghavi, M. Zandi, M. Imani and M. T. Joghataei, Purity determining of cultured OECs from olfactory mucosa of rats' pups, Journal of Basic Research in Medical Sciences, 2016, 3(4), 12–21 CrossRef.
- S. Svenson, Dendrimers as versatile platform in drug delivery applications, Eur. J. Pharm. Biopharm., 2009, 71(3), 445–462 CrossRef CAS PubMed.
- S. B. Yee, J. H. Lee, H. Y. Chung, K. S. Im, S. J. Bae and J. S. Choi, et al., Inhibitory effects of luteolin isolated from Ixeris sonchifolia Hance on the proliferation of HepG2 human hepatocellular carcinoma cells, Arch. Pharmacal Res., 2003, 26(2), 151–156 CrossRef CAS PubMed.
- J. Dulak, A. Jozkowicz, R. Foresti, A. Kasza, M. Frick and I. Huk, et al., Heme oxygenase activity modulates vascular endothelial growth factor synthesis in vascular smooth muscle cells, Antioxid. Redox Signaling, 2002, 4(2), 229–240 CrossRef CAS PubMed.
- M. Kobayashi and D. W. Zochodne, Diabetic neuropathy and the sensory neuron: new aspects of pathogenesis and their treatment implications, J. Diabetes Invest., 2018, 9(6), 1239–1254 CrossRef CAS PubMed.
- M. J. Brown and A. K. Asbury, Diabetic neuropathy, Ann. Neurol., 1984, 15(1), 2–12 CrossRef CAS PubMed.
- P. J. Dyck, K. M. Kratz, J. L. Karnes, W. J. Litchy, R. Klein and J. M. Pach, et al., The prevalence by staged severity of various types of diabetic neuropathy, retinopathy, and nephropathy in a population-based cohort: the Rochester Diabetic Neuropathy Study, Neurology, 1993, 43(4), 817–824 CrossRef CAS PubMed.
- D. W. Zochodne, Diabetic neuropathies: features and mechanisms, Brain Pathol., 1999, 9(2), 369–391 CrossRef CAS PubMed.
- A. J. Boulton, A. I. Vinik, J. C. Arezzo, V. Bril, E. L. Feldman and R. Freeman, et al., Diabetic neuropathies: a statement by the American Diabetes Association, Diabetes Care, 2005, 28(4), 956–962 CrossRef PubMed.
- A. Alhusban, E. Alkhazaleh and T. El-Elimat, Silymarin Ameliorates Diabetes-Induced Proangiogenic Response in Brain Endothelial Cells through a GSK-3β Inhibition-Induced Reduction of VEGF Release, J. Diabetes Res., 2017, 2017, 9 Search PubMed.
- L. Radko, W. Cybulski and W. Rzeski, Cytotoxicity studies of lasalocid and silibinin in rat hepatoma cell culture, Bull. Vet. Inst. Pulawy, 2011, 55, 547–554 Search PubMed.
- V. Romanucci, C. Agarwal, R. Agarwal, C. Pannecouque, M. Iuliano and G. De Tommaso, et al., Silibinin phosphodiester glyco-conjugates: synthesis, redox behaviour and biological investigations, Bioorg. Chem., 2018, 77, 349–359 CrossRef CAS PubMed.
- A. A. M. Ahmadzadeh, Z. Allameh, S. R. Zarchii and M. Fazilati, The impact of silymarin extract on oxidative stress induced by gold nanoparticles, Biomed. Res., 2017, 28(14), 6144–6150 CAS.
- Z. Xie, S. Q. Ding and Y. F. Shen, Silibinin activates AMP-activated protein kinase to protect neuronal cells from oxygen and glucose deprivation-re-oxygenation, Biochem. Biophys. Res. Commun., 2014, 454(2), 313–319 CrossRef CAS PubMed.
- R. Mastrocola, F. Restivo, I. Vercellinatto, O. Danni, E. Brignardello and M. Aragno, et al., Oxidative and nitrosative stress in brain mitochondria of diabetic rats, J. Endocrinol., 2005, 187(1), 37–44 CAS.
- S. Kittur, S. Wilasrusmee, W. A. Pedersen, M. P. Mattson, K. Straube-West and C. Wilasrusmee, et al., Neurotrophic and neuroprotective effects of milk thistle (Silybum marianum) on neurons in culture, J. Mol. Neurosci. MN, 2002, 18(3), 265–269 CrossRef CAS PubMed.
- Y. J. Li, Y. N. Hui, F. Yan and Z. J. Du, Up-regulation of integrin-linked kinase in the streptozotocin-induced diabetic rat retina, Graefes Arch. Clin. Exp. Ophthalmol., 2007, 245(10), 1523–1532 CrossRef CAS PubMed.
- S. M. Woo, K. J. Min, I. G. Chae, K. S. Chun and T. K. Kwon, Silymarin suppresses the PGE2-induced cell migration through inhibition of EP2 activation; G protein-dependent PKA-CREB and G protein-independent Src-STAT3 signal pathways, Mol. Carcinog., 2015, 54(3), 216–228 CrossRef CAS PubMed.
- A. Verheyen, E. Peeraer, D. Lambrechts, K. Poesen, P. Carmeliet and M. Shibuya, et al., Therapeutic potential of VEGF and VEGF-derived peptide in peripheral neuropathies, Neurosci. J., 2013, 244, 77–89 CrossRef CAS PubMed.
- A. Nitta, R. Murai, N. Suzuki, H. Ito, H. Nomoto and G. Katoh, et al., Diabetic neuropathies in brain are induced by deficiency of BDNF, Neurotoxicol. Teratol., 2002, 24(5), 695–701 CrossRef CAS PubMed.
- A. Jangra, P. Kasbe, S. N. Pandey, S. Dwivedi, S. S. Gurjar and M. Kwatra, et al., Hesperidin and Silibinin Ameliorate Aluminum-Induced Neurotoxicity: Modulation of Antioxidants and Inflammatory Cytokines Level in Mice Hippocampus, Biol. Trace Elem. Res., 2015, 168(2), 462–471 CrossRef CAS PubMed.
- R. Hellweg and H. D. Hartung, Endogenous levels of nerve growth factor (NGF) are altered in experimental diabetes mellitus: a possible role for NGF in the pathogenesis of diabetic neuropathy, J. Neurosci. Res., 1990, 26(2), 258–267 CrossRef CAS PubMed.
- R. Hellweg, M. Wohrle, H. D. Hartung, H. Stracke, C. Hock and K. Federlin, Diabetes mellitus-associated decrease in nerve growth factor levels is reversed by allogeneic pancreatic islet transplantation, Neurosci. Lett., 1991, 125(1), 1–4 CrossRef CAS PubMed.
| This journal is © The Royal Society of Chemistry 2019 |

