DOI:
10.1039/C9RA05587H
(Paper)
RSC Adv., 2019,
9, 32839-32847
A rapid on-site analysis method for the simultaneous extraction and determination of Pb2+ and Cd2+ in cereals†
Received
19th July 2019
, Accepted 17th September 2019
First published on 15th October 2019
Abstract
In order to achieve rapid on-site screening and solve the problem of rapid pretreatment for the determination of lead (Pb2+) and cadmium (Cd2+) in cereals by a portable electrochemical analyzer with disposable screen-printed electrodes (SPEs), a new reliable and simple extraction method for Pb2+ and Cd2+ in cereals was developed. The Pb2+ and Cd2+ in cereals were purified by a mixed solution of 1 mol L−1 potassium iodide (KI)/5% vitamin C (VC)/ethyl acetate after being extracted by 10% HNO3, which transfers the Pb2+ and Cd2+ into ethyl acetate after a reaction with KI–VC. Then, the Pb2+ and Cd2+ were eluted from ethyl acetate with 5% HNO3 and were determined by an electrochemical analyzer with screen printed electrodes. Under the optimized conditions, the matrix calibration curves of Pb2+ and Cd2+ in rice and wheat showed good linear relationships with R2 > 0.996. The method shows a detection limit (LOD) for Cd2+ in rice and wheat of 6.7 μg kg−1 and 11.5 μg kg−1, and the corresponding values for Pb2+ were 34.9 and 31.1 μg kg−1, respectively. The relative standard deviation (RSD) was less than 8.7% for Cd2+ and Pb2+. In addition, the recoveries of the tested reference materials using this method were between 80% and 120%. From sample pretreatment to testing results, the whole process took no more than 25 min, and the operation was simple for operators, green to the environment, cheap in terms of instruments, and above all suitable for on-site detection. The results implied that this portable electrochemical method with new pretreatment may be a good choice for screening Pb2+ and Cd2+ in cereal samples on-site.
Introduction
Heavy metals are known to pose a great threat not only to human beings, but also to aquatic plants and animals, due to their high toxicity, high stability and non-biodegradability.1 In particular, the two major pollutants Pb2+ and Cd2+ easily pose an acute or chronic risk even at low concentrations, causing headaches, hypertension, skeletal malformation in fetuses, arthralgia, renal damage and so on.2,3 Most of the Pb2+ and Cd2+ is generated from industry and then released into water and soil, continuously transferred into plants, and accumulated in cereals and humans.4 What's more, cereals are the main food crop for half of the world's population.5 This mode of diet has greatly increased people's intake of heavy metals and the risk of disease. Therefore, on account of the harmfulness and scattered samples, rapid and on-site detection methods are extremely urgent, and it is of great importance for human health to detect Pb2+ and Cd2+ in a quick and reliable way.6 Especially in countries where rice production has not realized intensive cultivation, such as China, the problem of Pb2+ and Cd2+ in cereals is salient.
However, there are still some difficulties in realizing the rapid detection of Pb2+ and Cd2+ in grains on-site. Over the past few decades, there has been increasing interest in the development of detection methods for Pb2+ and Cd2+. Routine methods for detection are atomic absorption spectroscopy (AAS),7 inductively coupled plasma-mass spectrometry (ICP-MS),8 inductively coupled plasma atomic emission spectrometry (ICP-AES),9 and inductively coupled plasma-optical emission spectrometry (ICP-OES)10 and so on. These methods have achieved high precision for detecting heavy metal ions, but they have some disadvantages, such as the high cost of the cumbersome instruments required and their maintenance, the requirement of skilled professionals and being time-consuming.11,12 These drawbacks have limited their application in the field. Therefore, it is imperative to establish portable analytical systems.
Electrochemical methods, in particular based on screen printed electrodes (SPEs), are widely used in heavy metal ion detection due to their low cost, simple operation and fast response.13–15 Since the 1990s, screen-printed technology has been used for electrochemical sensors,16 which are generally used in many fields, especially for water detection. However, they are rarely used in cereal samples because of the complicated matrix interference. Complex matrices of samples, involving proteins, fats, pigments and other ions, can result in a significant gap between the lab value and on-site measurement conditions.17 Therefore, complicated matrix interference, low concentrations of heavy metal ions and high levels of electrolyte background are key challenges for the electrochemical measurement performance.18 The way to solve these problems partly depends on pretreatment. The traditional digestion method requires a lot of strong acid and it takes a long time (at least 2–3 hours).19 Recently, a method which uses diluted acid for extracting Cd2+ and Pb2+ has been developed for the purpose of abandoning the dangerous strong acid and simplifying the operations.20–22 What's more, some researchers have also applied 4-methyl-2-pentanone (MIBK) in pretreatment for further purification. Most of the publications employing MIBK as the solvent extractor focused on pretreatment prior to Cd2+ and Pb2+ analysis, where it was used widely for water and soil. Compared to traditional pretreatment, this method indeed saved a lot of time, but there are only a few reports on the determination of Pb2+ and Cd2+ in cereal samples using MIBK extraction methods. Shi et al.23 used ammonium pyrroline dithiocarbamate (APDC) to coordinate metal ions and then extracted them with MIBK, and the final results complied with the requirements of neutron activation analysis (NAA). Xin et al.24 used KI to perform a substitution reaction with Pb2+ and Cd2+ before they were extracted with MIBK. In fact, MIBK is currently a relatively hard-to-get chemical intermediate, and it is considered to be a hazardous air pollutant, especially in high-rise air,25 but other common solvents have been rarely studied to replace MIBK. Ethyl acetate is a good alternative to organic solvents because of its non-toxic and excellent properties for extraction. But regarding KI–ethyl acetate extraction for an effective cereal pretreatment method, there has been no report yet.
In this study, we developed a rapid pretreatment approach coupled with an electrochemical method to determine trace Pb2+ and Cd2+ simultaneously in cereal samples (rice and wheat) with a portable heavy metal screen-printed electrode. In brief, the target Pb2+ and Cd2+ were simultaneously extracted by diluted acid from cereals, and the ions reacted with organic acids (vitamin C) and potassium iodide to form the associated complexes, which can be transferred to the organic phase and then eluted into inorganic acids. After a simple pretreatment of the samples, the on-site analysis was carried out using disposable screen printed electrodes as the working electrodes. Some of the key factors, such as the extraction rate, elimination of interferences and electrode working conditions, were investigated. Moreover, the analytical performance of this method was validated with certified reference materials in comparison with the ICP-MS method. Under the optimal parameters, the basic standard curve was established. The detection limits, repeatability, and accuracy were all evaluated. In the meantime, real cereal samples collected from markets were used to demonstrate the reliability of the new method in comparison with ICP-MS. The whole detection procedure took less than 25 min, and it supplied a reliable method for the simultaneous detection of Pb2+ and Cd2+ in cereals on site.
Experimental
Chemicals
All certified reference materials (CRMs), namely GBW(E)100350, GBW(E)100348, GBW100361, GBW100378, and GBW100379, were purchased from the National Institute of Metrology, China. ZK012, ZK014, ZK004, ZK001, ZK002, ZK003, FD, FM and other samples containing Cd2+ and Pb2+ were prepared by the Academy of National Food and Strategic Reserves Administration, China. HNO3, ammonium acetate and KI were purchased from Beijing Chemical Reagent Research Institute. VC was purchased from CNW technologies. Ethyl acetate (GR) was purchased from Fisher Chemical. Pb2+ and Cd2+ standard solutions were purchased from National Institute of Metrology. Electrolyte buffer solutions were kindly provided by Wuhan Zhongkezhikang Biotechnology Co. Ltd.
Instruments
All solutions were prepared with ultrapure water (resistivity: 18.2 MΩ cm−1) from a Milli-Q purification system (USA), and the samples were ground in a grinder (Fritsch, Germany). Cd2+ and Pb2+ in the extracts was quantified by ICP-MS (7500CX, Agilent, USA). A high-speed centrifuge (3-30KS, Sigma Laborzentrifugen Gmbh, Germany) was used to separate the extracted solutions. The screen printed graphite working electrodes (SPEs) and the electrochemical detector were kindly provided by Wuhan Zhongkezhikang Biotechnology Co. Ltd.
Cereal sample preparation
In this study, rice and wheat were selected as the representative samples due to them being the most prevalent cereals as a staple food worldwide and the fact that they are commonly regarded as cereals in which heavy metals are easily accumulated. Unlike the simple diluted acid extraction,26 the new method could get rid of more soluble impurities. Briefly, the samples were ground into a powder and mixed completely. A portion (0.25 g) was transferred into an extraction tube, and the following solutions were added to the tube in sequence: 10% HNO3, 10% VC solution, 2 mol L−1 KI solution, and ethyl acetate. The Pb2+ and Cd2+ were extracted and cleaned from this mixture solution by vigorously vortexing for 10 min on a shaker. After being centrifuged at 4000 rpm for 5 min, the solvent was separated from the aqueous layer. Then, a 1 mL aliquot of the ethyl acetate supernatant was back-extracted with 5% HNO3 by hand-shaking for 1 min. After stratification, the organic solvent was abandoned and the aqueous phase was prepared for detection.
Procedure of the electrochemical method of Pb2+ and Cd2+
The analysis of Pb2+ and Cd2+ by the one-strip electrochemical method with solvent extraction was performed in acetate buffer solutions. The SPEs had three electrodes, consisting of a round carbon working electrode (diameter of 2.8 mm), a carbon auxiliary electrode, and a silver pseudo-reference electrode. The working electrode should be activated first. In brief, under stirring conditions, the electrode was immersed in a mixture buffer containing 1 mL of 0.5 mol L−1 acetate buffer solution and 40 μL of 1000 mg L−1 Hg+ standard solution and the deposition potential (−1.3 V) was applied to the working electrode for 200 s. This step was to activate the electrode and form an amalgam on the surface of the electrode, which can improve the sensitivity and stability. After the electrode was activated, 200 μL of sample solution was added to the sample cell that already contained the activated electrode scanned for 200 s and a potential scan was carried out from −1.3 V to 0.6 V. After an equilibration period, the potential scan was carried out for 10 s, and the solution was not stirred in this step. The parameters of the detection conditions were set up, such as frequency (10 Hz), amplitude (25 mV) and scan rate (4 mV s−1). All the steps were imposed at room temperature. The main principle and processes are shown in Fig. 1.
 |
| | Fig. 1 The principle of the portable electrochemical method. | |
Optimization of the working conditions and matrix-matched calibration curves
In this method, one of the priority issues of the whole detection was the sample extraction procedure, and it was of great importance to extract and concentrate the target metal ions from the cereal samples. In order to obtain a complete extraction rate, the following critical factors were studied, such as the nitric acid concentration, the ratio of sample to diluted-nitric acid (m/v), the extraction pattern and extraction time, and the concentration of KI and VC. Under the optimized working conditions, calibration curves were established. A series of standard cereal materials that contained different concentrations of Pb2+ and Cd2+ were chosen as the standard matrixes, and calibration curves were evaluated by plotting the current response against concentration. The limit of detection (LOD) (3σ/s) and the limit of quantification (LOQ) (10σ/s) were also calculated from the calibrations, where σ is the standard deviation of eleven blank measurements and s is the slope of the calibration curve.
For optimization of the nitric acid concentration, in this part, 3%, 5%, 10% and 15% HNO3 were studied for the extraction rate of Pb2+ and Cd2+. Different concentrations of acid were added to the certified reference samples, and the operation was carried out according to “Cereal sample preparation” and “Procedure of the electrochemical method of Pb2+ and Cd2+”. The recoveries of Pb2+ and Cd2+ were calculated.
For optimization of the ratio of sample to diluted-nitric acid (m/v), the ratios of sample to diluted-nitric acid (m/v) were set as 1![[thin space (1/6-em)]](https://www.rsc.org/images/entities/char_2009.gif) :5, 1:10 and 1:15. Through the steps mentioned above in “Cereal sample preparation”, the untested liquid was detected. The recoveries of Pb2+ and Cd2+ were calculated.
:5, 1:10 and 1:15. Through the steps mentioned above in “Cereal sample preparation”, the untested liquid was detected. The recoveries of Pb2+ and Cd2+ were calculated.
For optimization of the extraction time and the extraction method, to improve the extraction rate, the best extraction time and method were evaluated; the extraction time was 3, 5, 10, or 15 min, and at each time, two extraction methods, namely shaking and vortexing, were used to extract Cd2+ and Pb2+ in both rice and wheat.
For optimization of the concentration of KI, to identify the influence of KI on the method, different concentrations of KI solution (0.1, 0.2, 0.5, 1.0, 2.5, 4.0, 5.0 mol L−1) were added during the pretreatment. After testing, the current signals were compared to analyze the influence of KI.
For optimization of the concentration of VC, different concentrations of VC solution (3, 5, 10, 15, and 18%) were added to improve the performance of the method. Then, the trends of the current signals under different conditions were compared to identify the optimum concentration.
For optimization of the concentration of eluent, 5% HNO3 and 10% HNO3 were used as the primary eluents. The eluted liquid was prepared for detection. The concentration that gave the highest current signal was selected as the appropriate concentration of the eluent.
Precision and stability
Precision was evaluated by determining the response of seven independent replicates for each sample. Furthermore, in order to perform a comprehensive evaluation, a three-person evaluation model was cited. In this model, three different concentration levels of the sample were used for analysis. The three different concentration levels were selected mainly based on the national standard limit, and high-, medium- and low-contamination samples were selected for analysis. Each person performed the test seven times independently.
Validation
The applicability of the established method was further investigated with the certified reference materials and some real samples that were collected from different provinces of China. The sample preparation was performed according to the section “Cereal sample preparation”, and the experiments were performed by the established method. In the meantime, ICP-MS measurements were carried out following a conventional procedure. Before the measurements, the samples were digested for 50 min by a microwave digestion procedure. And then, the results of the certified reference materials that were obtained by the established method were compared with the reported concentration values and the real sample results that were obtained by ICP-MS were compared with the results that were calculated by the established method.
Results and discussion
Optimization of the sample extraction conditions
After the pretreatment of the cereal samples, the supernatant was transferred to the cell to be detected. It was found that the peaks were not smooth and even had a slight offset. That is to say, some organic molecules, such as starch, fats, proteins, etc. caused severe interference for determination. In order to obtain a better sensitivity and stability to achieve simultaneous detection of Pb2+ and Cd2+ in this portable method on-site, some experimental conditions which may affect the extraction and current response were optimized.
Optimization of the nitric acid concentration
In order to extract Cd2+ and Pb2+ simultaneously, the concentration of acid was studied. As the data show, when the acid was at low concentrations, such as 3% HNO3 and 5% HNO3, the extraction rate of Pb2+ was slightly lower than using 10% HNO3 (Fig. 2). When the concentration was increased further, the extraction rate of Pb2+ decreased gradually. This phenomenon appeared in both rice and wheat. As for Cd2+, all concentrations of diluted nitric acid that were used for extracting Cd2+ could give a recovery of approximately 100%. That is to say, Cd2+ was more easily extracted by dilute acid and was more stable than Pb2+ in dilute acid solution. Therefore, considering the extraction rate of Pb2+ and the usage of HNO3, 10% HNO3 was employed in further investigations.
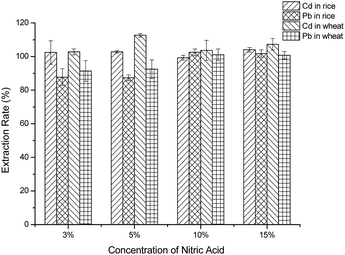 |
| | Fig. 2 The effect of the concentration of nitric acid. | |
Optimization of the ratio of sample to diluted-nitric acid (m/v)
The ratio of sample to diluted-nitric acid (m/v) was also an important factor for extraction. Fig. 3 shows the results of the two metal ion recoveries under different ratios of sample mass to diluted-nitric acid volume. At these three ratios, there was no significant change in the extraction rate of Cd2+, whether it was rice or wheat. However, the extraction rate of Pb2+ rose with an increase in the solid–liquid ratio, and tended to be stable at 1:10. The highest recoveries appeared at 1:10 for both Pb2+ and Cd2+. That is to say, at 1:10, both Cd2+ and Pb2+ can achieve the best extraction effect. When the solid–liquid ratio was less than 1:5, the mixture was relatively viscous and it was not easy to carry out the following step. Finally, 1:10 was chosen for the following experiments.
 |
| | Fig. 3 The effect of the solid to liquid ratio for extraction. | |
Optimization of the extraction time and the extraction modes
Two kinds of extraction modes and their corresponding times were studied. The extraction efficiency of oscillation and vortexing may not be as high as that of ultrasonic extraction, but ultrasonic extraction is not suitable in this method, because it might not be convenient on-site. However, if given more time, the two modes mentioned above may also obtain a good extraction rate. For the extraction time and the extraction mode, no matter whether vortexing or oscillation, the extraction rate of Cd2+ in rice and wheat was almost 100% (ESI†), illustrating that Cd2+ was very easy to extract in acid solution. This was in good agreement with the previous research.27 Unlike Cd2+, the extraction rate of Pb2+ by the oscillation extraction mode was generally higher than that by vortexing at the same time. It may be the case that the oscillation mode was more intense than the vortexing mode, which led to the sample being in full contact with the extract, so that more Pb2+ was brought out. As can be observed in Fig. 4, when the Pb2+ in wheat was extracted by vortexing for 10 min, the recoveries of both Pb2+ and Cd2+ were the closest to 100%. Therefore, these data supplied adequate evidence for a satisfactory extraction rate.
 |
| | Fig. 4 The effect of the extraction time. | |
Optimization of the concentration of KI
The main role of the KI is to replace the Pb2+ and Cd2+ by a displacement reaction, so that the formed Pb2+ and Cd2+ compounds are more easily dissolved in organic solvents. Some studies have reported that I− can react with Cd2+ to form [CdI4]2− under acidic conditions and Pb2+ can react with I− to form PbI2, a yellow precipitate, but this precipitate can be dissolved in excessive KI solution and form complex K2[PbI4]. The complex formed by KI and heavy metal ions was extracted by the organic phase.28 In order to determine whether residual KI could affect the electrochemical current signal, different concentrations of KI solution were added. As can be seen from Fig. 5, when testing the concentration of KI needed for electrochemical detection of Cd2+, the signal response exhibited a continuous increase until the concentration reached 1.0 mol L−1, and the response value showed no obvious change when the concentration was further increased. In contrast, the signal value of Pb2+ declined quickly with increasing concentration of KI until 1.0 mol L−1, and then it declined slowly as the concentration of KI kept increasing. As a compromise, 1 mol L−1 of KI could be beneficial for the analysis of both Pb2+ and Cd2+.
 |
| | Fig. 5 The effect of the concentration of KI. | |
Optimization of the concentration of VC
VC is well known to be a redox-type ion masking agent that can reduce other interfering ions except for Pb2+ and Cd2+. It is reported that VC can reduce the oxidation of KI in acidic conditions. This study is performed in HNO3 and HNO3 has certain oxidation ability. Therefore VC is necessary to protect the function of KI. In addition, VC can also reduce some high-valence metal ions to reduce the interference in the determination.29 Besides, VC is an organic acid, which is beneficial to the reaction of KI and ions. Therefore, different concentrations of VC solution were added. From Fig. 6, it can be seen that the current response to Cd2+ reached the peak when the concentration of VC was 5%. Meanwhile, there was no observable regularity for Pb2+. Therefore, 1 mL of 5% VC was used for the subsequent experiments.
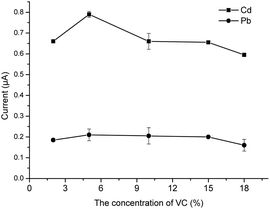 |
| | Fig. 6 The effect of the concentration of VC. | |
Optimization of the concentration of eluent
For the eluent, the concentration of the back extraction acid was a key point because it can not only affect the elution degree of Pb2+ and Cd2+ but also affect the pH of the electrochemical buffer to be tested. The influence is indicated in Table 1. The current response with 5% HNO3 was much higher than that with 10% HNO3 for Cd2+, while there were no obvious effects for Pb2+. This may be because Cd2+ was more sensitive than Pb2+ to the pH, and although there was no significant difference in elution rate between 5% HNO3 and 10% HNO3, the pH of the electrochemical working buffer can be obviously affected. Therefore, 5% HNO3 was chosen as the back-extraction eluent.
Table 1 Study on the concentration of eluent
| Eluent |
The current of rice (μA) |
The current of wheat (μA) |
| Cd |
Pb |
Cd |
Pb |
| 5% HNO3 |
1.09 |
0.36 |
0.83 |
0.47 |
| 10% HNO3 |
0.62 |
0.33 |
0.63 |
0.47 |
Plotting matrix-matched calibration curves
Under the optimum experimental conditions, matrix calibration curves of Pb2+ and Cd2+ in rice and wheat were obtained with a portable heavy metal electrochemical analyzer. The matrix effect was a ubiquitous phenomenon, and although we had eliminated the matrix effect as far as possible in the pretreatment process, there were still some disturbances left. As shown in Fig. 7, after pretreatment, the spectrum of the sample was almost the same as that of the standard solution, and there were no impurity peaks. However, the current of the sample matrix solution was slightly lower than that of the standard solution at the same concentration. It can also be seen from Fig. 7 that there was no statistical difference in the slope of the same element in the different matrices, except for the standard solutions (p < 0.05). More details can be found in the ESI.† The reason for this phenomenon may be the inhibition phenomenon. Reagents have different intensities of inhibition on different target ions. Therefore, the most practical way to solve the matrix effect was the application of matrix-matched standard calibration, which can compensate for the response of the target in the standard solution and the sample solution to the same extent.30,31 Considering the above, the external calibration curve method was used and matrix-matched standard calibration curves of rice and wheat were plotted in this work (Fig. 8). For the instrument, we designed different matrix measurement modes, and built in a matrix standard curve corresponding to different matrices. The correlation coefficients were 0.9983 and 0.9980 for Cd2+ in rice and wheat, respectively. And the correlation coefficients were 0.9984 and 0.9962 for Pb2+ in rice and wheat, respectively. The linearity between the current signal response and the concentration of Cd2+ and Pb2+ was good in the range of the common concentration range in samples. In practice, the LOD of Cd2+ in rice and wheat can be calculated as 6.10 μg kg−1 and 9.38 μg kg−1, and the LOD of Pb2+ in rice and wheat can be calculated as 34.9 μg kg−1 and 31.1 μg kg−1, respectively. The LOQ of Cd2+ in rice and wheat was 20.33 μg kg−1 and 31.25 μg kg−1, and the LOQ of Pb2+ in rice and wheat was 116.4 μg kg−1 and 103.7 μg kg−1. Compared with the analytical performance of other electrode methods that have been published recently, this developed method showed a consistent sensitivity and low detection limit,32–34 with no need for pre-concentration performed using a digestion procedure.
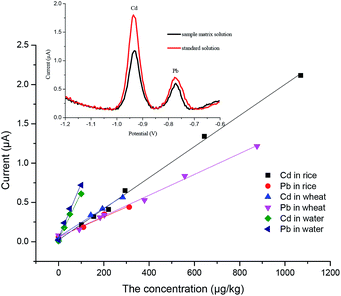 |
| | Fig. 7 Comparison and analysis of calibration curves of the standard solution and sample solution. Inset: square-wave stripping voltammograms at the SPEs for concentration levels of Cd2+ and Pb2+ at 12.5 μg L−1 and 6.5 μg L−1 in 0.5 M acetate buffer; deposition E: −1.3 V; deposition time 200 s. | |
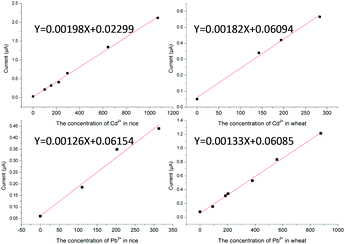 |
| | Fig. 8 The matrix-matched standard calibration curves of Cd2+ and Pb2+. | |
Precision and stability
Precision was evaluated by determining one sample for seven replicates. RSD was less than 8.7% for Cd2+ and Pb2+. Furthermore, in the three-person evaluation model, standard materials that contained Cd2+ and Pb2+ at 100 (±15%) μg kg−1, 200 (±15%) μg kg−1 and 400 (±15%) μg kg−1 were analyzed. Each person tested one sample seven times independently. The results are shown in Table 2 with recoveries between 83% and 120% and RSDs less than 8%. These data indicated that the method had good reproducibility.
Table 2 The precision and stability of the method for Cd2+ and Pb2+ in rice and wheat
| |
Conc. (μg kg−1) |
Reviewer 1 (μg kg−1) |
Reviewer 2 (μg kg−1) |
Reviewer 3 (μg kg−1) |
Mean conc. (μg kg−1) |
RSD (%) |
Recovery range (%) |
|
Conc. (μg kg−1) |
Reviewer 1 (μg kg−1) |
Reviewer 2 (μg kg−1) |
Reviewer 3 (μg kg−1) |
Mean conc. (μg kg−1) |
RSD (%) |
Recovery range (%) |
| Cd in rice |
106 |
116 |
124 |
125 |
118 |
7.1 |
95–120 |
Cd in wheat |
87 |
99 |
93 |
87 |
90 |
4.5 |
93–114 |
| 108 |
119 |
126 |
84 |
90 |
93 |
| 116 |
113 |
101 |
91 |
90 |
88 |
| 124 |
123 |
120 |
95 |
90 |
89 |
| 109 |
105 |
128 |
81 |
96 |
93 |
| 118 |
116 |
128 |
88 |
90 |
95 |
| 104 |
123 |
127 |
89 |
89 |
90 |
| 221 |
233 |
232 |
221 |
231 |
4.8 |
91–113 |
175 |
180 |
178 |
174 |
180 |
5.7 |
93–114 |
| 218 |
202 |
239 |
163 |
185 |
186 |
| 219 |
237 |
239 |
197 |
176 |
176 |
| 228 |
238 |
239 |
199 |
168 |
179 |
| 241 |
224 |
230 |
182 |
171 |
176 |
| 223 |
246 |
250 |
189 |
163 |
182 |
| 224 |
229 |
241 |
200 |
181 |
179 |
| 442 |
369 |
416 |
441 |
450 |
6.9 |
83–113 |
400 |
382 |
383 |
390 |
398 |
4.5 |
88–106 |
| 420 |
474 |
424 |
378 |
379 |
399 |
| 454 |
419 |
473 |
425 |
396 |
408 |
| 446 |
423 |
469 |
418 |
416 |
405 |
| 447 |
462 |
465 |
387 |
389 |
393 |
| 491 |
491 |
452 |
418 |
407 |
403 |
| 498 |
450 |
472 |
352 |
415 |
413 |
| |
Conc. (μg kg−1) |
Reviewer 1 (μg kg−1) |
Reviewer 2 (μg kg−1) |
Reviewer 3 (μg kg−1) |
Mean conc. (μg kg−1) |
RSD (%) |
Recovery range (%) |
|
Conc. (μg kg−1) |
Reviewer 1 (μg kg−1) |
Reviewer 2 (μg kg−1) |
Reviewer 3 (μg kg−1) |
Mean conc. (μg kg−1) |
RSD (%) |
Recovery range (%) |
| Pb in rice |
101 |
97 |
99 |
119 |
106 |
6.9 |
93–114 |
Pb in wheat |
92 |
92 |
107 |
89 |
96 |
5.4 |
95–112 |
| 101 |
94 |
114 |
100 |
95 |
96 |
| 94 |
101 |
114 |
97 |
88 |
97 |
| 104 |
100 |
111 |
100 |
91 |
93 |
| 107 |
98 |
115 |
88 |
97 |
96 |
| 110 |
106 |
108 |
101 |
103 |
100 |
| 106 |
108 |
115 |
92 |
93 |
103 |
| 202 |
188 |
216 |
224 |
221 |
7.6 |
93–120 |
184 |
167 |
175 |
164 |
180 |
5.0 |
89–105 |
| 223 |
201 |
222 |
177 |
186 |
190 |
| 222 |
189 |
238 |
189 |
188 |
186 |
| 202 |
214 |
242 |
192 |
171 |
184 |
| 241 |
242 |
213 |
183 |
170 |
185 |
| 222 |
242 |
235 |
179 |
193 |
168 |
| 232 |
230 |
208 |
183 |
168 |
175 |
| 405 |
481 |
433 |
466 |
446 |
5.6 |
100–120 |
368 |
365 |
339 |
364 |
358 |
5.3 |
90–107 |
| 505 |
424 |
439 |
370 |
333 |
347 |
| 468 |
463 |
450 |
355 |
335 |
392 |
| 427 |
496 |
411 |
379 |
335 |
365 |
| 470 |
445 |
415 |
352 |
343 |
393 |
| 454 |
412 |
434 |
368 |
339 |
371 |
| 440 |
407 |
455 |
368 |
330 |
373 |
Application to analysis of cereal samples
The practical applicability of the established method was further investigated with a real sample test. Sample preparation was performed according to the “Cereal sample preparation” section, and the following experiment was performed by the established method. The results were compared with ICP-MS to obtain a relative recovery. Table 3 shows satisfactory recovery results of 80–120% for both Pb2+ and Cd2+, and the results confirmed that the developed method has good availability.
Table 3 Comparison of the results of the electrochemical method and ICP-MS for real samples
| Sample |
Cd |
Pb |
| ICP-MS (μg kg−1) |
Electrochemical method (μg kg−1) |
Recovery (%) |
ICP-MS (μg kg−1) |
Electrochemical method (μg kg−1) |
Recovery (%) |
| Rice 1 |
261 |
248 |
95.02 |
220 |
251 |
114.09 |
| Rice 2 |
343 |
286 |
83.38 |
110 |
100 |
90.91 |
| Rice 3 |
611 |
586 |
95.91 |
297 |
240 |
80.81 |
| Rice 4 |
169 |
153 |
90.53 |
— |
— |
— |
| Rice 5 |
240 |
212 |
88.33 |
— |
— |
— |
| Rice 6 |
— |
— |
— |
340 |
335 |
98.53 |
| Wheat 1 |
80 |
96 |
120.00 |
410 |
384 |
93.66 |
| Wheat 2 |
155 |
166 |
107.10 |
220 |
178 |
80.91 |
| Wheat 3 |
211 |
253 |
119.91 |
209 |
187 |
89.47 |
| Wheat 4 |
575 |
623 |
108.35 |
402 |
393 |
97.76 |
| Wheat 5 |
— |
— |
— |
100 |
84 |
84.00 |
Conclusions
In summary, a rapid method for the detection and determination of Cd2+ and Pb2+ in rice and wheat based on electrochemical analysis with disposable screen-printed electrodes was established. The important sample pretreatment for the extraction and purification of the targeted ions was optimized and developed. With the optimal conditions, the electrochemical platform exhibited acceptable stability and reproducibility, and good portability. The present study demonstrated the excellent and practical potential of this method for the simultaneous determination of Cd2+ and Pb2+ in situ, with the obvious advantages of simplicity, high speed, and high sensitivity. Moreover, the whole process of high-throughput analysis could be completed in 25 min with a relatively low cost, which is especially suitable for high-throughput analysis. The electrochemical platform also exhibited acceptable stability and reproducibility, and good portability, which are of great importance for screening Pb2+ and Cd2+ in cereals on-site. Therefore, the method that we have developed is acceptable to monitor Pb2+ and Cd2+ simultaneously in cereal samples on-site.
Conflicts of interest
There are no conflicts to declare.
Acknowledgements
This study was funded by The National Key Research and Development Program of China and the Research Project of the National Special Project for Key Science and Technology of Food Safety (Grant No. 2017YFC1601300), and the Special Fund for Basic Research Business Expenses of Central-level Public Welfare Research Institutes (Grant No. ZX1913).
References
- M. B. Gumpu, S. Sethuraman, U. M. Krishnan and J. B. B. Rayappan, Sens. Actuators, B, 2015, 213, 515 CrossRef CAS.
- B. Sharma, S. Singh and N. J. Siddiqi, BioMed Res. Int., 2014, 2014, 1 Search PubMed.
- B. Chouhan, P. Meena and N. Poonar, J. Sci. Eng. Res., 2016, 4(4), 2015 Search PubMed.
- B. K. Bansod, T. Kumar, R. Thakur, S. Rana and I. Singh, Biosens. Bioelectron., 2017, 94, 443 CrossRef CAS PubMed.
- I. M. Chung, J. K. Kim, K. J. Lee, S. K. Park, J. H. Lee, N. Y. Son, Y. I. Jin and S. H. Kim, Food Chem., 2018, 240, 840 CrossRef CAS.
- S. Li, C. Zhang, S. Wang, Q. Liu, H. Feng, X. Ma and J. Guo, Analyst, 2018, 143, 4230 RSC.
- R. M. de Oliveira, A. C. N. Antunes, M. A. Vieira, A. L. Medina and A. S. Ribeiro, Microchem. J., 2016, 124, 402 CrossRef.
- X. Liu, F. Suo, M. He, B. Chen and B. Hu, Microchim. Acta, 2017, 184, 927 CrossRef CAS.
- M. A. Almessiere, R. Altuwiriqi, M. A. Gondal, R. K. AlDakheel and H. F. Alotaibi, Talanta, 2018, 185, 61 CrossRef CAS.
- E. J. Sneddon, C. J. Hardaway, J. Sneddon, K. Boggavarapu, A. S. Tate, S. L. Tidwell, D. P. Gary and C. Douvris, Microchem. J., 2017, 134, 9 CrossRef CAS.
- M. Lv, Y. Liu, J. Geng, X. Kou, Z. Xin and D. Yang, Biosens. Bioelectron., 2018, 106, 122 CrossRef CAS.
- G. Zhao, H. Wang, G. Liu, Z. Wang and J. Cheng, Ionics, 2017, 23, 767 CrossRef CAS.
- A. García-Miranda Ferrari, C. W. Foster, P. J. Kelly, D. A. C. Brownson and C. E. Banks, Biosensors, 2018, 8, 1 CrossRef.
- B. Molinero-Abad, D. Izquierdo, L. Pérez, I. Escudero and M. J. Arcos-Martínez, Talanta, 2018, 182, 549 CrossRef CAS.
- L. F. Ribeiro and J. C. Masini, Talanta, 2018, 185, 387 CrossRef CAS.
- G. M. S. Alves, L. S. Rocha and H. M. V. M. Soares, Talanta, 2017, 175, 53 CrossRef CAS.
- R. Rapini and G. Marrazza, Bioelectrochemistry, 2017, 118, 47 CrossRef CAS.
- X. Zhang, Y. Zhang, D. Ding, J. Zhao, J. Liu, W. Yang and K. Qu, Microchem. J., 2016, 126, 280 CrossRef CAS.
- G. Zhao, Y. Yin, H. Wang, G. Liu and Z. Wang, Electrochim. Acta, 2016, 220, 267 CrossRef CAS.
- J. Terán-Baamonde, R. M. Soto-Ferreiro, A. Carlosena, J. M. Andrade and D. Prada, Talanta, 2018, 186, 272 CrossRef.
- H. Wang, T. Jiang, Y. Tang, Y. Zou and T. Jiang, Food Sci., 2014, 35, 88 CAS.
- J. S. De Gois, I. O. Lucena, P. S. D. O. Cezario, A. P. Da Silva, I. C. A. Lima and A. S. Luna, Anal. Methods, 2018, 10, 1656 RSC.
- Y. Shi and A. Chatt, J. Radioanal. Nucl. Chem., 2014, 299, 867 CrossRef CAS.
- W. Xin, Chin. J. Spectrosc. Lab., 2008, 25, 705 CAS.
- A. C. C. Rodrigues and J. L. F. Monteiro, Appl. Catal., A, 2009, 362, 185 CrossRef CAS.
- M. Zhou, S. Wang and Y. Wu, Chin. J. Anal. Chem., 2014, 42, 459 CAS.
- M. Zhou, Y. Wu, J. Zhang, Y. Zhang, X. Chen, J. Ye and S. Wang, Anal. Sci., 2019, 35, 283 CrossRef CAS.
- N. Meeravali, R. Manjusha, K. Madhavi and S. Kumar, Desalin. Water Treat., 2016, 57, 26880 CrossRef CAS.
- A. M. D. S. Chandrathilaka, O. A. Heperuma and C. V. Hettiarachchi, J. Natl. Sci. Found. Sri Lanka, 2013, 41, 337 CrossRef CAS.
- Analytical Chemistry Division, Spectrochim. Acta, Part B, 1978, 33, 241 CrossRef.
- J. Zrostlıkova and J. Hajslova, J. Chromatogr. A, 2003, 1000, 181 CrossRef.
- W. Siriangkhawut, P. Sittichan, K. Ponhong and P. Chantiratikul, J. Food Compos. Anal., 2017, 59, 145 CrossRef CAS.
- H. J. Kim, D. W. Son, J. M. Park, D. Y. Hwang, C. Y. Mo, S. W. Park, G. Kim and J. B. Eun, Food Sci. Biotechnol., 2010, 19, 1211 CrossRef CAS.
- K. Keawkim, S. Chuanuwatanakul, O. Chailapakul and S. Motomizu, Food Control, 2013, 31, 14 CrossRef CAS.
Footnotes |
| † Electronic supplementary information (ESI) available. See DOI: 10.1039/c9ra05587h |
| ‡ These authors contributed equally to this work. |
|
| This journal is © The Royal Society of Chemistry 2019 |
Click here to see how this site uses Cookies. View our privacy policy here. 
 Open Access Article
 This Open Access Article is licensed under a
  *
*


