DOI:
10.1039/C9RA05538J
(Paper)
RSC Adv., 2019,
9, 27455-27463
Associative behavior of polyimide/cyclohexanone solutions†
Received
18th July 2019
, Accepted 23rd August 2019
First published on 2nd September 2019
Abstract
Our previous work has demonstrated that soluble polyimide with relatively weak interaction can be transformed from neutral polymer to associative polymer by increasing molecular weight. Thus, it is necessary to find another way to vary the relatively weak interaction strength, i.e. variation of solvent quality. Herein, viscoelastic behaviors are examined for 2,2-bis(3,4-dicarboxy-phenyl) hexafluoropropane dianhydride (6FDA)-2,2′-bis(trifluoromethyl)-4,4′-diam (TFDB) polyimide (PI), with a relatively low molecular weight (Mw) of 88![[thin space (1/6-em)]](https://www.rsc.org/images/entities/char_2009.gif) 000 g mol−1, dissolved in cyclohexanone (CYC). The scaling relationship between viscosity (η0–ηs) and volume fraction is in good agreement with the associative polymer theory proposed by Rubinstein and Semenov. Oscillatory rheological results indicate that the PI solution tends to become a gel with increased volume fraction. The synchrotron radiation small-angle X-ray scattering results imply the existence of dense aggregates in the concentrated PI/CYC solutions. Shear thickening and thinning behaviors are observed in the solutions, and the shear thickening behavior of polyimide solution has not been reported in literature. Their mechanisms are studied by conducting dynamic and steady rheological experiments. Thus, enhancing the relatively weak interaction strength can also make the low Mw polyimide show associative polymer behavior. This work can help us to gain deep insight into polyimide solution properties from dilute to semidilute entangled solutions, and will guide the preparation of polyimide solutions for different processing.
000 g mol−1, dissolved in cyclohexanone (CYC). The scaling relationship between viscosity (η0–ηs) and volume fraction is in good agreement with the associative polymer theory proposed by Rubinstein and Semenov. Oscillatory rheological results indicate that the PI solution tends to become a gel with increased volume fraction. The synchrotron radiation small-angle X-ray scattering results imply the existence of dense aggregates in the concentrated PI/CYC solutions. Shear thickening and thinning behaviors are observed in the solutions, and the shear thickening behavior of polyimide solution has not been reported in literature. Their mechanisms are studied by conducting dynamic and steady rheological experiments. Thus, enhancing the relatively weak interaction strength can also make the low Mw polyimide show associative polymer behavior. This work can help us to gain deep insight into polyimide solution properties from dilute to semidilute entangled solutions, and will guide the preparation of polyimide solutions for different processing.
1. Introduction
Associative polymers usually contain functional groups that tend to associate in selective solvents. Three kinds of associative polymers can be distinguished, namely, polymers containing a single associative group, two associative groups, and many associative groups. These associative polymers have been extensively studied in the past decades. Associative polymer solutions generally demonstrate useful rheological properties, such as increased viscosity, gelation, shear thickening, and shear thinning.1–3 Thus, it is necessary to analyze the physical properties of associative polymer solutions to guide the practical application. Rubinstein and Semenov proposed a theory for multisticker pair-wise associative polymers at various concentrations.4 The theory has been used to explain the rheological properties of many associative polymer systems.5–8
Aromatic polyimides (PIs) are a kind of high-performance polymers widely used in the aerospace, microelectronic, and fire-protection industries, among others.9–11 The unique stiff and aromatic backbone structure of PIs confer them with excellent mechanical, thermal, and electrical properties.12–15 To expand the application area, soluble polyimides have been synthesized. The solution behaviors have been studied in the previous studies, and they found that PIs exhibit random coil conformation with local rigidity in various solvents.16–20 Interestingly, some soluble PIs have shown aggregation behavior in different solutions. Viallat et al.21 confirmed the existence of charge-transfer (CT) complexes in PI solutions by using fluorescence spectroscopy. Luo et al.22 studied the aggregation behavior of PI in solution over a wide range of concentrations by UV-visible absorption and fluorescence spectra. Both intramolecular and intermolecular CT interactions were observed, and two critical concentrations are found from the relationship between the intensity ratio of intermolecular to intramolecular CT emission and concentration. Ogata et al.23 studied the aggregation behavior of semi-aromatic PIs in N-methylpyrrolidone solution. They concluded that the aggregation behavior is dominated by the balance between the increased bulkiness, the decreased charge–transfer interaction, the hydrogen-bonded interaction of the phenolic hydroxyl groups, and the π–π interaction of the phenyl rings.
By incorporating bulky –CF3 groups, PIs have better solubility, low dielectric constant, and high optical transparency.24–26 Zhang et al.27 studied the scaling behavior of a soluble fluorine-containing 6FDA-TFDB PI in DMF solution and found that the deviation of scaling exponents from neutral polymers is due to dipole–dipole and π–π interactions. They further revealed that the scaling exponents increase with increased molecular weight (Mw) in DMF.28 As the Mw reaches a critical value, the PI solution shows associative behavior in DMF because of increased interaction points along polymer chains.5 In our previous work, we found that solvent type considerably affected the scaling exponents and critical concentration of soluble 6FDA-TFDB PI solutions.29
Herein, the transformation behavior from neutral polymer to associative polymer has attracted our attention. Generally, there are two transformation ways, i.e. increase the number of associative groups from increasing the Mw and enhance the association strength from varying the solvent quality. Thus, it is necessary to analyze the transformation behavior of soluble polyimide from varying the solvent.
In the present study, the viscoelastic behavior of 6FDA-TFDB PI with relatively low Mw (88000 g mol−1, do not show associative polymer behavior in DMF) in cyclohexanone (CYC) solution was investigated. Interestingly, the scaling relationship between viscosity and concentration also fit the associative polymer theory proposed by Rubinstein and Semenov.4 To further analyze its associative behavior, SAXS and oscillation experiments were also conducted.
2. Background theory
2.1 Scaling behavior of associative polymer solution
When concentration is well above the gelation point (ϕ > 2ϕg), the dynamics of unentangled associative polymer solutions can be described by sticky Rouse model.4,30 The interchain association fraction Pinter can be defined as:| | |
Pinter ≈ (ϕ/ϕs)(1+z)/(3v−1) ≈ l1+zϕ(1+z)/(3v−1) for ϕ < ϕs
| (1) |
| | |
Pinter ≈ 1 for ϕ > ϕs
| (2) |
where l is the number of monomers between neighboring stickers and ϕs is the overlap concentration of the strands between stickers. The sticky Rouse time τRouse with unrenormalized bond lifetime is described as:| | |
τRouse ≈ τb(fPinter)2 ≈ τbf2l2+2zϕ(2+2z)/(3v−1) for ϕ < ϕren
| (3) |
where τb is the bond lifetime, f is the total number of stickers per chain. The viscosity is proportional to the modulus G1 and the relaxation time, which is expressed as:| | |
η ≈ G1τRouse ≈ (kTτb/b3)Nl2zϕ1+(2+2z)/(3v−1) for ϕ < ϕren
| (4) |
As we discussed in our previous work,5 due to the relatively weak interaction, the sticker separated from its old partner can always find a new sticker to pair, which do not need to renormalize the sticky Rouse and sticky reptation models. Nevertheless, enhanced interaction strength can also enhance the probability of the sticker associate again with its old one. Thus, the sticky Rouse model should be renormalized with increasing concentration. For the critical renormalization concentration ϕren, it can be expressed as:
| | |
ϕren ≈ (e−εl−2z)(3v−1)/(2+3z)
| (5) |
For our system, ϕren is between gelation concentration ϕg and entanglement concentration ϕe. And renormalized sticky Rouse model can be used to express the scaling relationship in this region. The renormalized bond lifetime  can be expressed as:
| |
 | (6) |
The relaxation time τRouse can be obtained by replacing τb by  , which is expressed as:
| | |
τRouse ≈ τbN2eε/2l3zϕ(6+7z)/[2(3v−1)] for ϕren < ϕ < ϕe
| (7) |
The viscosity is proportional to the modulus G1 and the relaxation time, which is expressed as:
| | |
η ≈ G1τRouse ≈ (kTτb/b3)Neε/2l3zϕ1+(6+7z)/[2(3v−1)] for ϕren < ϕ < ϕe
| (8) |
As concentration reaches to the entanglement threshold ϕe, the dynamics of the associative polymer solutions are described by the renormalized sticky reptation model.4 The sticky reptation model predicted a region of ϕ > ϕs with renormalized bond lifetime and fully interchain association. The renormalized bond lifetime  can be expressed as:
| |
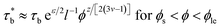 | (9) |
The relaxation time τrep is equal to:
| | |
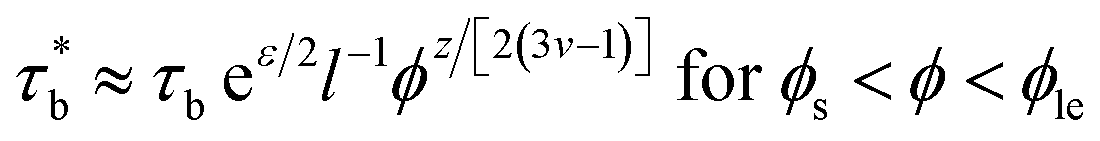
τrep ≈ τbeε/2l−1f2(N/Ne0)ϕ(1+z/2)/(3v−1) for ϕs < ϕ < ϕle
| (10) |
And the viscosity is expressed as:
| | |
η ≈ (kTτb/b3)eε/2(f3/Ne02)ϕ(1+3v+z/2)/(3v−1) for ϕs < ϕ < ϕle
| (11) |
Finally, the scaling relationship between viscosity and volume fraction applied in this study is summarized in Table 1.
Table 1 Scaling exponents of viscosity as a function of volume fraction for associative polymer solutions
| Volume fraction range |
Comment |
Exponent α in η ∼ ϕα (general form) |
Exponent α in η ∼ ϕα (good solvent) |
| ϕ < ϕren |
Unrenormalized bond lifetime; transfer of intrachain to interchain association |
1 + (2 + 2z)/(3v − 1) |
4.2 |
| ϕren < ϕ < ϕe |
Renormalized bond lifetime; transfer of intrachain to interchain association |
1 + (6 + 7z)/[2(3v − 1)] |
5.9 |
| ϕs < ϕ < ϕle |
Renormalized bond lifetime; mostly interchain association |
(1 + 3v + z/2)/(3v − 1) |
3.75 |
3. Experimental section
3.1 Chemicals
TFDB and 6FDA were purchased from Beijing Multi Technology and purified by sublimation in a vacuum at 130 and 250 °C for 48 h, respectively. N,N′-Dimethylacetamide (DMAc), N,N′-dimethylformamide (DMF) and tetrahydrofuran (THF) were purchased from Beijing Multi Technology. DMAc was dried in the presence of P2O5 overnight before use to reduce the influence of water. Cyclohexanone (CYC) was purchased from Macklin Biochemical Co., Ltd. Tetrabutylammonium bromide (TBAB) was obtained from Sinopharm Chemical Reagent Co. Ltd.
3.2 Synthesis of polyimide (PI)
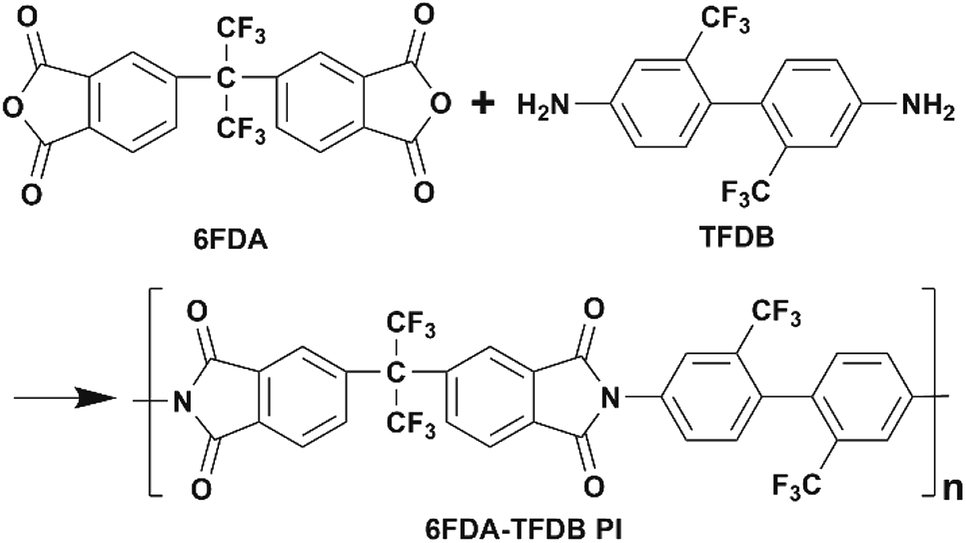
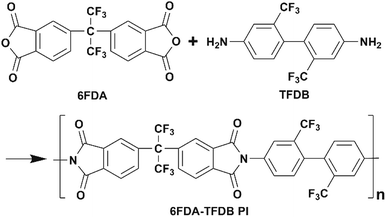
PI was synthesized by a two-step approach. First, we added TFDB into DMAc in a three-necked flask and stirred it until the monomer was dissolved completely. The same molar amount of 2,2-bis(3,4-dicarboxyphenyl) hexafluoro-propane dianhydride (6FDA) and moderate amount of o-phthalic anhydride were then added into the flask. The mixture was allowed to react for 48 h at room temperature under nitrogen atmosphere. We then added triethylamine and acetic anhydride into the above polyamic acid solution and chemical imidization lasted for 4 h to obtain PI solution. The solid sample was obtained by precipitating the solution in excess methanol. The PI sample was re-dissolved in DMAc and precipitated again to obtain a purified sample. The synthetic process was shown in Scheme 1.
 |
| | Scheme 1 Synthetic procedure of 6FDA-TFDB polyimide sample. | |
3.3 Fractionation of PI sample
Precipitation fractionation was applied to obtain a relatively narrow polydispersity sample. THF and deionized water served as good/poor solvent pair. By adding water into PI/THF solution dropwise, we can acquire fractions with different Mw.
3.4 FTIR spectrum
Fourier transform infrared (FT-IR) spectroscopy was measured with a Brucker Vertex 70 spectrometer. The solid PI specimen mixed with KBr was ground to powder and then compressed into a thin tablet for measurement. The FT-IR spectrum was shown in Fig. S1.† The imide carbonyl group can be confirmed with the peaks at 1786 (asymmetric C![[double bond, length as m-dash]](https://www.rsc.org/images/entities/char_e001.gif) O asymmetric stretching), 1728 (symmetric CO stretching), 719 (CO banding), and 1364 cm−1 (C–N stretching). The peaks normally characteristic bands of amide groups at 3363 (N–H stretching) and 1650 cm−1 (amide CO strength) cannot be found, indicating a nearly complete imidization.
O asymmetric stretching), 1728 (symmetric CO stretching), 719 (CO banding), and 1364 cm−1 (C–N stretching). The peaks normally characteristic bands of amide groups at 3363 (N–H stretching) and 1650 cm−1 (amide CO strength) cannot be found, indicating a nearly complete imidization.
3.5 1H NMR spectrum
1H NMR spectra were recorded with a Brucker AV400 NMR spectrometer using DMSO-d6 as a solvent. The 1H NMR spectrum was shown in Fig. S2.† PI chemical structures were confirmed with the resonance signals, which were δ 8.05 (d, J = 7.6 Hz, 2H), δ 7.94 (s, 2H), δ 7.87 (m, 4H), δ 7.68 (d, J = 8.2 Hz, 2H), and δ 7.44 (d, J = 8.2 Hz, 2H).
3.6 Size exclusion chromatography (SEC) coupled with multi-detectors
SEC was coupled with multidetector, which included 515 pump (Waters Technologies), 717 autosampler (Waters Technologies), two PL-gel 10 μm Mixed B-LS columns (Agilent Technologies), a ViscoStar Viscometer (Wyatt Technologies), 2414 refractive index detector (Waters Technologies), and DAWN HELEOS II multiangle laser light scattering detector (MALLS) (Wyatt Technologies). The system was run at 35 °C using DMF with 3.1 mM TBAB as the mobile phase at a flow rate of 1 mL min−1. The Mw distribution of pristine and experimental samples was shown in Fig. S3.† The absolute Mw (SEC-MALLS) and PDI of the experimental sample were 88000 g mol−1 and 1.24, respectively.
3.7 Rheological measurement
Rheological measurements were conducted on stress-controlled rheometer DHR-2 and strain-controlled rheometer ARES-G2 (both TA Instruments) at 20 °C. Dynamic measurements were conducted in the linear regime, as confirmed by the strain sweep measurements, with the parallel plate geometry on DHR-2. Shear rate sweep measurements were conducted with the cone and plate geometry (40 mm diameter, 2° cone angle, 56 μm truncation) on DHR-2. Temperature was controlled by Peltier system. Two semicircle plates were covered around the geometry to prevent solvent evaporation during measurements. Start-up measurements were also conducted in the cone and plate geometry (20 mm diameter, 2° cone angle, 49 μm truncation) with Peltier temperature control system on ARES-G2.
3.8 Synchrotron radiation small-angle X-ray scattering (SAXS)
Synchrotron radiation SAXS experiments were conducted on the BL19U2 beamline in Shanghai Synchrotron Radiation Facility (SSRF) at an incident X-ray wavelength of 1.033 Å and spot of 380 × 110 μm2. The beam and energy resolution were at 12 keV and 5 × 10⁻⁴, respectively, and the exposure period was 1 s. Samples were loaded into a fluid cell, and the final intensity profiles were an average of 20 exposures followed by the subtraction of background. The sample-to-detector distance was 2631 mm with Pilatus 1 M detector. The scattering vector q ranged from 0.01 Å−1 to 0.41 Å−1. The SAXS data was converted to I(q) as a function of q = 4πsinθ/λ by circular averaging, where I(q) was the scattering intensity and q was the scattering vector.
4. Results and discussion
4.1 Flow curves of PI/CYC solution in different volume fraction ranges
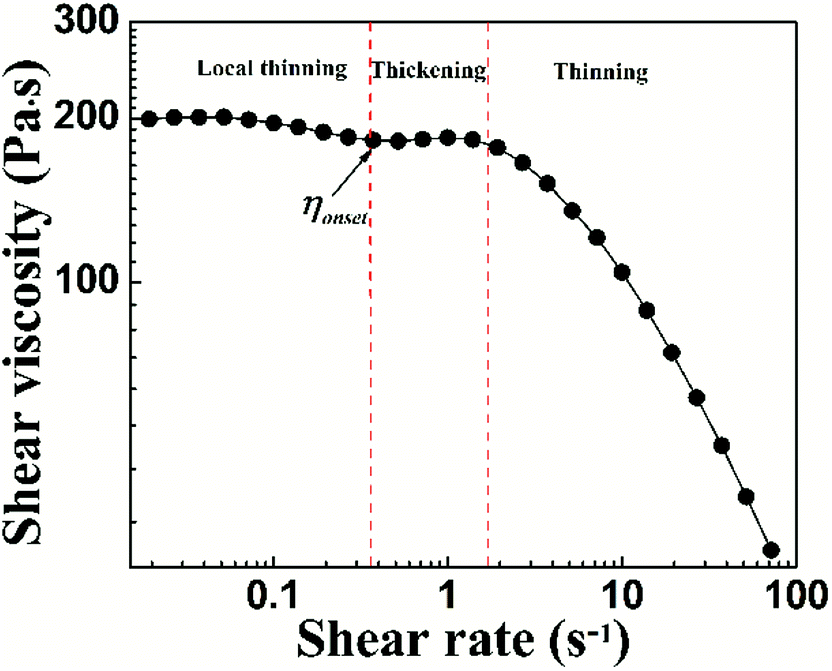
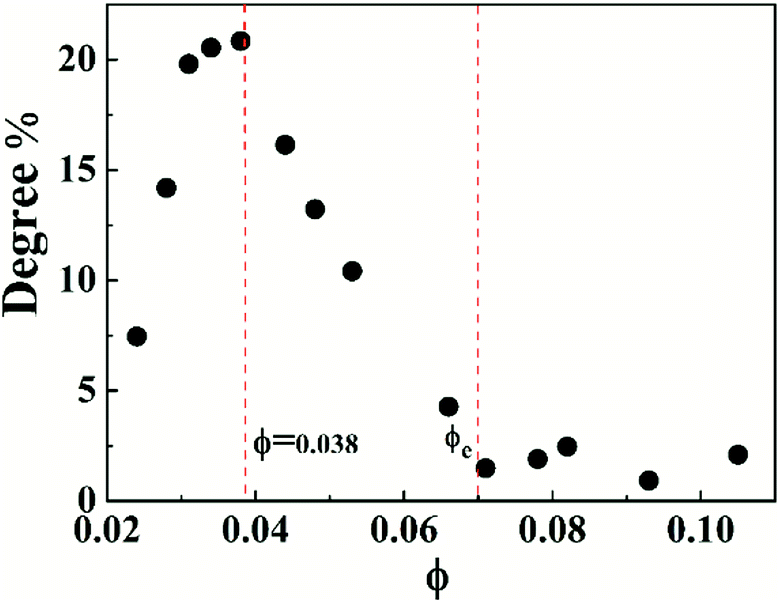
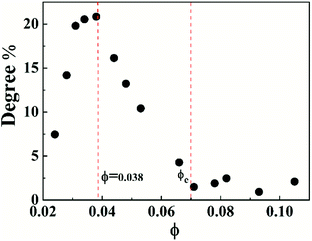
To characterize the flow behavior of 6FDA-TFDB PI/CYC solutions, steady shear measurements were conducted for different concentration solutions. The shear viscosity profiles at different volume fractions at 20 °C are shown in Fig. 1 (divided Fig. 1a–d is based on the result of Fig. 4). In Fig. 1a (2.0 × 10⁻³ < ϕ < 7.2 × 10⁻³), in the dilute region, the viscosities of the solutions exhibit Newtonian behavior in the applied range of shear rate (10 to 100 s−1, deviation is observed at high shear rate due to inertia effect of stress-controlled rheometer). In Fig. 1b, (0.011 < ϕ < 0.021), slight shear thinning can be observed at high shear rate. Above critical concentration, interchain associations are formed. The orientation of polymer chains and disassociation of interchain associations become faster than the re-form associations with increasing shear rate. In Fig. 1c, (0.024 < ϕ < 0.053). The solutions show slightly local shear thinning at low shear rates, followed by a shear thickening behavior at medium shear rates, prior to a dramatic shear thinning behavior at higher shear rates, as indicated in Fig. 2. The span of local shear thinning decreases with increased volume fraction, indicating that the onset of shear thickening shifts to lower shear rate. In Fig. 1d, (0.071 < ϕ < 0.110), the flow behavior is similar to that in Fig. 1c, and shear thickening becomes less obvious. The degree of shear thickening can be estimated by D = (ηmax − ηonset)/ηonset, where ηonset is the onset viscosity of thickening region (see Fig. 2) and ηmax is the maximum viscosity of thickening. The degree of shear thickening behavior initially increases and then decreases with increasing concentration, as shown in Fig. 3. Above entanglement concentration (ϕ > 0.070), the degree of shear thickening becomes very weak.
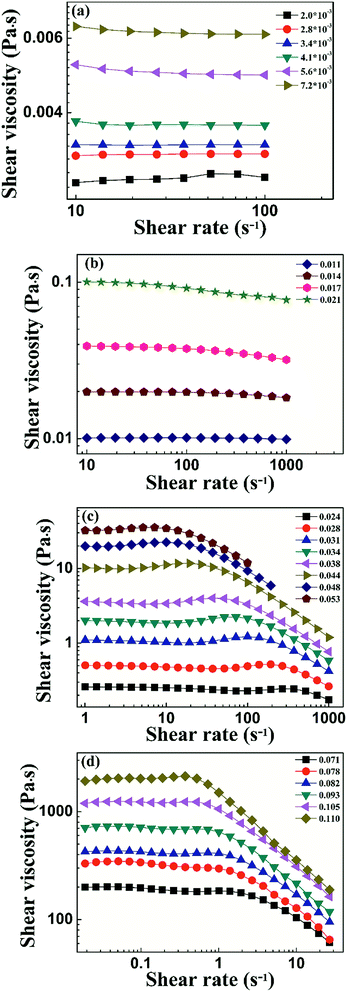 |
| | Fig. 1 Shear viscosity against shear rate of PI/CYC solutions with different volume fractions, 2.0 × 10⁻³ to 7.2 × 10⁻³ (a), 0.011–0.021 (b), 0.024–0.053 (c), 0.071–0.110 (d). | |
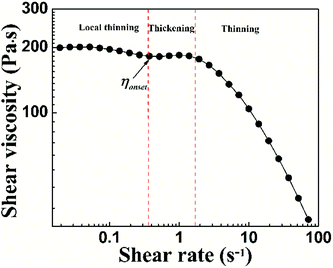 |
| | Fig. 2 Shear viscosity against shear rate of PI/CYC solutions at volume fractions of 0.066. | |
 |
| | Fig. 3 Variation of shear thickening degree with volume fraction for PI/CYC solutions. | |
By contrast, in Fig. S4,† PI/DMF solutions show Newtonian fluid behavior in dilute and semidilute unentangled solution. Evident shear thinning behavior due to the disentanglement of polymer chains only can be observed at concentration well above entangled concentration. The rheological behavior is quite different from that of the PI/CYC solutions shown in Fig. 1.
4.2 Scaling behavior in different volume fraction ranges
Based on the results of Fig. S4† and 1, the viscosity versus concentration of PI/DMF and PI/CYC solutions are plotted in Fig. 4. The viscosities of PI/CYC solutions are markedly greater than that in DMF solutions. Interestingly, the scaling relationship is quite different for the two systems. Three concentration regimes for PI/DMF solution are observed, corresponding to Fig. S4a–c.† (i) In dilute solution, that is, ϕ < ϕ* (overlap volume fraction), where the scaling exponent is 1.28 up to ϕ* of 7.2 × 10⁻³. (ii) In semidilute unentangled solution, that is, ϕ* < ϕ < ϕe (entanglement volume fraction). The theoretical region predicted by the Rouse model for neutral polymer is 1.3–2.0, and the scaling exponent here is 2.27 up to ϕe of 0.062. The ratio of ϕe/ϕ* is 8.6, which is consistent with a ratio of ϕe/ϕ* of 5–10 extensively reported in literature.31,32 (iii) In semidilute entangled solution, that is, ϕ > ϕe. A scaling exponent of 5.00 is observed, which is higher than the theoretical region of 3.9–4.67 predicted by the reptation model. Although these scaling exponents in different concentration regimes are higher than theoretical values for neutral polymer,33 the deviation is not large. The deviation of scaling exponents from theoretical values is possibly due to the dipole–dipole interaction in 6FDA-TFDB PI/DMF solutions.27
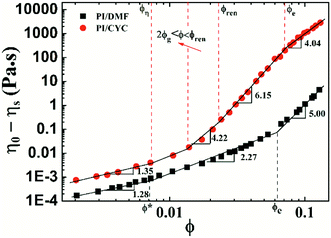 |
| | Fig. 4 Variation of viscosity (η0–ηs) with volume fraction for PI/DMF and PI/CYC solutions. | |
On the contrary, four regimes can be distinguished in the case for PI/CYC solutions, corresponding to Fig. 1a–d. We will apply the theory proposed by Rubinstein and Semenov concerning the dynamics of pair-wise associative polymers to explain our results. (i) ϕ < ϕη (critical concentration, equivalent to overlap concentration, ϕη = 7.3 × 10⁻³), where the solution dynamics is mainly controlled by intrachain associations. The scaling exponent is 1.35, which is slightly higher than that in PI/DMF solutions. For our PI sample, each structural unit behaves as a sticker. The percolated network can be formed when polymer coils overlap. Thus, the gelation volume fraction ϕg should be closed to ϕη. (ii) 2ϕg < ϕ < ϕren (renormalization critical concentration, calculated through the intersection of regime (ii) and (iii), ϕren = 0.023). Above the full gelation point (where all chains are involved into the network), the dynamics of unentangled associative solutions are described by sticky Rouse model. The fitted scaling exponent is 4.22, which is consistent with the theoretical value of 4.20 predicted by the sticky Rouse model in good solvent. The stronger concentration dependence of viscosity is due to the transformation of intrachain association into interchain association. (iii) ϕren < ϕ < ϕe (entanglement concentration, ϕe = 0.070). The value of the entanglement concentration is higher than that in PI/DMF solutions. With further increasing concentration, the bond lifetime has to be renormalized to take into account the increased probability of the sticker associates again with its old one. A rapid increase in viscosity due to high conversion of intrachain association into interchain association is observed. The fitted scaling exponent is 6.15, corresponding to the scaling exponent of 5.90 predicted by the sticky Rouse model in the concentration range of unentangled solution with renormalized bond lifetime in good solvent. (iv) ϕ > ϕe. Above entanglement concentration, the dynamics of associative solutions are described by the sticky reptation model. In this concentration regime, polymer chains are connected by interchain bonds and entanglements. According to theory of Rubinstein and Semenov,4 two scaling regions exist depending upon whether the strands between stickers are overlapping (ϕs) or entangled (ϕle). A scaling exponent of 3.75 has been predicted if the strands are overlapping. If strands are entangled, the scaling exponent would be 4.72. It should be noted that, the critical concentration ϕle means that the entanglement volume fraction of strands between stickers. However, for our system, each monomer is a sticker and it cannot entangle between monomers. Thus, ϕle cannot be seen in our system. The fitted scaling exponent in this concentration region is 4.04, which is closed to the predicted value of 3.75 when ϕs < ϕ < ϕle. This means that above entanglement concentration, the strands between stickers are close to their overlapping concentration (ϕs). The associations in this situation are mostly interchain, however, the number of entanglements increase strongly with concentration. This is also reflected in Fig. 3, in which shows the concentration dependence of shear thickening degree. Above the entanglement concentration of 0.070, the shear thickening degree becomes rather weak, indicating only a small fraction of intrachain associations can be transformed into interchain associations. Similar observations were also reported for multisticker and telechelic associative polymers.6,7,34 Overall, the scaling behaviors of the viscosity with concentration are in good agreement with the theory proposed by Rubinstein and Semenov.4 The dynamics of PI/CYC solutions are mainly dominated by the conversion from intrachain associations into interchain associations in the sticky Rouse region and by the sticky reptation process where most associations are interchain.
The dissolution process of polar polymer in a polar solvent is controlled by the breaking up of dipole–dipole interaction between polymer chains, and then new dipole–dipole bonds between polymer chains and solvent molecules are formed. DMF exhibits higher polarity compared with CYC, and the interchain dipole–dipole interaction can be screened effectively in DMF solutions. Thus, PI/DMF solutions show no associative behavior. The interchain interaction is strengthened in CYC solutions, making polyimide solutions show associative polymer properties.
4.3 Linear rheological properties
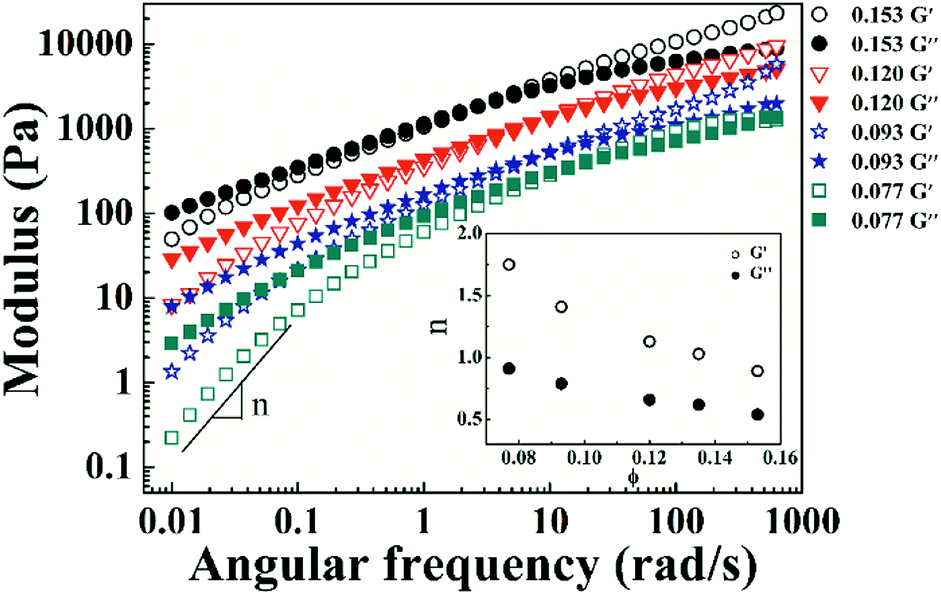
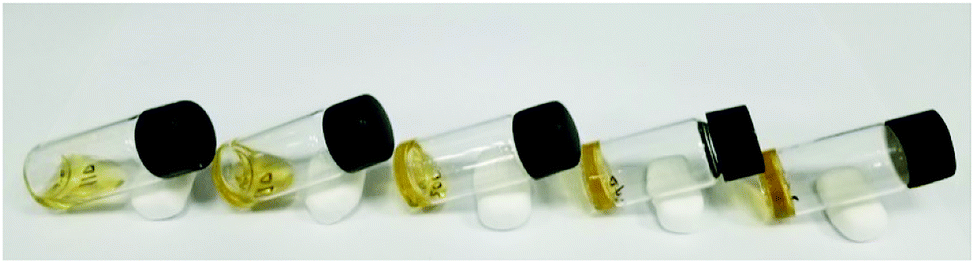
Variations in storage (G′) and loss (G′′) moduli with angular frequency for the PI/CYC solutions at different volume fractions are shown in Fig. 5. The crossover points of G′ and G′′ shift to low frequency with increased volume fraction. The linear viscoelastic response differs from the classical Maxwell model, as illustrated by the weak dependence of G′ and G′′ in the terminal zone. This finding presumably reflects a broad terminal relaxation mode caused by both effects of interchain association and topological entanglement.35 With increased volume fraction from 0.077 to 0.153, the slope of G′ versus ω decreases from 1.75 to 0.89, and the slope of G′′ versus ω decreases from 0.91 to 0.54, as shown in the inset of Fig. 5. Winter and Chambon36–38 showed that at the gel point, G′ and G′′ depend on frequency in the same manner, that is, G′ ∼ G′′ ∼ ωn. The scaling exponents for G′ and G′′ tend to decrease to a similar value with increased concentration, indicating the formation of gel like structure. This result is also reflected in the photographs of PI solutions in Fig. 6. The PI solution gradually loses flowability as volume fraction increases from 0.071 to 0.153. These findings demonstrate that the concentrated PI/CYC solutions tend to gelatinize. In fact, a critical gel can be formed for high Mw polyimide in CYC solution, which will be discussed in further work.
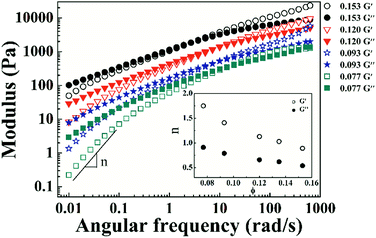 |
| | Fig. 5 Variation of modulus (storage G′ and loss G′′) with angular frequency for polyimide/CYC solutions with different volume fractions. Inset is the change of slope in terminal region with volume fractions. | |
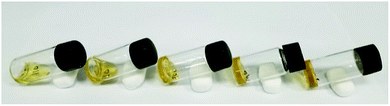 |
| | Fig. 6 Photographs of PI/CYC solutions (5 minutes' standing), from left to right corresponding to the volume fractions of 0.077, 0.105, 0.120, 0.139, 0.153, respectively. | |
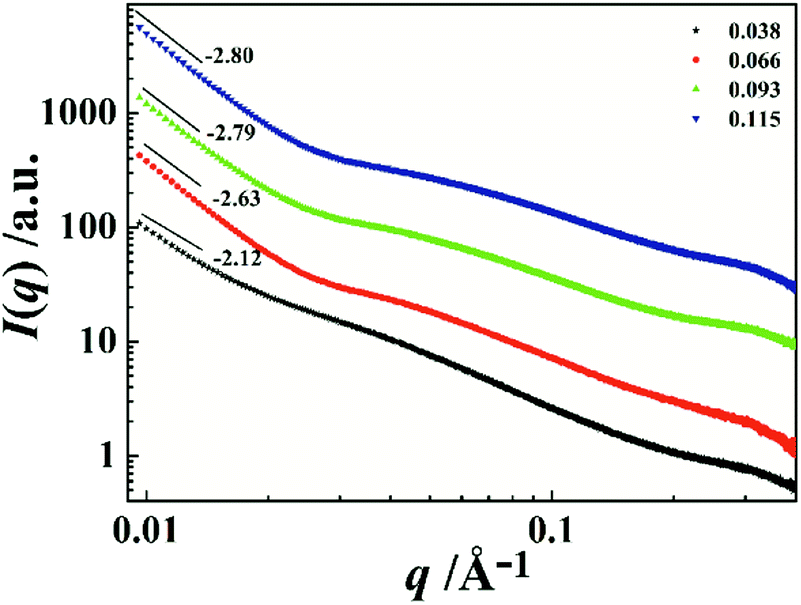
To further investigate the associative behavior of PI/CYC solutions, synchrotron radiation SAXS was conducted at different volume fractions. As seen in Fig. 7, the shape of the scattering curves is similar when volume fraction exceeds 0.038, and the scattering intensity increases with increasing volume fraction. An upturn in I(q) at low q range is found, indicating inhomogeneity of the size distribution of aggregates and spatial distribution.39,40 The low angle portions of the SAXS profiles can be fitted by the power law
where
I(0) is a prefactor and
P is regarded as the fractal dimension (
Df). The fractal dimensions
Df were determined from the slope of log
I(
q)–log
q. The
Df equals to 1.0 for loosely connected aggregates with indistinct interfaces and 3.0 for dense aggregates. The determined
Df values are 2.63, 2.79 and 2.80 corresponding to volume fraction of 0.066, 0.093 and 0.115, respectively. This feature indicates a dense aggregate structure of our PI/CYC solutions. Notably, a shoulder peak is observed when volume fraction exceeds 0.038, indicating the formation of domains in PI/CYC solution. The position of this shoulder peak slightly increases with increasing volume fraction. From equation,
41where
q* is the scattering vector, the average distance between domain
d can be calculated as 13.7, 12.6, and 11.0 nm at volume fractions of 0.066, 0.093, and 0.115, respectively.
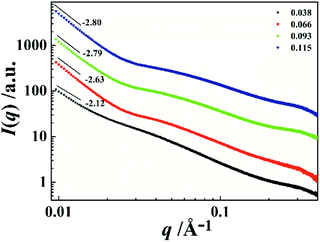 |
| | Fig. 7 Double logarithmic plot of synchrotron radiation SAXS intensity as a function of scattering vector for the PI/CYC solutions. The data are vertical shifted by 10α to avoid overlapping. | |
4.4 Shear thickening and shear thinning phenomena
Shear thinning phenomenon is first observed in the PI/CYC solution at ϕ = 0.017, which is only slightly above the critical concentration ϕη. Given that the concentration is higher than the critical concentration, polymer chains begin to contact with each other and form interchain interaction. Some polymer chains can serve as bridges to connect separate aggregates, forming of a weak network structure. When shear rate is high enough, polymer chains begin to be recognized and stretched along the shear direction.42 These bridges can be broken, and shear thinning occurs. Similar phenomenon has been observed in other polymer network system,43 and this behavior is explained by shear-induced network rupture, our result is consistent with popular case.
With increasing concentration, local shear thinning can be observed at low shear rates followed by shear thickening at medium shear rates. Shear thickening has been extensively studied in various associative systems, such as telechelic polymers, associative electrolytes, ionomers, wormlike micellar solutions, and partially hydrolyzed polyacrylamide. The mechanism of shear thickening for associative polymers has been classified into two main categories. The first ascribes thickening to an increase of the number of elastically active chains,6,44–46 whereas the second attributes thickening to nonlinear high tension along stretched polymer chains beyond the Gaussian range.47–49 The effect of these two mechanisms on the change of relaxation time (τ) is different. Based on the Sticky Rouse model,4
where
τe is the relaxation time of each strand, and
f* is the number of active crosslink point of each polymer chain.
τRouse increases with increased
f*, consists with the mechanism of increasing the number of elastically active chains. For chains under nonlinear stretching,
f* decreases due to the shortened lifetime of sticky point or the breakage probability of a sticky point. A decrease in relaxation time can be observed in this mechanism. The change of relaxation time in shear thickening process can be detected by parallel superposition of steady shear and oscillation test.
35 Hu referred to another method for detecting the relaxation time.
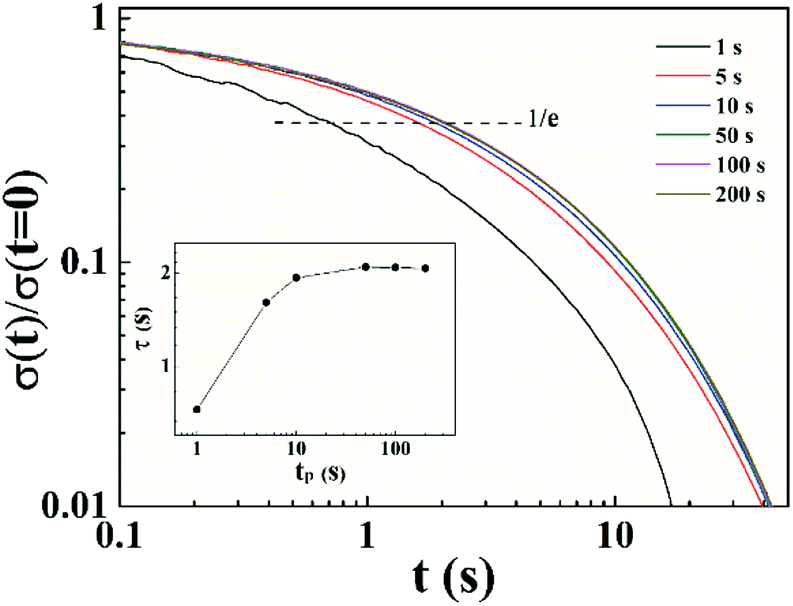
50 The relaxation time after pre-shearing various time at a certain shear rate can be measured by stress relaxation test. This method is more detailed in detecting relaxation time than the oscillation superposition experiment. Thus, we conducted start up tests at shear rate in shear thickening region at different concentrations. A representative result at
ϕ = 0.066 is shown in
Fig. 8. The normalized stress relaxation after pre-shearing with various times is shown, and the inset demonstrates the change of relaxation time with pre-shearing time. The relaxation time initially increases and then reaches a plateau with increasing pre-sheared time. Therefore, we believe that the shear thickening behavior is due to the increase in number of elastically active chains,
i.e., more intrachain associations transform into interchain associations during flow. The polymer chains are stretched in the flow process, leading to more interchain associations and thus to the increase of viscosity.
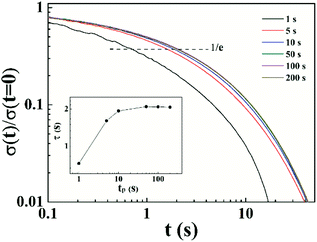 |
| | Fig. 8 Normalized stress relaxation measured after pre-sheared for various time tp = 1, 5, 10, 50, 100 and 200 s at ![[small gamma, Greek, dot above]](https://www.rsc.org/images/entities/i_char_e0a2.gif) = 1.38 s−1 (ϕ = 0.066). Inset shows the change of relaxation time after pre-sheared for different time. = 1.38 s−1 (ϕ = 0.066). Inset shows the change of relaxation time after pre-sheared for different time. | |
For the shear thinning behavior in associative polymer systems, the most plausible mechanisms are the dependence of the sticky point lifetime on shear rates and the non-affine deformations of the network at high shear rates.51,52 The interchain association is enhanced with increasing concentration, leading to the formation of network structure. Intrachain association can be transformed into interchain association during shear flow, leading to increased shear viscosity. At high shear rates, the network is broken and shear thinning occurs. The shear thinning behavior occurs in the concentration region shown in Fig. 1c, in which polymer chains exhibit no entanglement. The Cox–Merz rule53 relates the nonlinear properties and linear properties of polymers:
| | |
η() ≅ |η*(ω)|ω=
| (15) |
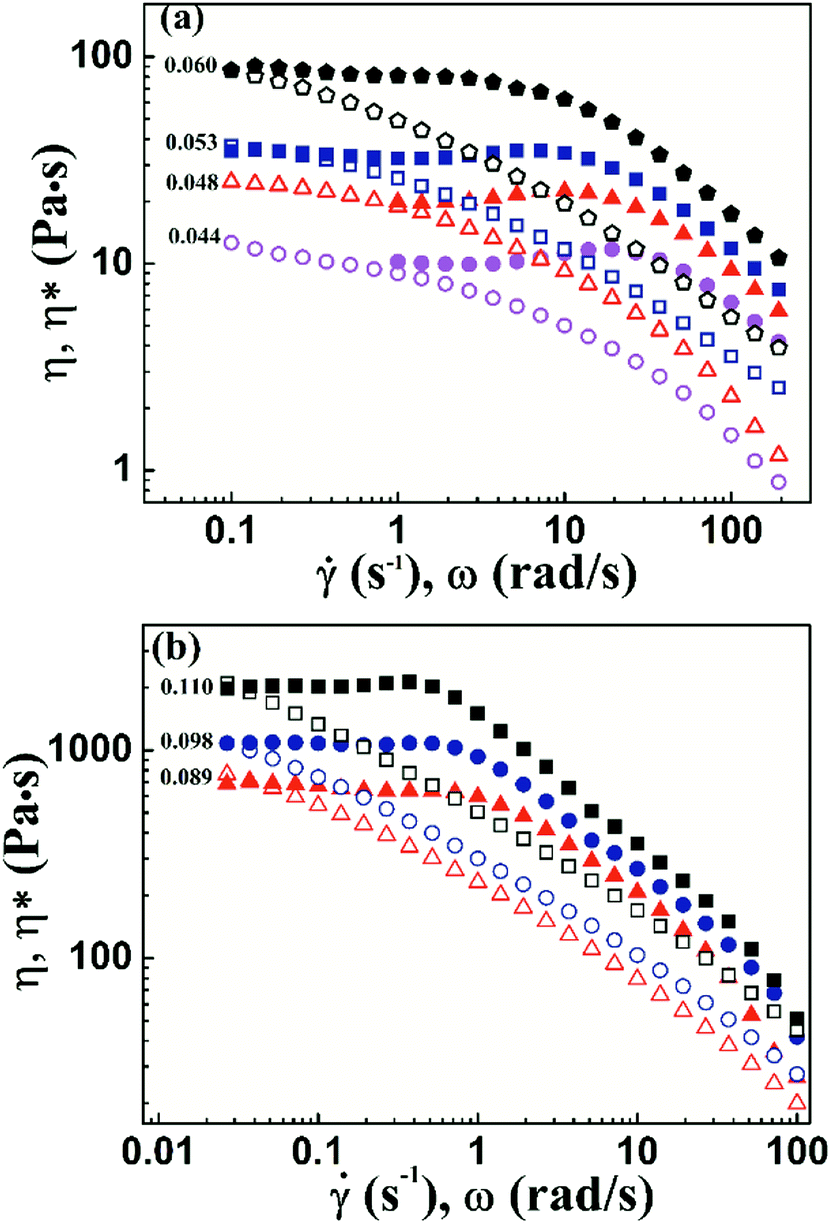
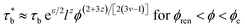
As shown in Fig. 9a, the Cox–Merz rule holds at low shear rates but severely fails at high shear rates. These results suggest that the shear thinning behavior in this region is mainly due to the shear-induced disruption of the network. The slope in shear thinning region is from −0.34 to −0.61. With further increased concentration, the PI chains begin to entangle. In this region, shear thinning is more remarkable, and the slope changes from −0.60 to −0.69. In general, both of interchain association and topological entanglement contribute to the network. At high shear rates, interchain interaction is broken, resulting in decreased viscosity. Shear thinning can be enhanced by the disentanglement of polymer chains. Furthermore, the Cox–Merz rule cannot hold at higher shear rates for different concentration solutions, which is shown in Fig. 9b. Thus, the shear thinning behavior observed in this study is attributed to the destruction of network and disentanglement of polymer chains during shear flow.
 |
| | Fig. 9 Steady viscosity and dynamic complex viscosity as functions of shear rate or frequency at various volume fractions, unentangled concentration range of 0.044–0.060 (a), entangled concentration range of 0.089–0.110 (b). | |
The nonlinear shear flow curves also show concentration dependence, that is, the degree of shear thickening changes with concentration. The degree of shear thickening initially increases and then decreases with increased concentration, which is shown in Fig. 2. This phenomenon can be explained by the model proposed by Vaccaro and Marrucci for associative polymers, which focuses on the change of the number of elastically active chains during flow.54 In the unentangled solutions, two processes account for the shear flow behavior. One is the transition from intrachain to interchain association during flow leading to shear thickening, and another is the destruction of network leading to shear thinning. Disentanglement of polymer chains also contributes to shear thinning in entangled solutions. The degree of shear thickening first increases due to the enhanced thickening process with increasing concentration. Above a critical volume fraction of 0.038, the thickening process becomes weaker due to the decreased fraction of intrachain associations in the system. Above entanglement concentration, the associations are mostly interchain, the degree of thickening becomes very weak. In addition, shear thinning process can be strengthened due to disentanglement process. Competition between these shear thickening and thinning processes is reflected in the variation of flow behavior with concentration, making the degree of shear thickening first increases and then decreases with increasing concentration.
5. Conclusions
The 6FDA-TFDB PI sample with Mw of approximately 88000 g mol−1 is synthesized. The associative behaviors of PI/CYC solutions over a broad volume fraction region are investigated by conducting steady and oscillation rheological tests. The scaling behavior of viscosity (η0–ηs) versus volume fraction ϕ in CYC solutions is in good agreement with the sticky Rouse model and sticky reptation model proposed by Rubinstein and Semenov, meanwhile the PI/DMF solutions can be described by the theory for neutral polymers. Oscillatory rheological results indicate that the PI/CYC solution tends to become a gel with increased volume fraction. And the synchrotron radiation small-angle X-ray scattering results indicate the existence of dense aggregates in concentrated PI/CYC solutions. Novel shear thickening followed by thinning behavior is observed in the PI/CYC solutions. These results yield convincing evidence to show that PI/CYC solutions exhibit associative behavior. The shear thickening behavior is due to the shear-induced increase in the number of elastically active chains, and the shear thinning behavior occurs not only from shear-induced destruction of network but also from the disentanglement of polymer chains during shear flow. Definitely, CYC as a solvent causes stronger dipole–dipole interaction in PI/CYC solutions compared with PI/DMF solutions. It demonstrates that variation of relatively weak interaction strength can transform PI from neutral polymer to associative polymer.
Conflicts of interest
There are no conflicts to declare.
Acknowledgements
We are grateful to the financial supports from National Basic Research Program of China (2014CB643604) and National Natural Science Foundation of China (51173178).
References
- C. Chassenieux, T. Nicolai and L. Benyahia, Curr. Opin. Colloid Interface Sci., 2011, 16, 18–26 CrossRef CAS
 .
. - S. Suzuki, T. Uneyama, T. Inoue and H. Watanabe, Macromolecules, 2012, 45, 888–898 CrossRef CAS .
- P. Kujawa, A. Audibert-Hayet, J. Selb and F. Candau, J. Polym. Sci., Part B: Polym. Phys., 2010, 42, 1640–1655 CrossRef .
- M. Rubinstein and A. N. Semenov, Macromolecules, 2001, 34, 1058–1068 CrossRef CAS .
- E. Zhang, X. Dai, Y. Zhu, Q. Chen, Z. Sun, X. Qiu and X. Ji, Polymer, 2018, 141, 166–174 CrossRef CAS .
- E. J. Regalado, J. Selb and F. Candau, Macromolecules, 1999, 32, 8580–8588 CrossRef CAS .
- S. L. Cram, H. R. Brown, G. M. Spinks, D. Hourdet and C. Creton, Macromolecules, 2005, 38, 2981–2989 CrossRef CAS .
- P. Kujawa, A. Audibert-Hayet, J. Selb and F. Candau, Macromolecules, 2006, 39, 384–392 CrossRef CAS .
- M. Ding, Prog. Polym. Sci., 2007, 32, 623–668 CrossRef CAS .
- D. J. Liaw, K. L. Wang, Y. C. Huang, K. R. Lee, J. Y. Lai and C. S. Ha, Prog. Polym. Sci., 2012, 37, 907–974 CrossRef CAS .
- Y. Ding, H. Hou, Y. Zhao, Z. Zhu and F. Hao, Prog. Polym. Sci., 2016, 61, 67–103 CrossRef CAS .
- J. Dong, C. Yin, X. Zhao, Y. Li and Q. Zhang, Polymer, 2013, 54, 6415–6424 CrossRef CAS .
- J. Feng, X. Wang, Y. Jiang, D. Du and J. Feng, ACS Appl. Mater. Interfaces, 2016, 8, 12992–12996 CrossRef CAS PubMed .
- X. Xiao, X. Qiu, D. Kong, W. Zhang, Y. Liu and J. Leng, Soft Matter, 2016, 12, 2894–2900 RSC .
- Z. Dong, T. Feng, C. Zheng, G. Li, F. Liu and X. Qiu, Chin. J. Polym. Sci., 2016, 34, 1386–1395 CrossRef CAS .
- M. Siddiq, H. Hu, M. Ding, B. Li and C. Wu, Macromolecules, 1996, 29, 7426–7431 CrossRef CAS .
- G. Liu, X. Qiu, S. Bo and X. Ji, Chem. Res. Chin. Univ., 2012, 28, 329–333 CAS .
- G. Liu, X. Qiu, M. Siddiq, S. Bo and X. Ji, Chem. Res. Chin. Univ., 2013, 29, 1022–1028 CrossRef CAS .
- G. Liu, X. Qiu, S. Bo and X. Ji, Chromatographia, 2012, 75, 7–15 CrossRef CAS .
- E. P. Savitski, F. Li, S. H. Lin, K. W. Mccreight, W. Wu, E. Hsieh, R. F. Rapold, M. E. Leland, D. M. Mclntyre, F. W. Harris, S. Z. D. Cheng and C. Wu, Int. J. Polym. Anal. Charact., 1997, 4, 153–172 CrossRef CAS .
- A. Viallat, R. P. Bom and J. P. Cohen-Addad, Polymer, 1994, 35, 2730–2736 CrossRef CAS .
- H. Luo, L. Dong, H. Tang, F. Teng and Z. Feng, Macromol. Chem. Phys., 1999, 200, 629–634 CrossRef CAS .
- Y. Ogata, K. Fujita, M. Nakanishi, M. Okaniwa and M. Sekiguchi, J. Polym. Sci., Part B: Polym. Phys., 2012, 50, 1312–1320 CrossRef CAS .
- G. Hougham, P. Cassidy, K. Johns and T. Dsvidson, Fluoropolymers 2: Properties, Kluwer Academic Publishers, New York, 2002 Search PubMed .
- C. Wang, W. Chen, C. Xu, X. Zhao and J. Li, Chin. J. Polym. Sci., 2016, 34, 1363–1372 CrossRef CAS .
- M. G. Dhara and S. Banerjee, Prog. Polym. Sci., 2010, 35, 1022–1077 CrossRef CAS .
- E. Zhang, X. Dai, Z. Dong, X. Qiu and X. Ji, Polymer, 2016, 84, 275–285 CrossRef CAS .
- E. Zhang, H. Chen, X. Dai, X. Liu, W. Yang, W. Liu, Z. Dong, X. Qiu and X. Ji, J. Polym. Res., 2017, 24, 47 CrossRef .
- H. Chen, E. Zhang, X. Dai, W. Yang, X. Liu, X. Qiu, W. Liu and X. Ji, J. Polym. Res., 2019, 26, 39 CrossRef .
- M. Rubinstein and A. N. Semenov, Macromolecules, 1998, 31, 1386–1397 CrossRef CAS .
- W. W. Graessley, Polymeric Liquids & Networks: Dynamics and Rheology, Garland Science, 1st edn, 2008 Search PubMed .
- R. H. Colby, M. Rubinstein and M. Daoud, J. Phys. II, 1994, 4, 1299–1310 CrossRef CAS .
- R. H. Colby, Rheol. Acta, 2010, 49, 425–442 CrossRef CAS .
- J. Sprakel, E. Spruijt, M. A. Cohen Stuart, N. A. M. Besseling, M. P. Lettinga and J. van der Gucht, Soft Matter, 2008, 4, 1696–1705 RSC .
- D. Xu, J. L. Hawk, D. M. Loveless, S. L. Jeon and S. L. Craig, Macromolecules, 2010, 43, 3556–3565 CrossRef CAS PubMed .
- H. H. Winter and F. Chambon, J. Rheol., 1986, 30, 367–382 CrossRef CAS .
- F. Chambon and H. H. Winter, J. Rheol., 1987, 31, 683–697 CrossRef CAS .
- H. H. Winter, Polym. Eng. Sci., 2010, 27, 1698–1702 CrossRef .
- P. K. Pandey, K. Rawat, V. K. Aswal, J. Kohlbrechere and H. B. Bohidar, Phys. Chem. Chem. Phys., 2017, 19, 804 RSC .
- J. Cheng, G. Shan and P. Pan, RSC Adv., 2015, 5, 62091–62100 RSC .
- H. S. Mansur, R. L. Orefice and A. A. P. Mansur, Polymer, 2004, 45, 7193–7202 CrossRef CAS .
- R. H. Colby, D. C. Boris, W. E. Krause and S. Dou, Rheol. Acta, 2007, 46, 569–575 CrossRef CAS .
- T. Loontjens, J. Put, B. Coussens, R. Lange, J. Palmen, T. Sleijpen and B. Plum, Macromol. Symp., 2001, 174, 357–371 CrossRef CAS .
- T. A. Witten and M. H. Cohen, Macromolecules, 1985, 18, 1915–1918 CrossRef CAS .
- K. C. Tam, R. D. Jenkins, M. A. Winnik and D. R. Bassett, Macromolecules, 1998, 31, 4149–4159 CrossRef CAS .
- T. A. Witten, J. Phys., 1988, 49, 1055–1063 CrossRef CAS .
- S. Ma and S. L. Cooper, Macromolecules, 2001, 34, 3294–3301 CrossRef CAS .
- Y. Séréro, A. V. Jacobsen, J. F. Berret and R. May, Macromolecules, 2000, 33, 1841–1847 CrossRef .
- G. Marrucci, S. Bhargava and S. L. Cooper, Macromolecules, 1993, 26, 6483–6488 CrossRef CAS .
- Y. T. Hu, J. Rheol., 2014, 58, 1789–1807 CrossRef .
- J. F. Berret, Y. Séréro, B. Winkelman, D. Calvet, A. Collet and M. Viguier, J. Rheol., 2001, 45, 477–492 CrossRef CAS .
- S. Suzuki, T. Uneyama and H. Watanabe, Macromolecules, 2013, 46, 3497–3504 CrossRef CAS .
- W. P. Cox and E. H. Merz, J. Polym. Sci., 1958, 28, 619–622 CrossRef CAS .
- A. Vaccaro and G. Marrucci, J. Non-Newtonian Fluid Mech., 2000, 92, 261–273 CrossRef CAS .
Footnote |
| † Electronic supplementary information (ESI) available. See DOI: 10.1039/c9ra05538j |
|
| This journal is © The Royal Society of Chemistry 2019 |
Click here to see how this site uses Cookies. View our privacy policy here. 
 Open Access Article
 This Open Access Article is licensed under a Creative Commons Attribution-Non Commercial 3.0 Unported Licence
 a,
Wenke Yanga,
Yanhu Xuea,
Xuepeng Qiu
a,
Wenke Yanga,
Yanhu Xuea,
Xuepeng Qiu can be expressed as:
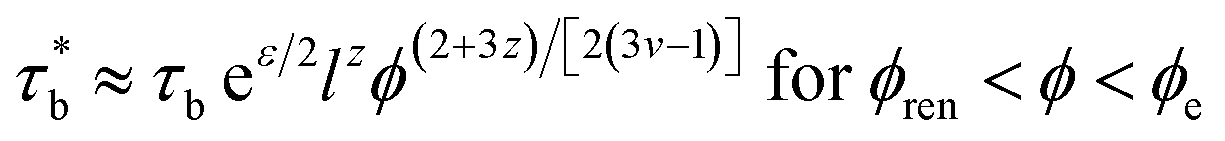
 , which is expressed as:
 can be expressed as: