
 Open Access Article
 This Open Access Article is licensed under a Creative Commons Attribution-Non Commercial 3.0 Unported Licence
Enhanced stability of an intrinsically disordered protein against proteolytic cleavage through interactions with silver nanoparticles†
Shahid A. Malik‡
,
Somnath Mondal‡ and
Hanudatta S. Atreya *
*
Department of Solid State and Structural Chemistry Unit, NMR Research Centre, Indian Institute of Science, Bangalore-560012, India. E-mail: hsatreya@iisc.ac.in
First published on 12th September 2019
Abstract
Intrinsically disordered proteins (IDPs), being sensitive to proteolytic degradation both in vitro and in vivo, can be stabilized by the interactions with various binding partners. Here, we show for the first time that silver nanoparticles (AgNPs) have the ability to enhance the half-life of an IDP, thereby rendering it stable for a month against proteolytic degradation. The conjugate of the unstructured linker domain of human insulin-like growth factor binding protein-2 (L-hIGFBP2) with 10 nm citrate-capped AgNPs was studied using two-dimensional NMR spectroscopy and other biophysical techniques. Our studies reveal the extent and nature of residue-specific interactions of the IDP with AgNPs. These interactions mask proteolysis-prone sites of the IDP and stabilize it. This study opens new avenues for the design of appropriate nanoparticles targeting IDPs and for storage, stabilization and delivery of IDPs into cells in a stable form.
Introduction
When nanoparticles come into contact with biomolecules, such as peptides and proteins, layers of biomolecules cover their surfaces, leading to the formation of a dynamic and competitive protein-corona.1–3 The formation of a protein corona has the potential to affect the properties of both the nanoparticles (e.g., cellular uptake, accumulation, degradation and clearance from the body)4–6 and the protein adsorbed on the surface (e.g., protein conformation).7 Hence, unexpected biological responses and toxicity may be induced.8 It therefore becomes important to probe the nature of interactions of biomolecules with nanomaterials. Several studies have focused on the interactions of globular/structured proteins with nanomaterials.9–12 However, the effects of the nanoparticles on intrinsically disordered proteins (IDPs) at atomic details have only recently begun to be unraveled.13 The IDPs are devoid of a well-defined three-dimensional (3D) structure, which allows them to get into a wide spectrum of interactions with their partners. However, IDPs are easily susceptible to proteolysis by a range of proteases and chaperones in vitro and in vivo,14,15 which makes it challenging to handle them for delivery into cells.16In the present study, we show that silver nanoparticles interact with an IDP and render it stable against proteolytic degradation, thereby enhancing its half-life and stability. The protein chosen was a central linker domain of the human insulin-like growth factor binding protein-2 (L-hIGFBP2) (residues K97-C191). The hIGFBP-2 in humans is the most abundant of the secreted proteins of the IGFBP superfamily (family of six high affinity proteins) that bind to insulin-like growth factors – IGF-I and IGF-II.17–19 All IGFBPs are structurally similar, each having three distinct domains; N-terminal domain, linker domain, and C-terminal domain.17–19 The N- and C-domains are structurally well folded but the linker domain remains flexible and intrinsically disordered (as shown in Fig. S1 of the ESI†). The IGFBPs are prone to proteolysis by proteases such as serine proteases, matrix metalloproteases and pepsin with most of the proteolytic sites being located in the linker domain of the protein.19
Using solution state 2D nuclear magnetic resonance (NMR) spectroscopy and monitoring the transverse relaxation times of amide protons T2(1HN) in combination with other techniques, we have probed the nature and dynamics of AgNP–IDP interaction. The study reveals an interaction of AgNPs with a specific region of the polypeptide, in addition to a reversible association–dissociation of L-hIGFBP2 (dynamic exchange) from the surface of AgNPs. Such interactions render L-hIGFBP2 stable for more than a month. This action was found to be similar to protease inhibitors, which protect proteins from proteolytic degradation. The study of the interaction of the IDPs with the nanoparticles, both in vitro and in vivo, can be used to achieve the binding of a particular IDP with the nanoparticles in a targeted manner in therapeutic applications, where the small molecules fail to provide the desirable results13,20,21 The present study will be helpful for exploring the applications of silver nanoparticles to store and deliver the IDPs into the cells in stabilised forms.22
Experimental
Materials and methods
 | ||
| Scheme 1 A schematic representation of the amino acid sequence of the L-hIGFBP2 with the additional tag regions coloured in green. | ||
A single transformed colony was used for overnight primary inoculation in 10 mL Luria Broth supplemented with 100 μg mL−1 ampicillin at 37 °C. The cells were centrifuged at 5000 rpm and washed once with M9 salt before transferring to minimal medium (1 L) supplied with 1 g L−1 nitrogen-15 labelled ammonium chloride. The cells were then allowed to grow till the (O.D.)600 reached ∼0.7 and then 1 mM isopropyl β-D-1-thiogalactopyranoside (IPTG) was used to induce the protein expression at 37 °C for 5 hours at 220 rpm. Cells were pelleted by centrifugation at 5000 rpm at 4 °C followed by the re-suspension in phosphate buffer saline (PBS) [150 mM NaCl, 10 mM Na2HPO4, 2.5 mM KCl, 2 mM KH2PO4, pH 7.4]. After the addition of 1 mM PMSF, the re-suspended pellet was sonicated and centrifuged at 10![[thin space (1/6-em)]](https://www.rsc.org/images/entities/char_2009.gif) 000 rpm for 45 minutes. The supernatant was collected and loaded onto the pre-equilibrated GST binding resin for 7 h at 4 °C. The resin was washed three times with each of 10 bed volume of PBS buffer, high salt buffer [25 mM HEPES, 0.5 M NaCl, 0.1% Triton X-100, 0.05% NaN3, pH 7.4] and low salt buffer [25 mM HEPES, 0.1 M NaCl, 0.1% Triton X-100, 0.05% NaN3, pH 7.4] buffer. The cleavage buffer (PBS) was used to wash the beads before adding HRV 3C protease to perform on-column cleavage at 4 °C for 16 h. Concentration of the protein was estimated by Bradford and nano-drop methods.
000 rpm for 45 minutes. The supernatant was collected and loaded onto the pre-equilibrated GST binding resin for 7 h at 4 °C. The resin was washed three times with each of 10 bed volume of PBS buffer, high salt buffer [25 mM HEPES, 0.5 M NaCl, 0.1% Triton X-100, 0.05% NaN3, pH 7.4] and low salt buffer [25 mM HEPES, 0.1 M NaCl, 0.1% Triton X-100, 0.05% NaN3, pH 7.4] buffer. The cleavage buffer (PBS) was used to wash the beads before adding HRV 3C protease to perform on-column cleavage at 4 °C for 16 h. Concentration of the protein was estimated by Bradford and nano-drop methods.
9,23 described protocol wherein the NaBH4 is used as a primary reducing agent and the TSC is used as the secondary reducing agent as well stabilizing agent. Briefly, freshly prepared solutions of sodium borohydride (final concentration 2 mM) and trisodium citrate (final concentration 2 mM) were mixed to a final volume of 48 mL and heated for 30 minutes at 60 °C with a constant stirring in the dark. After 30 minutes, 2 mL of freshly prepared solution of silver nitrate (1.17 mM) was added drop-wise to the above reaction mixture and subsequently, the temperature of the solution was adjusted to 95 °C. When the temperature reached 95 °C, sodium hydroxide solution (0.2 M) was added drop-wise to the above reaction mixture to adjust the pH to 10.5 and the solution was heated for 20 more minutes. The appearance of the pale-yellow colour infers the formation of the nanoparticles. This solution was allowed to cool at room temperature and later centrifuged at 13000 rpm for 35 minutes and washed many times with water to remove the unreacted reducing agents. The AgNPs formed were re-suspended in water or 50 mM phosphate buffer supplied with 150 mM NaCl as required.Results
Characterization of the AgNPs and AgNP–LhIGFBP2 conjugate
The citrate capped silver nanoparticles were imaged by high-resolution transmission electron microscopy (HR-TEM). The average size of the AgNPs was 10 nm (as shown in Fig. 1). Upon the addition of the protein (L-hIGFBP2), the nanoparticles retained their monodispersed nature (Fig. 1).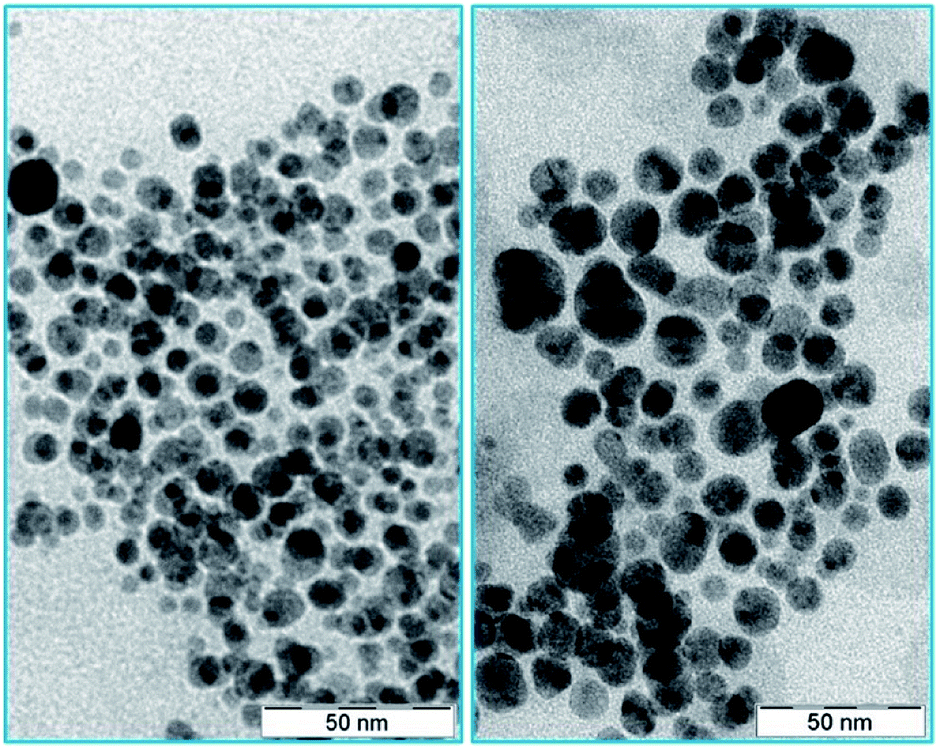 | ||
| Fig. 1 TEM images of AgNPs (left) and AgNP–LhIGFBP2 conjugate (right). | ||
The interaction of the L-hIGFBP2 with the nanoparticles was probed by UV-Vis spectroscopy, wherein the aqueous colloidal suspension of AgNPs yielded a surface plasmon resonance peak at ∼400 nm. This peak, in presence of the L-hIGFBP2, shifts towards higher wavelength due to the formation of the protein-nanoparticle conjugate (Fig. 2a).
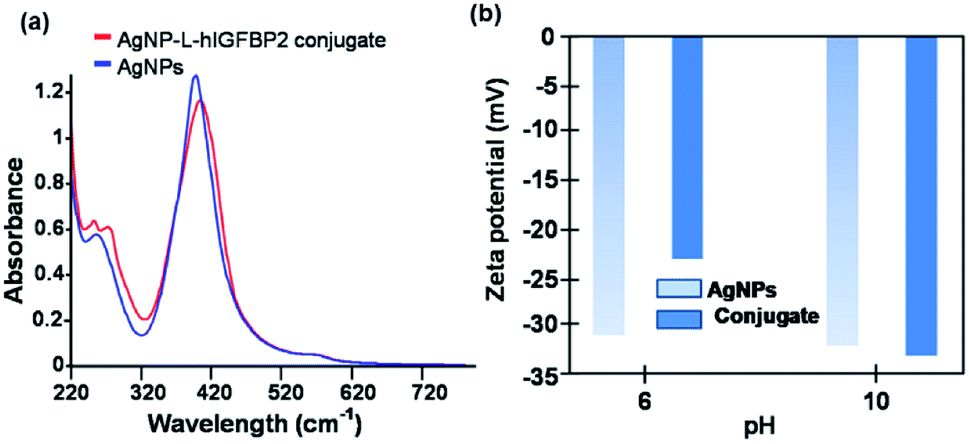 | ||
| Fig. 2 (a) UV-Vis spectra and (b) zeta potential of AgNPs and AgNP–LhIGFBP2 conjugate. | ||
The zeta potential (ξ) measurements were used to probe the surface charges of AgNPs and AgNP–LhIGFBP2 conjugate at two different pH values. The net charge, at pH 6, on the surface of the AgNPs and that in conjugation with the protein was found to be −31 mV and −23 mV, respectively (Fig. 2b).
At pH 6, there is a decrease in the surface charge of the silver nanoparticles upon the addition of the protein, which is attributed to the formation of the conjugate. Note that the protein having a pI of 9.17 has an overall positive charge at pH 6. At pH 10, the surface charge of the conjugate increases from −32 mV to −33 mV. At pH 10 the protein is expected to be negatively charged and hence exhibit a weaker interaction with the negatively charged AgNPs than at pH 6.
We quantified the strength of the protein-nanoparticle interaction through dissociation constant (Kd) obtained using isothermal titration calorimetry (ITC) (Fig. 3). The negative ΔH indicates an exothermic interaction. The Kd was obtained as: 0.5 ± 0.1 μM. The value of Kd in the μM regime hints towards a weak interaction of the AgNPs with L-hIGFBP2 and hence a fast-dynamic exchange of protein on the surface of nanoparticles is expected.
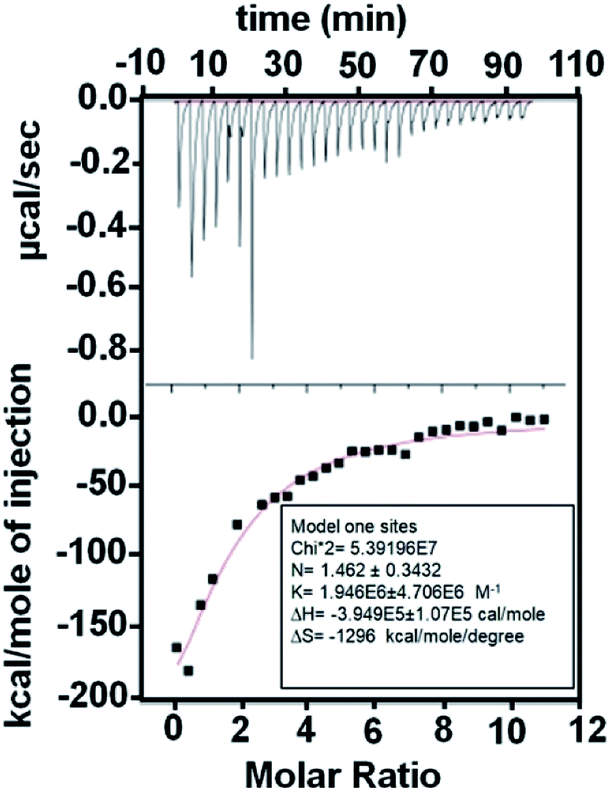 | ||
| Fig. 3 ITC data for the AgNP–LhIGFBP2 interaction. | ||
NMR studies of the AgNP–LhIGFBP2 conjugate
In order to characterize the dynamics of the protein nanoparticle interactions, NMR spectroscopy was used, which is a powerful tool to identify individual residues on the protein involved in the interactions with the nanoparticles.9,11,13 To study the effect of the AgNPs on L-hIGFBP2, we recorded 2D [15N, 1H] Heteronuclear Single Quantum Coherence (HSQC) NMR spectra of L-hIGFBP2 samples in the absence and presence of AgNPs at pH 6.In a 2D [15N, 1H] HSQC NMR spectrum, each cross-peak corresponds to a directly bonded 1H–15N spin pair of the backbone and side-chain of amino acid residues (except proline residues). Thus, the behaviour of each amino acid residue of L-hIGFBP2 can be individually probed.
We carried out two types of titrations to study the interaction. First, 500 μL of the uniformly 15N-labeled protein (400 μM) in 50 mM phosphate buffer containing 150 mM NaCl at pH 6 was taken in NMR tube and AgNPs from the stock solution (300 nM) were added as 10 μL, 20 μL, 30 μL, 40 μL and 50 μL corresponding to 5.9 nM, 11.8 nM, 17.6 nM, 23.5 nM and 29.4 nM, respectively, of AgNPs (after taking dilution into account). We refer to this as the ‘forward titration’.
In the second titration (referred to as the ‘reverse titration’), 500 μL of AgNPs (50 nM) was taken in the NMR tube and 15N-labeled protein (stock concentration 300 μM) was gradually added to it in the increments of 10 μL, 20 μL, 30 μL, 40 μL and 50 μL corresponding to the final concentration of the protein ∼6 μM, 12 μM, 18 μM, 24 μM and 30 μM, respectively, at each step of the titration. The reverse titration helps to obtain approximately the number of molecules bound to the nanoparticles10 as described below.
Forward titration: addition of AgNPs to L-hIGFBP2
Fig. 4a and b, respectively, show the spectral overlay and the plot of normalized peak intensities observed in 2D [15N, 1H] HSQC NMR spectra of L-hIGFBP2 in the absence and presence of silver nanoparticles, at pH 6.0 and 298 K. From the spectra, two observations can be made. First, in presence of the AgNPs, no significant chemical shift perturbations of the peaks are seen. This indicates that the protein retains its disordered conformation upon interaction. Second, a number of peaks are broadened out on the successive additions of the AgNPs. The average rotational correlation time (τc) of the protein was estimated using 15N relaxation rates measured from a 1D projection of the 2D 15N relaxation experiment24 and was found to increase slightly from 3.05 ± 0.15 ns in the free protein (400 μM) to 3.4 ± 0.1 ns in presence of 29.4 nM of AgNP. This implies the protein does not interact strongly with the AgNPs, indicating a dynamic association-dissociation as discussed below.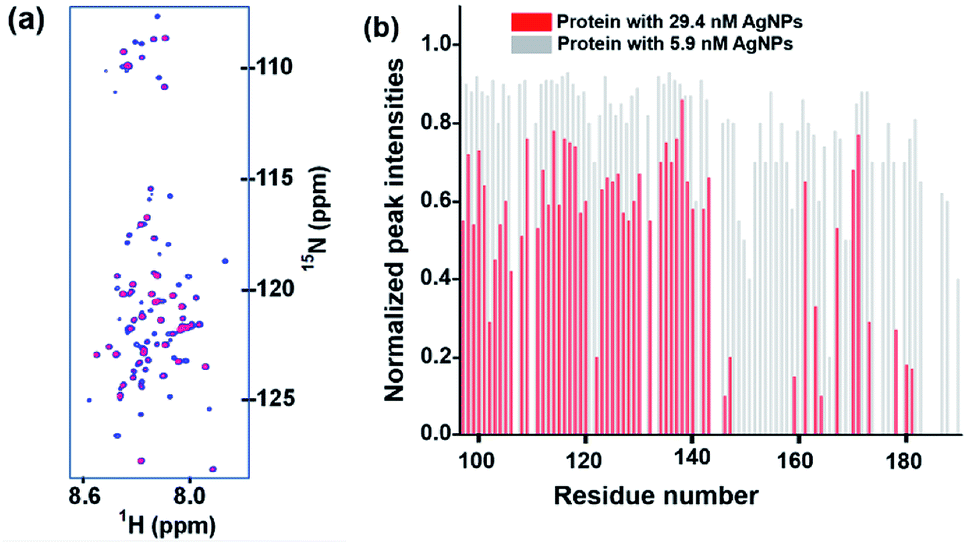 | ||
| Fig. 4 (a) An overlay of 2D [15N, 1H] HSQC spectra of L-hIGFBP2 in free form (blue) and upon addition of AgNPs (red). (b) The relative intensity of peaks of each residue in the 2D [15N, 1H] HSQC spectrum of AgNP–LhIGFBP2 complex. The intensities have been normalized for each residue with respect to its intensity in the free protein. The residue specific assignment of the protein has been described earlier.25 | ||
During the course of the titration, if the protein interacts strongly with the nanoparticle surface and spends a significant time on the surface of AgNPs (slow exchange regime), signals arising from the protein-nanoparticle conjugate, being of larger molecular weight, are expected to broaden out completely compared to that of the free protein. Thus, any peak observed in the spectrum would be from unbound protein. In such a case, wherein slow exchange takes place between the free protein and the AgNP-bound form of the protein on the T2 time scale (i.e., kex ≪ δR2, where δR2 = R2(bound) − R2(free)), the observed T2(1HN) values of the free protein signals would not vary significantly with the subsequent addition of nanoparticles.
In the other scenario, if the addition of the nanoparticles to the protein leads to a decrease in the observed T2(1HN) values of the protein as the nanoparticles are added, it implies a “fast exchange” of protein bound to the nanoparticle surface with that of the free protein molecules in the solution. In this fast exchange process, the decrease in the observed T2(1HN) or (1/R2) values result from the increase in the relative population of the bound form as the titration proceeds, resulting in a population-weighted average of the observed R2(1HN) as:
| R2 = pf × R2f + pb × R2b |
The amide proton transverse relaxation values T2(1HN) were measured using a two-point HSQC method: a previously described method to measure the paramagnetic relaxation enhancement (Γ) in proteins26 and also used for characterizing and ubiquitin-silver nanoparticle9 and ubiquitin–graphene oxide interaction10 Two different delay times (corresponding to 16 ms and 20 μs) were introduced while acquiring the spectra (two-point HSQC), keeping all other spectral parameters constant. Due to the transverse relaxation of the spins, the NMR signal shows an exponential decay, thus the residue specific NMR signal intensity, I, of amide protons (1HN), observed in a 2D [15N, 1H] HSQC experiment can be written as:
| I = exp(−Δ/T2(1HN)) |
| Iwith delay/Iwithout delay = exp(−(Δ2 − Δ1)/T2(1HN)) |
| T2(1HN) = (Δ2 − Δ1)/ln(Iwithout delay/Iwith delay) |
Thus, a T2(1HN) plot can be obtained by taking the ratios of peak intensities in the two spectra acquired with two delays. Further, if ratios of peak intensities relative to that in the free protein are considered, the effect on the intensity from 3JHNHA during the additional delay period is removed. Fig. 5 shows the absolute and the normalized relative residue specific T2(1HN) values of L-hIGFBP2 upon titration with the AgNPs relative to that of the free protein. The 2D plots of the residue specific absolute T2(1HN) values of free protein and its conjugate at the various indicated additions of AgNPs are shown in Fig. S2 of the ESI with respective values in Table 1 of ESI.†
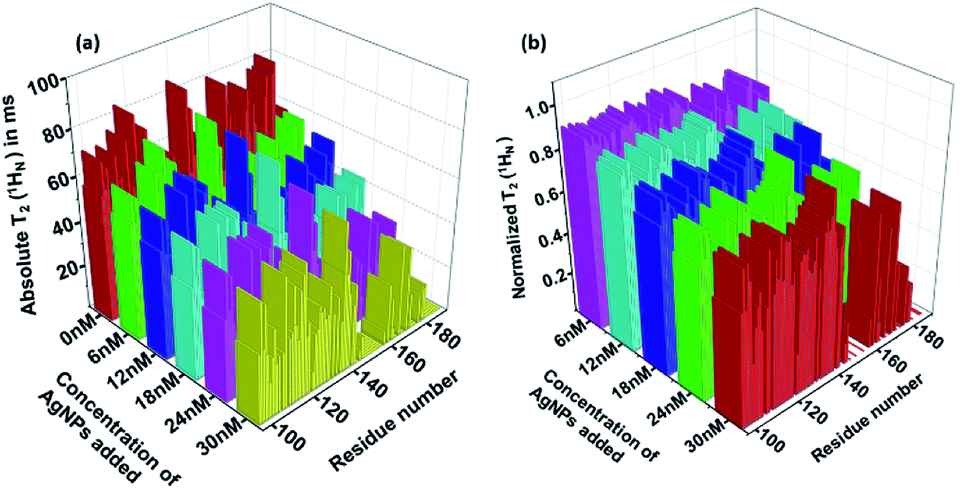 | ||
| Fig. 5 (a) The absolute T2(1HN) and (b) relative normalized T2(1HN) of each residue calculated from the 2D [15N, 1H] HSQC spectrum using the two-point method (see text) for AgNP–LhIGFBP2 complex at different indicated additions of AgNP. | ||
As discussed above, the decrease in the observed T2(1HN) values upon titration with the AgNPs implies a fast exchange between free and bound forms of the protein taking place on the surface of the nanoparticles.9 Binding of the L-hIGFBP2 to AgNPs affects all the residues in general, with some of the residues undergoing a large (>75%) reduction in T2(1HN) values. Upon a closer observation, we identified these residues as L145, K146, S147, G148, M149, K150, V154, F155, K158, T160, Q162, L174, E177, R183, R188 and T189. The residues indicated above which undergo the maximum effect of the interaction are largely positively charged residues (Lys, Arg) interspersed with hydrophobic residues. The effect on the positively charged residues is expected due the negative charge on the surface of the citrate-capped nanoparticles. This is very similar to that observed in the study involving interaction of an IDP with anionic silica nanoparticles.13
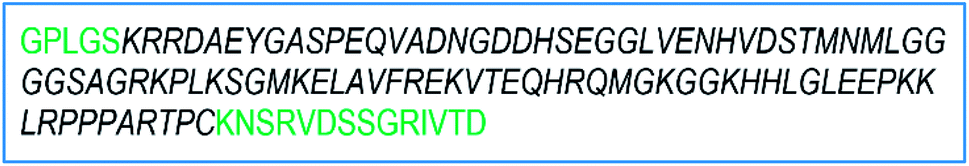
Interestingly, the majority of the residues which have maximal interaction are also located close to the protease cleavage sites of the protein: E151, L152, A153, R156, E157, R164, Q165, M166, K168, L176, L182. The protease cleavage sites are indicated by the arrows on the protein sequence (Fig. 6).19
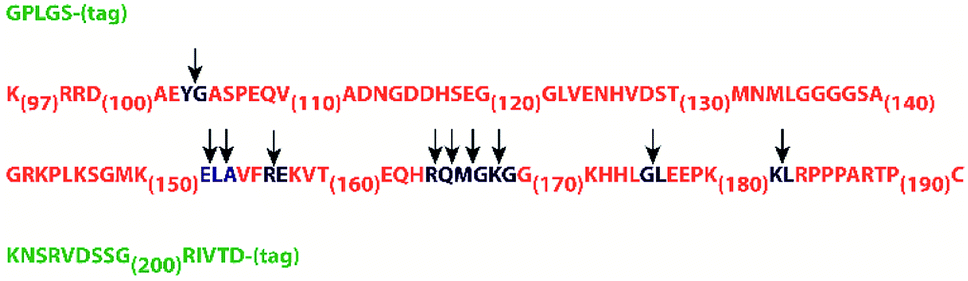 | ||
| Fig. 6 Amino acid sequence of L-hIGFBP2. The residues coloured in green are those which are incorporated within the sequence during the cloning process and the arrows represent the proteolytic sites in the sequence. | ||
The function of proteases is triggered in the sample during sample preparation and cell lysis. The relatively stronger interaction of the C-terminal part of the polypeptide with the silver nanoparticles (Fig. 4 and 5) presumably masks the proteolytic cleavage sites, which results in the enhanced longevity of the protein. This was verified by adding protease inhibitors to the protein, which also enhanced its longevity (discussed below).
Reverse titration: addition of L-hIGFBP2 to AgNPs
In order to confirm that the AgNP-bound form of the protein has very short T2(1HN) values, the “reverse titration” was carried out. This is shown in Fig. 7e, where the first spectrum acquired with addition of 10 μL of the protein to 50 nM of AgNP does not yield any observable signal. In order to rule out that this may be possibly due to low sensitivity of the protein sample, we carried out the experiment under the similar conditions in absence of AgNPs, where we observed all the cross peaks from the free protein at the same concentration (Fig. 7a). This implies that the absence of the cross peaks of protein in presence of the AgNPs is attributed to the major fraction of the protein being bound to the AgNPs compared to that of the free protein. As the protein concentration is increased, more peaks start appearing in the spectrum of the conjugate (Fig. 7g and h) and the intensity of the peaks increases gradually.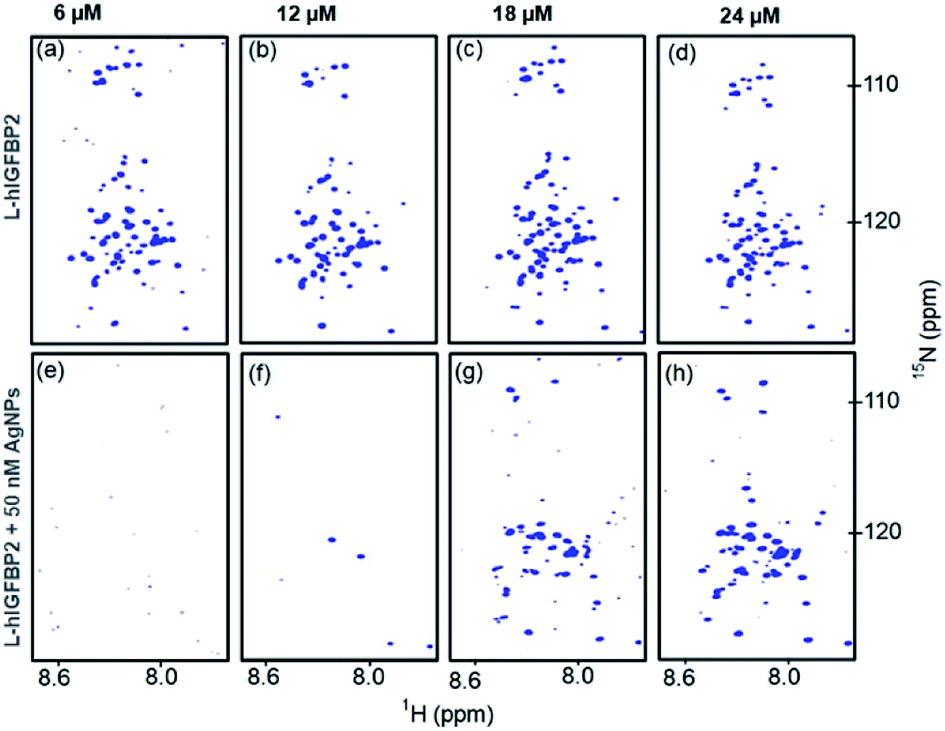 | ||
| Fig. 7 Reverse titrations. (a–d) 2D [15N, 1H] HSQC spectra of free L-hIGFBP2(top row) at different concentrations of protein (as indicated on the top) and (e–h) 2D [15N, 1H] HSQC spectra of AgNP–LhIGFBP2 conjugate containing 50 nM AgNPs (bottom row) at the same protein concentrations as for the free protein. | ||
Stability of the AgNP–LhIGFBP2 conjugate
IDPs are very sensitive to proteolytic cleavages leading to their faster degradation. The function of proteases is triggered in the sample during sample preparation and cell lysis. Hence, protease inhibitors are always added to samples containing IDPs.27 Free L-hIGFBP2 degrades within a week, whereas the conjugated L-hIGFBP2 remains stable for more than a month. In order to confirm the increased stability of L-hIGFBP2 is due to the interaction of citrate capped silver nanoparticles at the protease cleavage sites of the protein, we compared the effect of the silver nanoparticles and the protease inhibitor cocktail (10 μL mL−1) supplemented with 10 μL mL−1 EDTA (0.5 M stock).In presence of the protease inhibitors (which contain inhibitors for serine proteases and pepsin) the protein remains stable for >30 days. Fig. 8 shows the comparison of the spectra of the free L-hIGFBP2, in presence of AgNPs and in presence of protease cocktail at different intervals of time. The spectrum of the protein with AgNP remains unchanged after a month, compared to the free protein where the degradation peaks start appearing with a week.
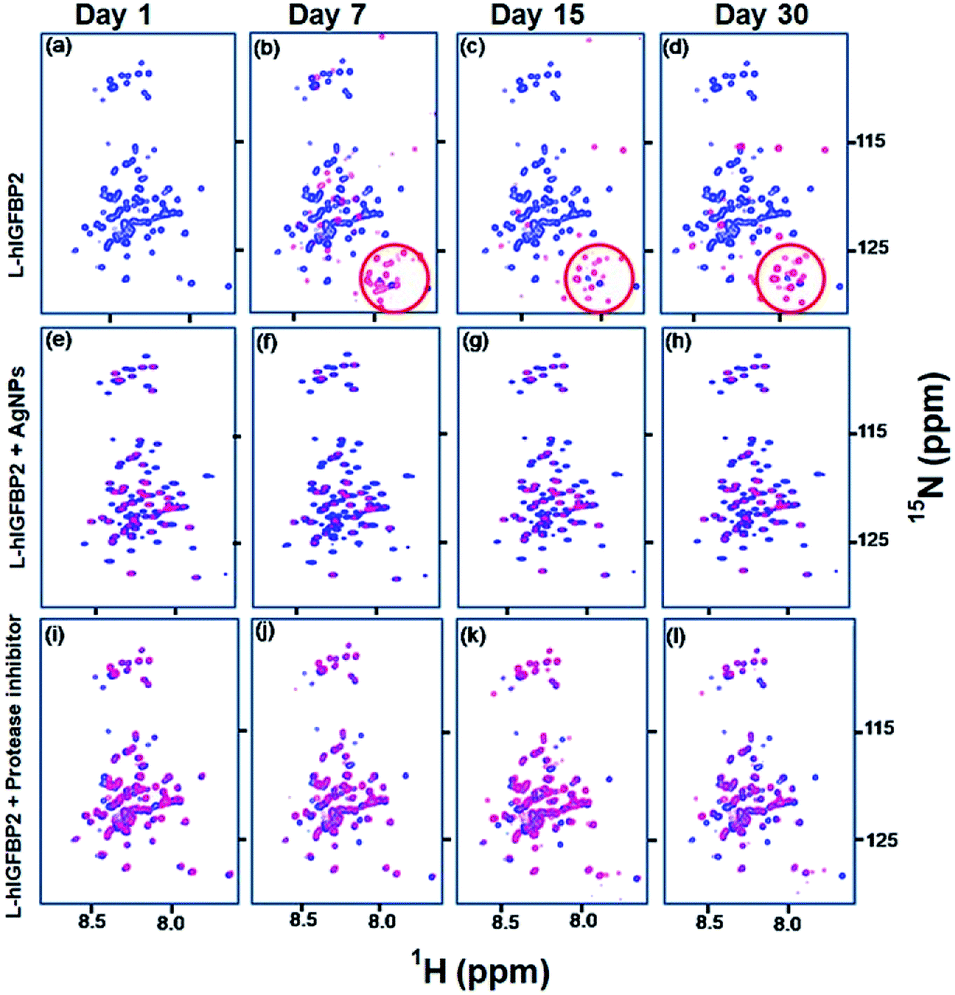 | ||
| Fig. 8 Stability studies of L-hIGFBP2: (a–d) shows the overlay of 2D [15N, 1H] HSQC spectra of free L-hIGFBP2 (blue) with that of the protein sample at different time intervals (red). The encircled part shows the degradation peaks appearing with time; (e–h) overlay of 2D [15N, 1H] HSQC spectra of free L-hIGFBP2 (blue) with that of the protein in presence of 30 nM AgNPs (red) (see also Fig. 4); (i–l) show the overlay of the spectra of free L-hIGFBP2 (blue) with that of the protein in presence of the protease inhibitor cocktail (red) at different intervals of time (indicated on the top). | ||
Assuming the concentration of ∼12 μM of the protein is the maximum concentration that can be loaded completely on 50 nM of the AgNPs present in the sample, it implies that ∼240 molecules of the protein can be loaded onto one silver nanoparticle having an approximate radius of 10 nm.
Stability of the AgNP–LhIGFBP2 conjugate at different concentration of AgNPs
We carried out two experiments to rule out the possibility that the L-IGFBP2 is rendered stable because of the inhibition of proteases by AgNPs. In the first approach, the protein was incubated with different amount of AgNPs and stored for 10 days in separate vials. The hypothesis was that if the proteases interact with AgNPs and inhibit its degradation, the protein should be rendered stable even at very low concentration of AgNPs. This is due to the fact that traces of proteases are present in the sample originating during the purification process and hence their concentration is expected to be low. In Fig. 9, the blue spectra represent the free protein at Day 1 and it is overlaid with spectra at different concentrations of the AgNPs at Day 1 and Day 10 of incubation. Only with higher concentration of AgNPs, (≥16 nM), the protein remains stable. This implies the interaction of the protein with AgNPs is responsible for its stability due to masking of proteases susceptible sites as shown above. The proteases are expected to be in low concentration and hence if nanoparticles indeed interacted with the proteases, protein should have been rendered stable at lower nanoparticle concentrations.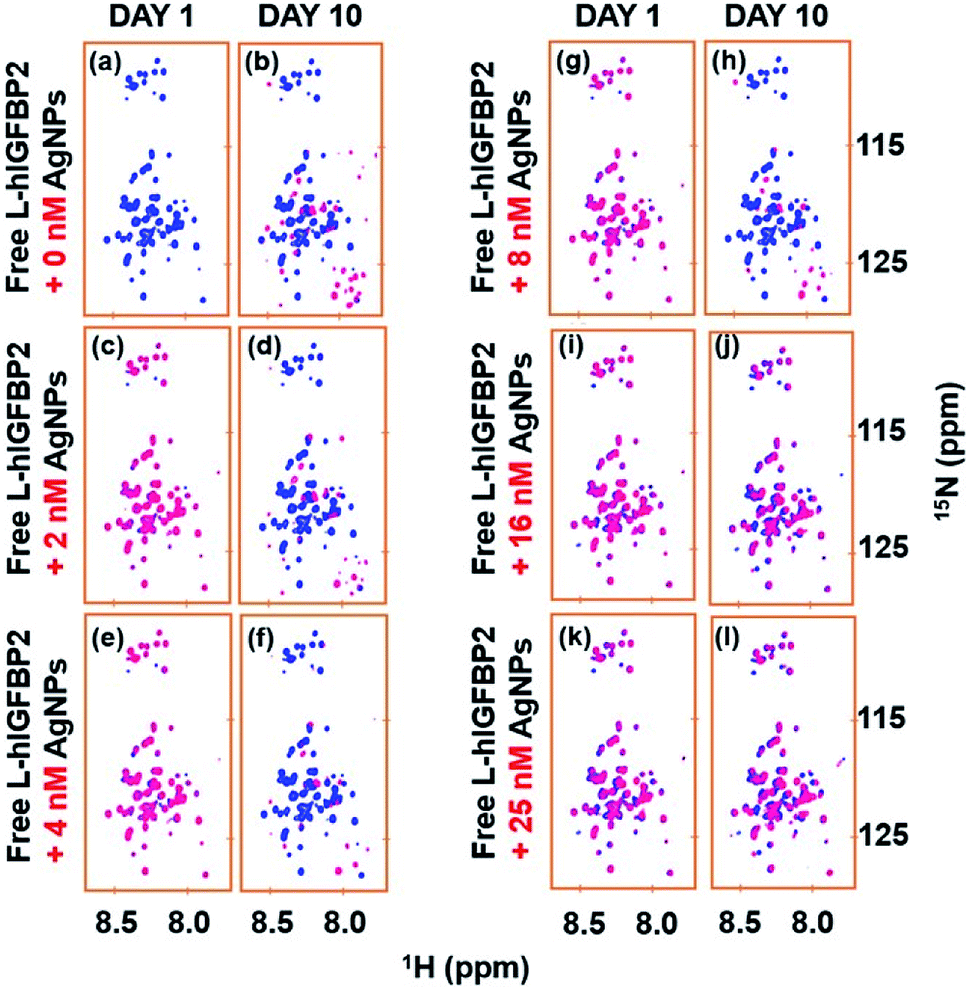 | ||
| Fig. 9 Overlay of 2D [15N, 1H] HSQC spectra of free L-hIGFBP2 (blue) with that of the protein samples at different concentration of AgNPs (red) on Day 1 and Day 10. The different concentrations of AgNP used in (a)–(l) are indicated on the left of each set. | ||
In the second approach, we acquired the 2D [15N, 1H] HSQC spectrum of the AgNP-bound L-hIGFBP2 in presence of externally added 2 μL trypsin and we observed that the trypsin is able to cleave the nanoparticle bound protein (which otherwise remains stable in presence of AgNPs). Since cleavage sites for the trypsin on the L-hIGFBP2 lie outside the interacting sites on the protein that interact with the AgNPs, in presence of trypsin the conjugate is not stabilized. If the trypsin molecules were to interact directly with the nanoparticles, the protein should have been stable in presence of lower amounts of trypsin, which is not the case. The protease–AgNP interaction was further ruled out based on a 1D 1H NMR spectrum of trypsin (6 μM) with AgNPs (30 nM), which showed that there is no appreciable interaction between the two interacting partners (Fig. 10b). As a comparison of the extent of interactions, Fig. 10c gives the overlay of the 1D 1H spectrum of the free and AgNP-bound L-hIGFBP2 and compared it with 1D 1H NMR spectrum of trypsin in absence and in presence of AgNPs (Fig. 10b and c). Thus, the silver nanoparticles interact primarily with L-hIGFBP2, masking its proteolytic sites and thereby resulting in its stabilization.
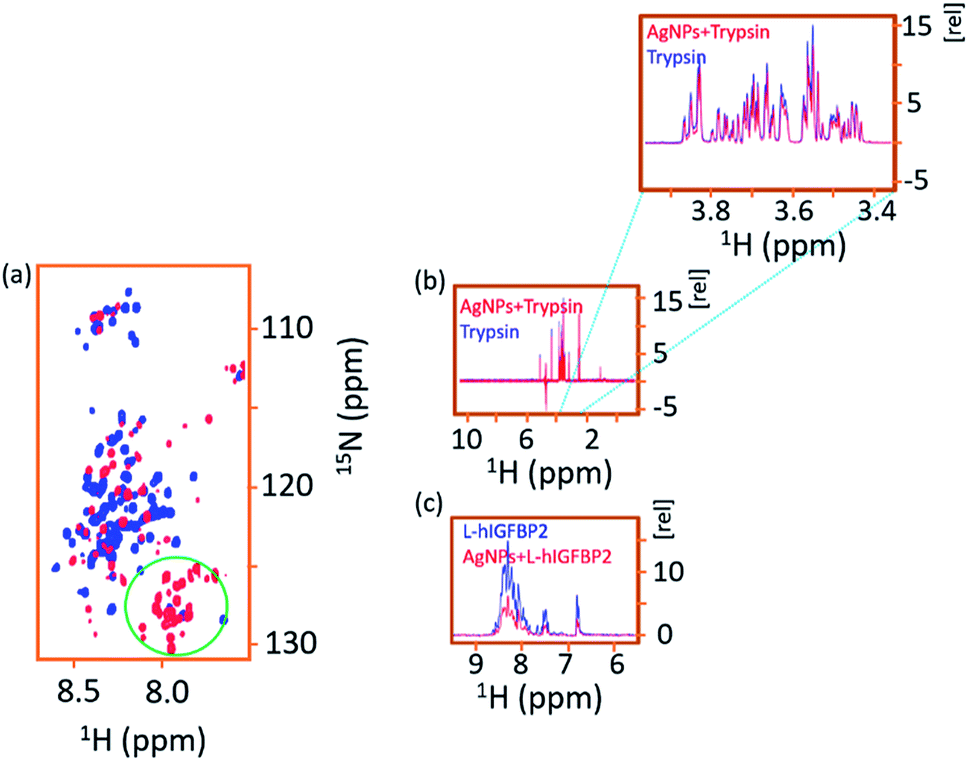 | ||
| Fig. 10 (a) Overlay of 2D [15N, 1H] HSQC spectra of free L-hIGFBP2–AgNP conjugate (blue) with that in presence of trypsin (red). The green circled region shows the appearance of the degradation peaks upon the addition of the trypsin. (b) Overlay of the 1D 1H NMR spectra of free trypsin (blue) with that in presence of AgNPs (red) indicating the protease does not interact with AgNPs. (c) As a comparison to indicate the extent of interaction, the spectrum of L-hIGFBP2 (blue) is shown overlaid with that in presence of AgNPs. Due to the protein–AgNP interactions there is a fall in intensity of the protein spectrum as quantified in Fig. 4. | ||
Stability of the L-hIGFBP2 and its AgNP conjugate at different salt concentrations
IDPs lack a well-defined three-dimensional structure and hence exchange between ensembles of transient conformations has been reported.28 The stability of these ensembles is determined by the changes in the temperature, presence of the proteases, electrostatic interactions with the ligands, buffer conditions, ionic strength, and the type of the ions present in the solution. To demonstrate the effect of the salt (NaCl) concentration on the stability of the L-hIGFBP2 and the AgNP–LhIGFBP2 conjugate under in vitro conditions, we carried out the titration of the L-hIGFBP2 and its AgNP-conjugate with different amounts of salt (shown in the Fig. S3 of the ESI†). We observed that the free IDP is unstable in absence and presence of the salt but the AgNP-conjugate of the IDP remains stable for at least a week in presence of the salt up to a concentration of 150 mM. But as the concentration of the salt increases beyond this, the stability of the AgNP–IDP conjugate falls which could be because of the interaction of the excess of the salt with the silver nanoparticles, causing the degradation of the silver nanoparticles by releasing the soluble Ag+ ions into the solution.29 Further, in the presence of high salt concentration, the electrostatic interaction between the nanoparticles and proteins is screened, rendering the protein unstable in absence of its interaction with nanoparticles.Discussion
The interactions between the metal nanoparticles and the protein molecules lead to the formation of the complex and dynamic protein-corona. The interactions have been attributed to be electrostatic or hydrophobic in nature.30–33 Depending upon the surface charge of the nanoparticles, the protein may undergo a conformational change upon interaction. In the present study we have used solution state NMR spectroscopy and other methods to explore the mechanism and the dynamics of interaction of an IDP with citrate capped silver nanoparticles. We observe that the C-terminal region of L-hIGFBP2, which also bears the proteolytic sites for a wide range of the enzymes, interacts relatively strongly with the nanoparticles. We attribute this enhanced stability of the AgNP–LhIGFBP2 conjugate to the cumulative effects of the electrostatic interactions (between the IDP and the AgNPs) and the masking of the proteolytic prone sites on the IDP by the AgNPs. The protein makes transient contacts with the silver nanoparticle surface and undergoes a reversible association and dissociation from the nanoparticle surface. These interactions are relatively weaker in nature compared to covalent or strong ionic interactions. The interaction of the silver nanoparticles presumably prevents the access of the proteases to the protein and stabilizes it for more than a month.A recent study explored the residue-specific interaction between negatively charged silica nanoparticles and an IDP.13 A detailed amino acid specific analysis using NMR spectroscopy was carried to probe the nature of the interaction. It was found that amino acids of the IDP that have the strongest interaction with the nanoparticles are Arg and Lys, followed by hydrophobic residues such as Ile, Leu and Val. A very similar set of residues were found to interact in our studies.
IDPs in general contain a large number of charged residues.34 The presence of the large uncompensated charges on the IDPs result in their high pI values at physiological conditions. In presence of the nanoparticles, the charged residues engage in the electrostatic interactions with the oppositely charged surface of the nanoparticles. In those IDPs where the proteolysis prone sites are at/near the interacting residues as observed in the current study, the stability of the IDPs may result as a consequence of these electrostatic interactions. Hence this study can be generalized to those IDPs where interactions between the IDPs and the nanoparticles mask the proteolytic sites on the IDP.
Conclusions
This represents the first study that describes the increase in stability of an intrinsically disordered protein against proteolytic cleavage upon interaction with nanoparticles. This interaction involves a dynamic exchange between the free (excess) and AgNP-bound protein molecules and is also reflected in the decrease in T2(1HN) values of the amide protons of the protein upon addition of AgNPs. The faster the dynamic exchange, the weaker would be the strength of interaction and vice versa.9 The exchange rate would depend on the strength and nature of protein–AgNPs interaction, which in turn may depend upon the nature/type of IDP.Conflicts of interest
There are no conflicts to declare.Acknowledgements
The authors would like to acknowledge NMR Research Centre at IISc Bangalore, Department of Science and Technology (DST) and University Gants Commission (UGC), India for the financial support. Molecular Biophysics Unit (MBU) for ITC measurements and Department of Inorganic and Physical Chemistry at IISc Bangalore for helping in carrying out TEM measurements are gratefully acknowledged.Notes and references
- N. Bertrand, P. Grenier, M. Mahmoudi, E. M. Lima, E. A. Appel, F. Dormont, J. M. Lim, R. Karnik, R. Langer and O. C. Farokhzad, Nat. Commun., 2017, 8, 777 CrossRef PubMed.
- O. Vilanova, J. J. Mittag, P. M. Kelly, S. Milani, K. A. Dawson, J. O. Rädler and G. Franzese, ACS Nano, 2016, 10, 10842–10850 CrossRef CAS PubMed.
- T. Cedervall, I. Lynch, S. Lindman, T. Berggard, E. Thulin, H. Nilsson, K. A. Dawson and S. Linse, Proc. Natl. Acad. Sci. U.S.A., 2007, 104, 2050–2055 CrossRef CAS PubMed.
- C. Kinnear, T. L. Moore, L. Rodriguez-Lorenzo, B. Rothen-Rutishauser and A. Petri-Fink, Chem. Rev., 2017, 117, 11476–11521 CrossRef CAS PubMed.
- Y. Qie, H. Yuan, C. A. Von Roemeling, Y. Chen, X. Liu, K. D. Shih, J. A. Knight, H. W. Tun, R. E. Wharen, W. Jiang and B. Y. S. Kim, Sci. Rep., 2016, 6, 1–11 CrossRef PubMed.
- W. Jiang, B. Y. S. Kim, J. T. Rutka and W. C. W. Chan, Nat. Nanotechnol., 2008, 3, 145–150 CrossRef CAS PubMed.
- L. Shang, Y. Wang, J. Jiang and S. Dong, Langmuir, 2007, 23, 2714–2721 CrossRef CAS PubMed.
- E. A. Sykes, Q. Dai, K. M. Tsoi, D. M. Hwang and W. C. W. Chan, Nat. Commun., 2014, 5, 1–8 Search PubMed.
- V. P. Brahmkhatri, K. Chandra, A. Dubey and H. S. Atreya, Nanoscale, 2015, 7, 12921–12931 RSC.
- S. Mondal, R. Thirupathi, L. P. Rao and H. S. Atreya, RSC Adv., 2016, 6, 52539–52548 RSC.
- I. Pal, V. P. Brahmkhatri, S. Bera, D. Bhattacharyya, Y. Quirishi, A. Bhunia and H. S. Atreya, J. Colloid Interface Sci., 2016, 483, 385–393 CrossRef CAS PubMed.
- J. T. Tai, C. S. Lai, H. C. Ho, Y. S. Yeh, H. F. Wang, R. M. Ho and D. H. Tsai, Langmuir, 2014, 30, 12755–12764 CrossRef CAS PubMed.
- M. Xie, A. L. Hansen, J. Yuan and R. Brüschweiler, J. Phys. Chem. C, 2016, 120, 24463–24468 CrossRef CAS PubMed.
- M. J. Suskiewicz, J. L. Sussman, I. Silman and Y. Shaul, Protein Sci., 2011, 20, 1285–1297 CrossRef CAS PubMed.
- P. Tsvetkov, G. Asher, A. Paz, N. Reuven, J. L. Sussman, I. Silman and Y. Shaul, Proteins: Struct., Funct., Bioinf., 2007, 70, 1357–1366 CrossRef.
- B. Bekei, H. M. Rose, M. Herzig, A. Dose, D. Schwarzer and P. Selenko, Methods Mol. Biol., 2012, 895, 43–54 CrossRef CAS.
- S. A. Rosenzweig and H. S. Atreya, Biochem. Pharmacol., 2010, 80, 1115–1124 CrossRef CAS.
- M. Swain, M. G. Slomiany, S. A. Rosenzweig and H. S. Atreya, Arch. Biochem. Biophys., 2010, 501, 195–200 CrossRef CAS PubMed.
- B. E. Forbes, P. McCarthy and R. S. Norton, Front. Endocrinol., 2012, 3, 1–13 Search PubMed.
- W. Lin, T. Insley, M. D. Tuttle, L. Zhu, D. A. Berthold, P. Kra, C. M. Rienstra and C. J. Murphy, J. Phys. Chem. C, 2015, 119, 21035–21043 CrossRef CAS PubMed.
- S. Pregent, A. Lichtenstein, R. Avinery, A. Laser-Azogui, F. Patolsky and R. Beck, Nano Lett., 2015, 15, 3080–3087 CrossRef CAS PubMed.
- F. Theillet, A. Binolfi, B. Bekei, A. Martorana, H. M. Rose and M. Stuiver, Nature, 2016, 530, 45–50 CrossRef CAS PubMed.
- S. Agnihotri, S. Mukherji and S. Mukherji, RSC Adv., 2014, 4, 3974–3983 RSC.
- T. Szyperski, D. C. Yeh, D. K. Sukumaran, H. N. B. Moseley and G. T. Montelione, Proc. Natl. Acad. Sci. U. S. A., 2002, 99, 8009–8014 CrossRef CAS PubMed.
- A. Dubey, S. Mondal, K. Chandra and H. S. Atreya, J. Magn. Reson., 2016, 267, 22–29 CrossRef CAS PubMed.
- J. Iwahara, C. Tang and G. Marius Clore, J. Magn. Reson., 2007, 184, 185–195 CrossRef CAS.
- M. J. Suskiewicz, J. L. Sussman, I. Silman and Y. Shaul, Protein Sci., 2011, 20, 1285–1297 CrossRef CAS PubMed.
- B. I. M. Wicky, S. L. Shammas and J. Clarke, Proc. Natl. Acad. Sci. U.S.A., 2017, 114, 9882–9887 CrossRef CAS PubMed.
- C. Levard, S. Mitra, T. Yang, A. D. Jew, A. R. Badireddy, G. V. Lowry and G. Brown, Environ. Sci. Technol., 2013, 47(11), 5738–5745 CrossRef CAS PubMed.
- A. Sánchez-Iglesias, M. Grzelczak, T. Altantzis, B. Goris, J. Pérez-Juste, S. Bals, G. Van Tendeloo, S. H. Donaldson, B. F. Chmelka, J. N. Israelachvili and L. M. Liz-Marzán, ACS Nano, 2012, 6, 11059–11065 CrossRef.
- A. Wang, Y. R. Perera, M. B. Davidson and N. C. Fitzkee, J. Phys. Chem. C, 2016, 120, 24231–24239 CrossRef CAS PubMed.
- G. Ghosh, L. Panicker and K. C. Barick, Colloids Surf., B, 2014, 118, 1–6 CrossRef CAS.
- S. Dominguez-Medina, J. Blankenburg, J. Olson, C. F. Landes and S. Link, ACS Sustainable Chem. Eng., 2013, 1, 833–842 CrossRef CAS PubMed.
- H. J. Dyson and P. E. Wright, Nat. Rev. Mol. Cell Biol., 2005, 6, 197–208 CrossRef CAS PubMed.
Footnotes |
| † Electronic supplementary information (ESI) available. See DOI: 10.1039/c9ra05514b |
| ‡ Authors contribute equally to this work. |
| This journal is © The Royal Society of Chemistry 2019 |