 Open Access Article
Revealing the role of the 1T phase on the adsorption of organic dyes on MoS2 nanosheets†
Asmaa M. Omara,
Ossama I. Metwallia,
Mohamed R. Saberb,
Gomaa Khabiria,
Mohamed E. M. Alic,
Arafa Hassena,
Mostafa M. H. Khalil d,
Ahmed A. Maarouf*e and
Ahmed S. G. Khalil
 *a
*a
aEnvironmental and Smart Technology Group (ESTG), Physics Department, Faculty of Science, Fayoum University, 63514 Fayoum, Egypt. E-mail: asg05@fayoum.edu.eg
bChemistry Department, Faculty of Science, Fayoum University, 63514 Fayoum, Egypt
cWater Pollution Research Department, National Research Centre, 33 El Bohouth St. P.O. 12622, Giza, Egypt
dChemistry Department, Faculty of Science, Ain Shams University, Abbassia 11566, Cairo, Egypt
eDepartment of Physics, IRMC, Imam Abdulrahman Bin Faisal University, Saudia Arabia. E-mail: amaarouf@iau.edu.sa
First published on 9th September 2019
Abstract
Herein, different phases of MoS2 nanosheets were synthesized, characterized and tested for dye removal from water. The influence of the MoS2 phases as well as the 1T concentration on the adsorption performance of organic dyes MO, RhB and MB was deeply investigated. The results revealed that the 1T-rich MoS2 nanosheets have superior adsorption performance compared to other 2H and 3R phases. The kinetic results of the adsorption process demonstrate that the experimental data followed the pseudo-second order equation. Meanwhile, the adsorption of dyes over the obtained materials was fitted with several isotherm models. The Langmuir model gives the best fitting to the experimental data with maximum a adsorption capacity of 787 mg g−1. The obtained capacity is significantly higher than that of all previous reports for similar MoS2 materials. Computational studies of the 2H and 1T/2H-MoS2 phases showed that the structural defects present at the 1T/2H grain boundaries enhance the binding of hydroxide and carboxyl groups to the MoS2 surface which in turn increase the adsorption properties of the 1T/2H-MoS2 phase.
1. Introduction
Two-dimensional (2D) layered materials have attracted attention for a wide range of applications including hydrogen evolution,1 adsorption,2,3 photocatalysis,4,5 lithium ion batteries,6 and supercapacitors.7–9 Among the different types of 2D materials, molybdenum disulfide (MoS2) has been one of the most studied materials over the last few years.10,11 MoS2 can exist in three phases; two are semiconducting and stable (hexagonal, 2H, and rhombohedral, 3R) and the third (1T) is metallic with a trigonal structure. The 1T phase is metastable and can be transformed into the 2H phase after thermal treatment.12,13 The 1T-MoS2 phase was found to be a superior catalyst due to the high carrier mobility, higher hydrophilicity and abundant active sites, not only at the edges of the nanosheets but also within the basal plane of the 1T phase.14–16 Recent studies have shown that the 1T and 2H phases coexist in single layers of hybridized MoS2 (ref. 17–19) with 1T-phase concentration up to 70%.5,18Treatment of organic pollutants using MoS2 materials via adsorption or photocatalytic degradation has been extensively studied.1–4,6,7,12,20 However, several contradicting reports on this topic can be found due to the very delicate nature of the material.1–4,6–9 The electronic structure of the material and its activity are quite sensitive to several parameters including the molybdenum local coordination, surface defects, crystal phase, degree of exfoliation, and the size and morphology of the nanosheets. For instance, several reports claimed fast and efficient adsorption of different organic dyes using MoS2 composites.1–4,6,21–28 He Li et al.29 used porous MoS2 nanosheets to efficiently remove RhB, MB and MO with adsorption capacities of about 163.0 mg g−1, 499.0 mg g−1 and 125.1 mg g−1 at 420 min, respectively. Also, Xiu and co-workers21 found that the MoS2 exhibits good and fast performance for removal of MB from aqueous solution, with an adsorption capacity of 146.43 mg g−1 in 6 min. However, in another study the authors reported no adsorptive capabilities for their MoS2 samples.20 Xie and co-workers30 reported low adsorption towards MB and MO with adsorption capacity of about 70 and 25 mg g−1 respectively.
The high adsorption capacity reported for some MoS2 nanosheets and MoS2 based heterostructures were ascribed to the high surface area of MoS2 and MoS2-composites, which increases the number of active sites per unit volume and consequently leads to high adsorption capacity.31 However, in other studies,7,32 it has been demonstrated that the surface area has no effect on the adsorption activity. Whereas an effect of intermolecular interaction, such as van der Waals and electrostatic attraction,7 or the existence of highly reactive OH radical groups on the MoS2 surface33 was proposed. To the best of our knowledge, there are no reports that provide a clear correlation between the high adsorption performance of MoS2 with the material surface activity and its phase composition.
Computational studies of the adsorption properties of two-dimensional materials have been extensively performed, so as to understand the role of various parameters controlling molecular adsorption on their surfaces. Graphene, being a 2D material with relative ease of fabrication was extensively studied.34–36 The surface structure, defects, and functionalization play an important role. In addition, various properties of the adsorbents (such as geometrical configuration, hydrophobicity, size, and substituent chemical groups) were investigated.37,38
With the progress in fabricating 2D MoS2 nanosheets, molecular adsorption on its surface have been recently computationally investigated, where defects arising from Mo or S vacancies can lead to an enhancement of its adsorption and catalytic properties.39,40 Edges of MoS2 nanoparticles, where the atomic coordination of the Mo and S atoms is different from the bulk, provide active sites that can anchor various functional groups, adsorb various gases, and catalyse hydrogen evolution reactions.33,41,42 Mixed phase 1T/2H structures have been experimentally and computationally studied for various applications, including solar thermal water purification.43 The 1T/2H in plane phase hybridization offers a MoS2 structure with lower sheet resistance (<1 kΩ sq−1) and high specific capacitance two orders of magnitude higher than the pure 2H phase.44 Electronic studies of hybridized phases revealed that the presence of 1T islands in a 2H MoS2 sheet induces some structural defects at the grain boundaries of the 1T phase, where the S and Mo sublattices suffer some local stresses. These manifests themselves as changes in the 2H electronic spectrum, leading to the emergence of midgap states, and causing an increase in the electronic conductivity of the hybrid phase compared to the pure 2H one. In addition, the structural defects at the 1T boundary alter the electrostatic landscape of the system, inviting an investigation of molecular adsorption in these regions.
In our recent work,5 hybridized phases of MoS2 were synthesized using hydrothermal method with the reactor filling ratio acting as the controlling factor of the 1T content of the material. The results of the photocatalytic degradation of MO using these materials under visible light strongly correlated the photocatalytic activity of MoS2 materials to their phases with a significantly improved performance of 1T containing phases. Our calculations suggested that the introduction of 1T sites into the 2H layers of the material lead to surface distortions and mid-gap states which improve the conductivity and catalytic activity.
In this report, the adsorptive properties of the mixed phase MoS2 nanosheets (1T/2H, 2H and 3R) have been explored. The adsorption behaviour of the samples has been thoroughly investigated using MB, RhB and MO organic dyes in order to determine the effect of the sample phase on the adsorption performance. The conditions of adsorption process have been optimized in order to conduct detailed kinetics and thermodynamics studies. We also present first principle calculations of the adsorption properties of the different phases of MoS2 nanosheets, where we study the effects of the 1T/2H domain boundaries.
2. Experimental
2.1 Chemicals
Methylene blue (MB); (C16H18ClN3S), methyl orange; (MO) (C14H14N3NaO3S) and rhodamine B (RhB); (C28H31ClN2O3) were purchased from Sigma Aldrich. Ammonium molybdate ((NH4)6Mo7O24·4H2O) was purchased from SD Fine Chem limited, India. Thiourea (CH4N2S) was purchased from Loba Chemie, India. All chemicals were of analytical grade and used without further purification. The different concentrations of MB, MO, and RhB solutions were prepared by dissolving the required amount of these dyes in deionized water.2.2 Synthesis of MoS2
Four different samples (S1–S4) of MoS2 nanosheets were prepared using the hydrothermal method. For S1, 2.47 g of (NH4)6Mo7O24·4H2O and 0.76 g of CS (NH2)2 were dissolved in 60 mL of DI water under constant stirring. The whole mixture was transferred into a 134 mL Teflon-lined stainless-steel autoclave. The autoclave was kept in an oven at 200 °C for 24 h, then left to cool down to room temperature. The resulting black precipitate was collected by centrifugation, washed three times with distilled water then with ethanol, and dried in an oven for 12 h at 80 °C. To obtain the different phases, a variation of the reactor filling ratio (75%, S2) and molar ratio of Mo and S 1![[thin space (1/6-em)]](https://www.rsc.org/images/entities/char_2009.gif) :
:![[thin space (1/6-em)]](https://www.rsc.org/images/entities/char_2009.gif) 25, 75% (S3) were used. Further thermal treatment of 1T/3R-MoS2 in a tube furnace (Carbolite) at 800 °C under Ar for 2 hours resulted in 2H-MoS2 (S4). The ratios between IT and 2H/3R phases in the samples were estimated from XPS analyses.5
25, 75% (S3) were used. Further thermal treatment of 1T/3R-MoS2 in a tube furnace (Carbolite) at 800 °C under Ar for 2 hours resulted in 2H-MoS2 (S4). The ratios between IT and 2H/3R phases in the samples were estimated from XPS analyses.5
2.3 Materials characterization
The morphologies of the prepared samples were measured using scanning electron microscope (Zeiss Sigma 500 VP, equipped with Oxford EDS detector). HRTEM images were obtained using JOEL 2100F at 200 kV. X-ray diffraction patterns were collected using Cu Kα monochromatic radiation (K1/4 1.54056) at room temperature on a 202964 Panalytical Empryan diffractometer. Brunauer–Emmet–Teller (BET) surface area was analysed using a TriStar instrument with nitrogen adsorption at 77 K using the Barrett–Joyner–Halenda (BJH) method. The zeta potential and size at different pH was performed using Nano-ZS (Malvern, UK).2.4 Adsorption experiments
The adsorption experiments were performed in the dark at room temperature in order to eliminate any possible photocatalytic degradation of the used dyes. The adsorption behaviour of the prepared samples was investigated by monitoring the reduction of MB, RhB and MO dyes in aqueous solutions (20 mg L−1). A calculated amount of the MoS2 samples was separately added to the above solutions with continuous magnetic stirring at 800 rpm. During the experiments, 3 mL of the supernatant was taken at different time intervals and analysed by UV-vis spectrophotometer (Agilent, Cary 60) at λmax = 664, 554 and 464 nm for MB, RhB and MO respectively, to determine the dye concentration. The sorbent was isolated via centrifugation. The adsorption percentage of dyes and adsorption capacity of MoS2 was calculated using the following equations:
 | (1) |
| qt (mg g−1) = (C0 − Ct)Vd/mA | (2) |
2.5 Computational methods
All calculations were performed using the Quantum Espresso plane waves package based on density functional theory.45 The generalized gradient approximation was used in the scheme of Perdew–Burke–Ernzerhof for the exchange correlation functional, with ultrasoft pseudopotentials. A 6 × 6 2H supercell was constructed, with a vacuum separation of 13 Å, to prevent the interaction between neighboring cells. All studied systems were structurally relaxed, until all atomic forces become less than 0.0001 Ry bohr−1. The self-consistent calculations were performed with an energy cut-off of 35 Ry, and with a 2 × 2 × 1 Monkhorst–Pack k-mesh.46 The adsorption energies, Ead, were calculated according to:| Ead = E(MoS2) + E(X) − E(MoS2 + X) | (3) |
3. Results and discussion
MoS2 flower-like structures with different 1T concentration were synthesized by hydrothermal reaction between ammonium molybdate and thiourea at 200 °C. The resulting phase is controlled through three factors: the molar ratio of Mo![[thin space (1/6-em)]](https://www.rsc.org/images/entities/char_2009.gif) :
:![[thin space (1/6-em)]](https://www.rsc.org/images/entities/char_2009.gif) S, the filling ratio of the reactor, and thermal treatment. Adjusting the ratio of Mo
S, the filling ratio of the reactor, and thermal treatment. Adjusting the ratio of Mo![[thin space (1/6-em)]](https://www.rsc.org/images/entities/char_2009.gif) :
:![[thin space (1/6-em)]](https://www.rsc.org/images/entities/char_2009.gif) S to 1
S to 1![[thin space (1/6-em)]](https://www.rsc.org/images/entities/char_2009.gif) :
:![[thin space (1/6-em)]](https://www.rsc.org/images/entities/char_2009.gif) 5 at 45% filling ratio of the reactor gives the hybridized S1, while the same molar ratio at 75% filling ratio gives S2. By increasing the filling of the reactor to 75% and using excess of sulphur with a Mo
5 at 45% filling ratio of the reactor gives the hybridized S1, while the same molar ratio at 75% filling ratio gives S2. By increasing the filling of the reactor to 75% and using excess of sulphur with a Mo![[thin space (1/6-em)]](https://www.rsc.org/images/entities/char_2009.gif) :
:![[thin space (1/6-em)]](https://www.rsc.org/images/entities/char_2009.gif) S ratio of 1
S ratio of 1![[thin space (1/6-em)]](https://www.rsc.org/images/entities/char_2009.gif) :
:![[thin space (1/6-em)]](https://www.rsc.org/images/entities/char_2009.gif) 25 we obtained S3. The thermal treatment of S3 at 800 °C under argon in a tube furnace gave pure 2H phase (S4). The obtained samples have been characterized using several analytical techniques.5
25 we obtained S3. The thermal treatment of S3 at 800 °C under argon in a tube furnace gave pure 2H phase (S4). The obtained samples have been characterized using several analytical techniques.5
Fig. SI.1† shows the XRD patterns of the synthesized MoS2 samples. All the diffraction peaks of the prepared samples appeared noisy and broad, mainly due to the formation of nanosized MoS2 material.47 S4 exhibits five diffraction peaks at 13.7°, 33.2°, 39.3°, 49.2°, and 58.6°, defined by the (002), (100), (103), (105), and (110) crystal planes, respectively. These results are in a good agreement with hexagonal 2H-MoS2 pattern (PDF no. 00-024-0513). Whereas the diffraction patterns of S1–S3 indicate the existence of a hybridized 1T/2H and 1T/3R phases.48 SEM measurements of the MoS2 materials (Fig. 1A) showed micro-flowers consisting of aggregated MoS2 nanosheets for all samples which is typically reported for similar hydrothermally synthesized MoS2 materials.49 The EDS mapping (Fig. 1B–D) revealed the existence of Mo, S, and O in the layered MoS2 with uniform distribution, confirming the high quality of the prepared MoS2.
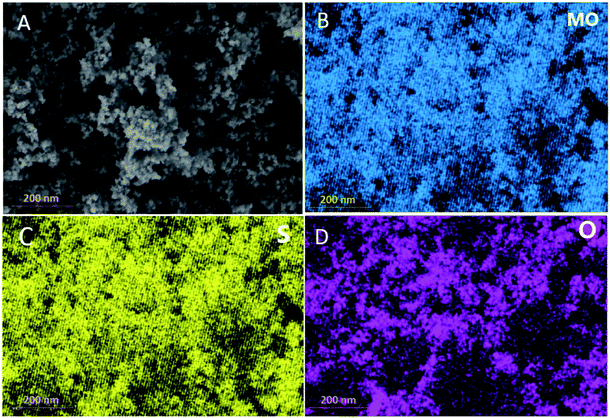 | ||
| Fig. 1 (A) SEM image of the micro-flowers MoS2 nanosheets, (B–D) EDS elemental mapping of the MoS2 nanosheets. | ||
Fig. 2A shows the nitrogen adsorption–desorption isotherms curve of S1. The specific surface area of the MoS2 nanosheets, calculated by the multipoint BET method, was 6.18 m2 g−1. The specific area of the S3 and S4 was found to be 6.67 and 4.48 m2 g−1, respectively (Fig. SI.2†). No significant differences in the specific areas of the three samples were observed, which suggests that different adsorption responses of the samples cannot be attributed to the surface area of the MoS2 nanosheets. The adsorption of dyes onto the MoS2 adsorbent surface is strongly affected by the surface charge of the adsorbent. In addition, the adsorbent surface charge is significantly influenced by pH value. The zeta potential measurements of S1, S2 and S4 (Fig. 2B) reveal high negative surface charges in the range of pH = 3–10, which reflects the excellent stability of the MoS2 dispersions.
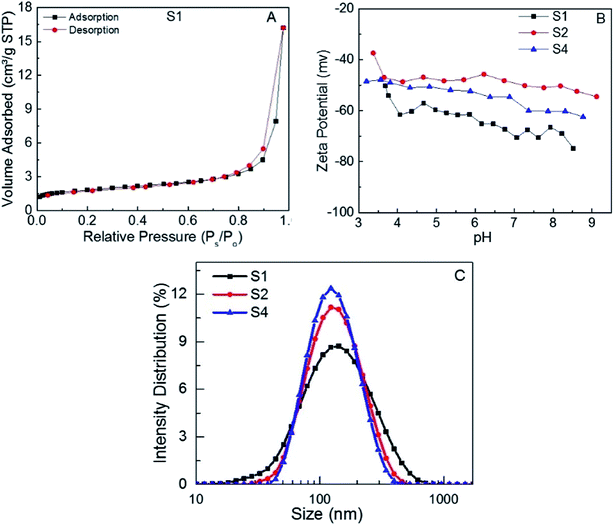 | ||
| Fig. 2 (A) Nitrogen adsorption–desorption isotherms, (B) zeta potential of S1 at different pH values, (C) particle size distribution of S1, S2 and S4 aqueous dispersions. | ||
This negative surface charges are mainly due to OH and COOH functional groups on MoS2 surface50 which act as surface active adsorption sites.51 The negative charge density on the surface of MoS2 nanosheets suggests that the interaction with adsorbates should be mainly electrostatic in nature with a possible affinity towards cationic dyes.52,53 Similar charge profiles at different pH were observed for S2 and S4. Fig. 2C shows the particle size of S1, S2 and S4 aqueous dispersions. It can be seen that the MoS2 nanosheets of S1, S2 and S4 have small sizes (131 nm, 127 nm and 123 nm respectively) compared to previous reports.54 Very likely this is due to the better degree of exfoliation of MoS2 nanosheets.
3.1 Adsorption performance
In order to investigate the adsorption behaviour of the four prepared MoS2 samples with different phases, a certain dose of the samples (50 mg) was added to MB aqueous solution (100 mL, 20 ppm). The experiments were performed under dark conditions for 30 min. Fig. SI.3† shows a removal efficiency of 99% and adsorption capacity 40 mg g−1 for S1 (70% 1T) compared to 87%, 34 mg g−1 for S2 (20% 1T), 22%, 9 mg g−1 for S3 (1T/3R) and 11%, 5 mg g−1 for S4 (2H) after 5 min. These results clearly indicate an improved performance of the 1T rich samples over 2H and 3R samples.We investigated the adsorption selectivity of S1 towards different cationic (MB, RhB) and anionic (MO) dyes. The adsorption experiment was carried out for 120 min using 100 ppm dye solutions. The results show a much higher removal percent (adsorption capacity) of cationic dyes; MB, 99% (201 mg g−1), and RhB, 77% (160 mg g−1) as compared to anionic (MO), 23% (50 mg g−1) (Fig. SI.4A and B†). These results are in good agreement with the negative surface charge indicated by the zeta potential measurements (Fig. 2C). They are also in good agreement with the previous reports that indicated a greater affinity of MoS2 sorbents towards cationic dyes.24,25,48,55,56
To evaluate the adsorption capacity of as-prepared S1 towards MB and RhB, a 50 mg dose was added to aqueous solution of different concentrations (20 ppm, 50 ppm and 100 ppm) (Fig. 3). Complete removal was obtained after 120 min with an improved capacity for MB than RhB, which could be attributed to its smaller molecular size.
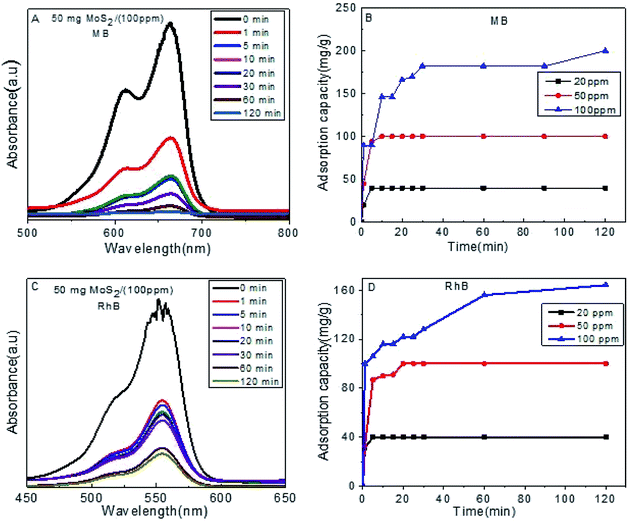 | ||
| Fig. 3 (A) Absorption efficiency of MB on S1, (B) adsorption capacity for MB, (C) absorption efficiency of RhB on S1, (D) adsorption capacity for RhB. | ||
In order to determine the optimum conditions to conduct further adsorption studies, the S1 dosage was varied from 50 mg to 20 mg. Fig. 4A and B show the percent adsorption and adsorption capacity of the S1 for MB (100 ppm) at varying adsorption times. As the MoS2 dosage decreased from 50 to 20 mg, the adsorption capacities increased from 200 mg g−1 to 330 mg g−1. When the dye concentration was further increased up to 400 mg L−1, adsorption capacity of 652 mg g−1 was achieved (Fig. 4C).
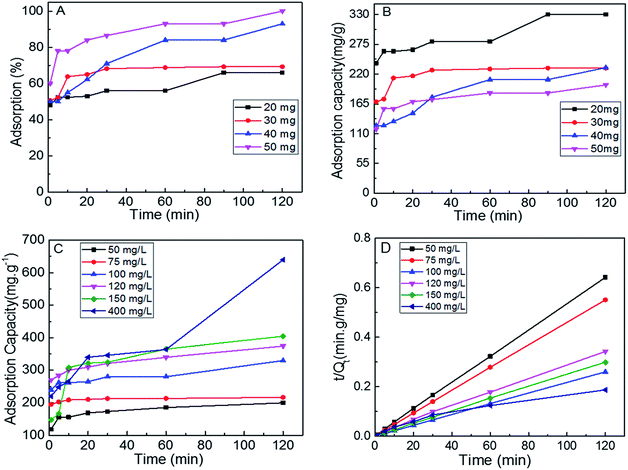 | ||
| Fig. 4 (A and B) adsorption performance of different doses of S1 for MB aqueous solution, adsorption capacity (C) and pseudo second order model fits (D) of S1 at different dye concentrations. | ||
The kinetics of the adsorption process was investigated by fitting the data to different kinetic models including pseudo first and second order models. Such models provide detailed information on the adsorption mechanism and the type of adsorption processes involved, including diffusion control, chemical reaction, and mass transport processes.
The kinetics studies for MB onto S1 was investigated using pseudo-first order and pseudo-second order, which can be expressed as:57
ln(qe − qt) = ln![[thin space (1/6-em)]](https://www.rsc.org/images/entities/char_2009.gif) qe − K1t qe − K1t
| (4) |
 | (5) |
| Models | Parameter | Value |
|---|---|---|
| Pseudo second order model, Langmuir: Ce/qe = 1/KLQ0 + Ce/Q0 | K2 (g mg−1 min−1) | 9 × 10⁻⁴ |
| qe (mg g−1) | 636 | |
| R2 | 0.966 | |
| Q0 (mg g−1) | 787 | |
| KL (L mg−1) | 0.0179 | |
| RL | 0.1223–0.527 | |
| R2 | 0.9899 | |
Freundlich: ln![[thin space (1/6-em)]](https://www.rsc.org/images/entities/char_2009.gif) qe = ln qe = ln![[thin space (1/6-em)]](https://www.rsc.org/images/entities/char_2009.gif) KF + (1/n) ln KF + (1/n) ln![[thin space (1/6-em)]](https://www.rsc.org/images/entities/char_2009.gif) Ce Ce |
1/n | 0.4129 |
| KF (L mg−1) | 67.424 | |
| R2 | 0.9954 | |
Temkin: qe = Bl![[thin space (1/6-em)]](https://www.rsc.org/images/entities/char_2009.gif) ln ln![[thin space (1/6-em)]](https://www.rsc.org/images/entities/char_2009.gif) KT + Bl KT + Bl![[thin space (1/6-em)]](https://www.rsc.org/images/entities/char_2009.gif) ln ln![[thin space (1/6-em)]](https://www.rsc.org/images/entities/char_2009.gif) Ce Ce |
B1 | 154.84 |
| KT | 0.2235 | |
| R2 | 0.9795 | |
Dubinin and Radushkevich: ln![[thin space (1/6-em)]](https://www.rsc.org/images/entities/char_2009.gif) qe = ln qe = ln![[thin space (1/6-em)]](https://www.rsc.org/images/entities/char_2009.gif) Qs − Bε2 Qs − Bε2 |
Qs (mg g−1) | 470.69 |
| K | 3 × 10⁻⁵ | |
| R2 | 0.77 |
3.2 Isotherms
In order to obtain a deeper insight on the nature of the adsorption layer and the distribution of the active sites on the sorbent surface, the adsorption data were fit to the following isotherms:Langmuir isotherm which is expressed as:59
 | (6) |
 | (7) |
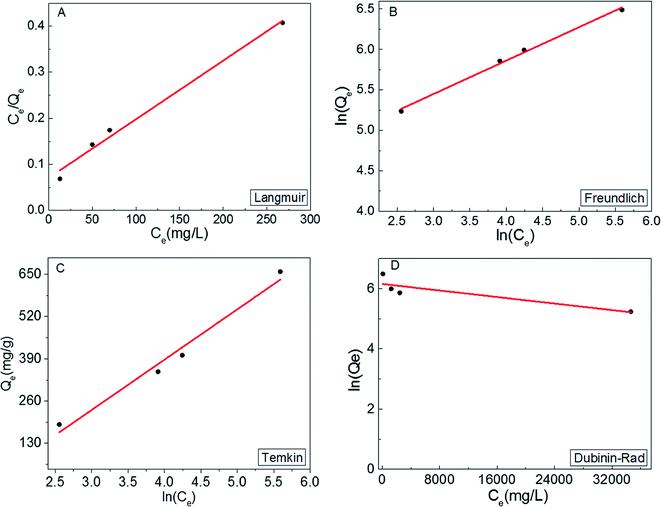 | ||
| Fig. 5 Langmuir (A), Freundlich (B), (C) Temkin and (D) Dubinin–Rad isotherm curves fitting for MB adsorption onto S1. | ||
Freundlich isotherm model30 was used to evaluate the heterogeneity of the sorbent surface and can be expressed as follow:
 | (8) |
Temkin isotherm model can be expressed as follows:
qe = B1![[thin space (1/6-em)]](https://www.rsc.org/images/entities/char_2009.gif) ln ln![[thin space (1/6-em)]](https://www.rsc.org/images/entities/char_2009.gif) KT + BT KT + BT![[thin space (1/6-em)]](https://www.rsc.org/images/entities/char_2009.gif) ln ln![[thin space (1/6-em)]](https://www.rsc.org/images/entities/char_2009.gif) Ce Ce
| (9) |
 | (10) |
For Dubinin–Radushkevich isotherm model:59
ln![[thin space (1/6-em)]](https://www.rsc.org/images/entities/char_2009.gif) qe = ln qe = ln![[thin space (1/6-em)]](https://www.rsc.org/images/entities/char_2009.gif) Qs − Kε2 Qs − Kε2
| (11) |
 | (12) |
It can be concluded from the above results that the high correlation coefficient to Langmuir, Freundlich and Temkin isotherms suggest that several sorption mechanisms are involved.58 Moreover, the obtained results revelled that the surface of MoS2 exhibits a blend of heterogenous and homogenous active sites, and the overall rate of adsorption of MB on MoS2 surface was achieved by the two isotherm mechanisms.
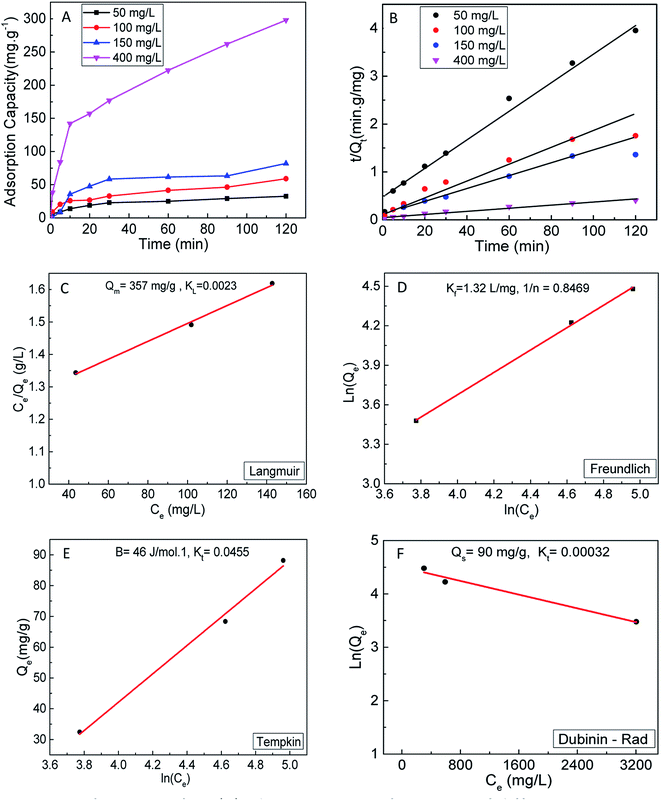
To further investigate the role of surface-active sites in the adsorption process, the adsorption kinetics and isotherms of S2 were also investigated. The adsorption kinetics are shown in Fig. 6A and B, which indicates that the experimental data are fit with the pseudo-second-order model. The adsorption data were fit to the same isotherm models (Fig. 6C–F). The results clearly show a lower adsorption capacity (357 mg g−1) as compared to S1. This observation can be correlated to the less active surface in S2 due to the smaller content of 1T phase (∼20%).
Table 2 lists most of recent reports done on the dye adsorption using MoS2. It can be noticed that our materials have shown the highest adsorption capacity for MB. In addition, in all these studies the control over the materials phase was missing and/or unknown.
| Materials | Phase | Adsorption capacity (mg g−1) | Dye | Ref. |
|---|---|---|---|---|
| MoS2 | Hexagonal | 146.43 | MB | 21 |
| MoS2 | No specified, but based on XRD shown it is hexagonal | 297 | MB | 23 |
| MoS2 | Hexagonal | 499 | MB | 29 |
| MoS2 | Hexagonal | 208 | MB | 50 |
| 291 | RhB | |||
| MoS2–TiO2 | Hexagonal | 364.56 | MB | 60 |
| MoS2 | Hexagonal | 343.74 | MB | 61 |
| g-MoS2-decorated biochar | Hexagonal | 249.45 | Tetracycline hydrochloride (TC) | 62 |
| Ni/MoS2 | Cubic | 277.77 | Congo red (CR) | 22 |
| MoS2 | Hexagonal | 161.29 | Crystal violet dye (CV) | 63 |
| MoS2 | Hexagonal | 49.2 | RhB | 7 |
| MoS2 | S1 70% 1T-MoS2 | 787 | MB | Our work |
| S2 20% 1T-MoS2 | 357 |
3.3 Computational studies
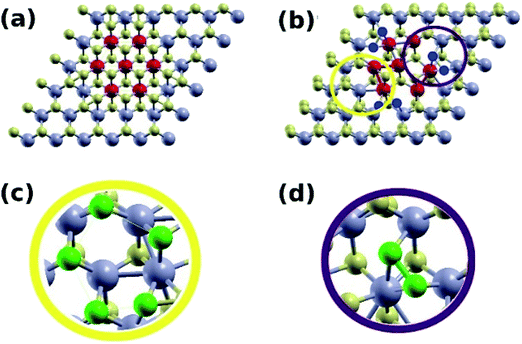
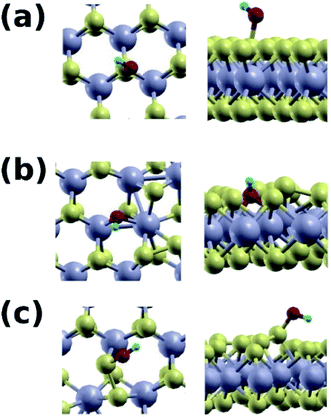
In this part, computational studies of the adsorption properties of the hybrid MoS2 structure was carried out with the aim to deeply understand the role of 1T active sites as well as to correlate the results with the experimental findings. Defects, edges, and other structural alterations in the MoS2 lattice lead to active sites that can be utilized for various applications. Adsorption of dyes on MoS2 nanosheets is mediated by the hydroxide and carboxyl groups bound to the MoS2 surface.21,50 It is therefore desirable to explore whether the mixed phase enhances the binding of these groups to its surface. Two MoS2 systems were constructed, a pure 2H phase (S4), and a mixed 1T/2H phase (S1). The Mo atoms of the 1T region were marked in red (Fig. 7). Upon structural relaxation, the grain boundary found to have regions where displaced S atoms leave some Mo atoms more exposed to adsorbents compared to corresponding atoms in the pure 2H phase (Fig. 7b and c, yellow circle). Furthermore, there were sites with bonded S atoms (Fig. 7b and d, purple circle). Such structural defects present at the 1T/2H grain boundary were the focus of our computational investigation.Fig. 8 shows the hydroxide group adsorbed on the pure 2H phase of MoS2 (Fig. 8a), and the mixed 1T/2H phase (Fig. 8b and c). We find that the group adsorbs to the S site of the pure 2H phase with a binding energy of 1.26 eV, with an O–S distance of 1.79 Å. On the contrary, the hydroxide group adsorbs to mixed phase at the Mo site with a significantly higher energy of 2.95 eV, and an O–Mo distance of 2.09 Å, and on the S–S bonded site with an energy of 2.67 eV, and an O–S distance of 1.67 Å.
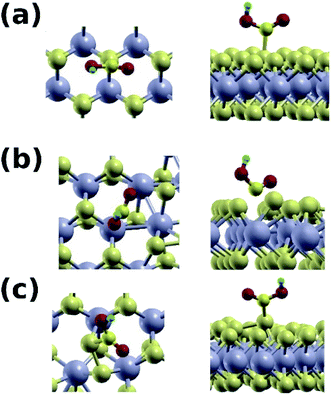
The mixed phase is also superior to the pure one in adsorbing the carboxyl group (Fig. 9), with binding energy of 1.60 eV at the S–S site, and a C–S distance of 1.89 Å. On the contrary, the binding energy with the pure 2H phase is only 0.2 eV. Binding at the Mo site of the mixed phase is weak in this case because of the electrostatic size of the carboxyl group. Our results are summarized in Table 3.
| OH | Eb (eV) | O–S (Å) | O–Mo (Å) |
|---|---|---|---|
| 2H | 1.26 | 1.79 | — |
| 1T/2H_S | 2.66 | 1.67 | — |
| 1T/2H_Mo | 2.95 | — | 2.09 |
| COOH | Eb (eV) | C–S (Å) | C–Mo (Å) |
|---|---|---|---|
| 2H | 0.20 | 1.87 | — |
| 1T/2H_S | 1.60 | 1.89 | — |
| 1T/2H_Mo | 0.08 | — | 2.68 |
Although we have not taken van de Waals (vdW) interactions into consideration, their effect will not significantly change our findings. vdW corrections are expected to enhance the adsorption of hydroxide and carboxyl groups on the MoS2 surface, typically by ∼0.5 eV, which will preserve the superiority of the 1T boundary regions for adsorbing the functional groups.
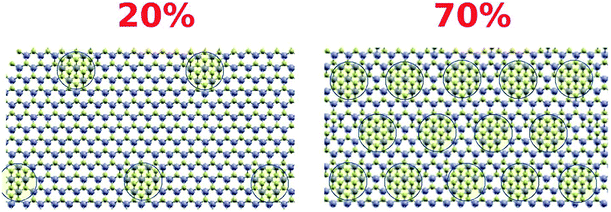
The density of the structural defects at the 1T grain boundaries is proportional to the perimeter of the 1T region (Fig. 10). Therefore, and assuming a fixed typical 1T size, increasing the 1T concentration will be accompanied by an increase in the adsorption capacity of the mixed phase; an increase that varies as the square root of the concentration. This is in great agreement with the maximum adsorption capacities obtained for S1 and S2. As such, an estimate of the ratio between the adsorption capacities of the 20% and 70% samples is:
4. Conclusions
Hybrid phases of MoS2 nanosheets were prepared via hydrothermal method at different conditions. The adsorption performance for the MO, MB and RhB were investigated. The results indicated that the dependence of adsorption performance on 1T phase level in MoS2 nanosheets. The superior adsorption selectivity for MB and RhB dyes over MoS2 nanosheets is worthy noted rather than MO dye. Kinetic studies revealed that adsorption capacity of MB and RhB showed a well-fitting with the second order model with high correlation coefficient R2. The adsorption data were fit to different isotherm models, in which the Langmuir model provided the well fit to the experimental data with maximum adsorption capacity of 787 mg g−1 for MB. Density functional theory calculations indicate a significantly improved adsorption performance of the 1T/2H-MoS2 mixed phase, where the defects occurring at the 1T/2H grain boundaries bind the chemical groups mediating the dye adsorption more strongly.Conflicts of interest
There are no conflicts to declare.Acknowledgements
This work was partially supported by grants funded by Science, Technology and Development Fund (STDF, Egypt) and the Arab-German Young Academy of Sciences and Humanities (AGYA), Germany. A. Maarouf would like to acknowledge the use of the resources of the Supercomputing Laboratory at KAUST, Saudi Arabia.References
- J. Wang, S. Han, W. Zhang, D. Liang, Y. Li, X. Zhao and R. Wang, Int. J. Hydrogen Energy, 2013, 38, 14631–14637 CrossRef CAS.
- X. Mi, G. Huang, W. Xie, W. Wang, Y. Liu and J. Gao, Carbon, 2012, 50, 4856–4864 CrossRef CAS.
- N. A. Travlou, G. Z. Kyzas, N. K. Lazaridis and E. A. Deliyanni, Langmuir, 2013, 29, 1657–1668 CrossRef CAS PubMed.
- Y. Yu, J. Wan, Z. Yang and Z. Hu, J. Colloid Interface Sci., 2017, 502, 100–111 CrossRef CAS PubMed.
- M. R. Saber, G. Khabiri, A. A. Maarouf, M. Ulbricht and A. S. Khalil, RSC Adv., 2018, 8, 26364–26370 RSC.
- R. Yang, J. Wang, W. Liu, Y. Zhang, H. Wang, S. Liu, Y. Guo and S. Chen, ChemistrySelect, 2017, 2, 8643–8649 CrossRef CAS.
- X. Wang, J. Ding, S. Yao, X. Wu, Q. Feng, Z. Wang and B. Geng, J. Mater. Chem. A, 2014, 2, 15958–15963 RSC.
- B. A. Ali, O. I. Metwalli, A. S. Khalil and N. K. Allam, ACS Omega, 2018, 3, 16301–16308 CrossRef CAS PubMed.
- B. A. Ali, A. M. Omar, A. S. G. Khalil and N. K. Allam, ACS Appl. Mater. Interfaces, 2019 DOI:10.1021/acsami.9b11444.
- Z. Zhang, P. Yang, M. Hong, S. Jiang, G. Zhao, J. Shi, Q. Xie and Y. Zhang, Nanotechnology, 2019, 30, 182002 CrossRef CAS PubMed.
- U. Krishnan, M. Kaur, K. Singh, M. Kumar and A. Kumar, Superlattices Microstruct., 2019, 128, 274 CrossRef CAS.
- Y. Yu, G.-H. Nam, Q. He, X.-J. Wu, K. Zhang, Z. Yang, J. Chen, Q. Ma, M. Zhao, Z. Liu, F.-R. Ran, X. Wang, H. Li, X. Huang, B. Li, Q. Xiong, Q. Zhang, Z. Liu, L. Gu, Y. Du, W. Huang and H. Zhang, Nat. Chem., 2018, 10, 638–643 CrossRef CAS PubMed.
- A. L. Friedman, A. T. Hanbicki, F. K. Perkins, G. G. Jernigan, J. C. Culbertson and P. M. Campbell, Sci. Rep., 2017, 7, 3836 CrossRef PubMed.
- D. Voiry, H. Yamaguchi, J. Li, R. Silva, D. C. Alves, T. Fujita, M. Chen, T. Asefa, V. B. Shenoy and G. Eda, Nat. Mater., 2013, 12, 850 CrossRef CAS PubMed.
- M. Li, D. Wang, J. Li, Z. Pan, H. Ma, Y. Jiang and Z. Tian, RSC Adv., 2016, 6, 71534–71542 RSC.
- R. Abinaya, J. Archana, S. Harish, M. Navaneethan, S. Ponnusamy, C. Muthamizhchelvan, M. Shimomura and Y. Hayakawa, RSC Adv., 2018, 8, 26664–26675 RSC.
- M. A. Lukowski, A. S. Daniel, F. Meng, A. Forticaux, L. Li and S. Jin, J. Am. Chem. Soc., 2013, 135, 10274–10277 CrossRef CAS PubMed.
- M. Acerce, D. Voiry and M. Chhowalla, Nat. Nanotechnol., 2015, 10, 313 CrossRef CAS PubMed.
- S. Bai, L. Wang, X. Chen, J. Du and Y. Xiong, Nano Res., 2015, 8, 175–183 CrossRef CAS.
- K. Chang, X. Hai, H. Pang, H. Zhang, L. Shi, G. Liu, H. Liu, G. Zhao, M. Li and J. Ye, Adv. Mater., 2016, 28, 10033–10041 CrossRef CAS PubMed.
- X.-Q. Qiao, F.-C. Hu, F.-Y. Tian, D.-F. Hou and D.-S. Li, RSC Adv., 2016, 6, 11631–11636 RSC.
- H. Song, S. You and X. Jia, J. Mater. Sci.: Mater. Electron., 2016, 27, 10841–10848 CrossRef CAS.
- A. T. Massey, R. Gusain, S. Kumari and O. P. Khatri, Ind. Eng. Chem. Res., 2016, 55, 7124–7131 CrossRef CAS.
- B. Xu, Y. Li, G. Wang, D. Zhao, K. Pan, B. Jiang, W. Zhou and H. Fu, Dalton Trans., 2015, 44, 6224–6228 RSC.
- H. J. Song, S. You, X. H. Jia and J. Yang, Ceram. Int., 2015, 41, 13896–13902 CrossRef CAS.
- H. Song, S. You and X. Jia, Appl. Phys. A: Mater. Sci. Process., 2015, 121, 541–548 CrossRef CAS.
- Y. Zhao, X. Zhang, C. Wang, Y. Zhao, H. Zhou, J. Li and H. Jin, Appl. Surf. Sci., 2017, 412, 207–213 CrossRef CAS.
- K.-h. HU, D.-f. ZHAO and J.-s. LIU, Trans. Nonferrous Met. Soc. China, 2012, 22, 2484–2490 CrossRef CAS.
- H. Li, F. Xie, W. Li, B. D. Fahlman, M. Chen and W. Li, RSC Adv., 2016, 6, 105222–105230 RSC.
- H. Xie and X. Xiong, J. Environ. Chem. Eng., 2017, 5, 1150–1158 CrossRef CAS.
- L. Ye, H. Xu, D. Zhang and S. Chen, Mater. Res. Bull., 2014, 55, 221–228 CrossRef CAS.
- F. Zhao, Y. Rong, J. Wan, Z. Hu, Z. Peng and B. Wang, Nanotechnology, 2018, 29, 105403 CrossRef PubMed.
- A. Manikandan, P. R. Ilango, C.-W. Chen, Y.-C. Wang, Y.-C. Shih, L. Lee, Z. M. Wang, H. Ko and Y.-L. Chueh, J. Mater. Chem. A, 2018, 6, 15320–15329 RSC.
- L. Kong, A. Enders, T. S. Rahman and P. A. Dowben, J. Phys.: Condens. Matter, 2014, 26, 443001 CrossRef PubMed.
- G. Ersan, O. G. Apul, F. Perreault and T. Karanfil, Water Res., 2017, 126, 385–398 CrossRef CAS PubMed.
- B. Szczęśniak, J. Choma and M. Jaroniec, Adv. Colloid Interface Sci., 2017, 243, 46–59 CrossRef PubMed.
- F. R. Bagsican, A. Winchester, S. Ghosh, X. Zhang, L. Ma, M. Wang, H. Murakami, S. Talapatra, R. Vajtai, P. M. Ajayan, J. Kono, M. Tonouchi and I. Kawayama, Sci. Rep., 2017, 7, 1774 CrossRef PubMed.
- L. Chen, E. E. L. Tanner and R. G. Compton, Phys. Chem. Chem. Phys., 2017, 19, 17521–17525 RSC.
- F. Ferreira, A. Carvalho, Í. J. M. Moura, J. Coutinho and R. M. Ribeiro, J. Phys.: Condens. Matter, 2017, 30, 035003 CrossRef PubMed.
- C. González, B. Biel and Y. J. Dappe, Phys. Chem. Chem. Phys., 2017, 19, 9485–9499 RSC.
- S.-Y. Cho, S. J. Kim, Y. Lee, J.-S. Kim, W.-B. Jung, H.-W. Yoo, J. Kim and H.-T. Jung, ACS Nano, 2015, 9, 9314–9321 CrossRef PubMed.
- S. S. Chou, N. Sai, P. Lu, E. N. Coker, S. Liu, K. Artyushkova, T. S. Luk, B. Kaehr and C. J. Brinker, Nat. Commun., 2015, 6, 8311 CrossRef CAS PubMed.
- D. Ghim, Q. Jiang, S. Cao, S. Singamaneni and Y.-S. Jun, Nano energy, 2018, 53, 949–957 CrossRef CAS.
- L. Jiang, S. Zhang, S. A. Kulinich, X. Song, J. Zhu, X. Wang and H. Zeng, Mater. Res. Lett., 2015, 3, 177–183 CrossRef CAS.
- P. Giannozzi, S. Baroni, N. Bonini, M. Calandra, R. Car, C. Cavazzoni, D. Ceresoli, G. L. Chiarotti, M. Cococcioni, I. Dabo, A. Dal Corso, S. de Gironcoli, S. Fabris, G. Fratesi, R. Gebauer, U. Gerstmann, C. Gougoussis, A. Kokalj, M. Lazzeri, L. Martin-Samos, N. Marzari, F. Mauri, R. Mazzarello, S. Paolini, A. Pasquarello, L. Paulatto, C. Sbraccia, S. Scandolo, G. Sclauzero, A. P. Seitsonen, A. Smogunov, P. Umari and R. M. Wentzcovitch, J. Phys.: Condens. Matter, 2009, 21, 395502 CrossRef PubMed.
- H. J. Monkhorst and J. D. Pack, Phys. Rev. B: Solid State, 1976, 13, 5188 CrossRef.
- Z. Wu, B. Li, Y. Xue, J. Li, Y. Zhang and F. Gao, J. Mater. Chem. A, 2015, 3, 19445–19454 RSC.
- H. Fan, R. Wu, H. Liu, X. Yang, Y. Sun and C. Chen, J. Mater. Sci., 2018, 53, 10302–10312 CrossRef CAS.
- N. Thi Xuyen and J. M. Ting, Chem.–Eur. J., 2017, 23, 17348–17355 CrossRef CAS PubMed.
- S. Han, K. Liu, L. Hu, F. Teng, P. Yu and Y. Zhu, Sci. Rep., 2017, 7, 43599 CrossRef PubMed.
- V. Gupta, O. Moradi, I. Tyagi, S. Agarwal, H. Sadegh, R. Shahryari-Ghoshekandi, A. Makhlouf, M. Goodarzi and A. Garshasbi, Crit. Rev. Environ. Sci. Technol., 2016, 46, 93–118 CrossRef CAS.
- J. Fu, Z. Chen, M. Wang, S. Liu, J. Zhang, J. Zhang, R. Han and Q. Xu, Chem. Eng. J., 2015, 259, 53–61 CrossRef CAS.
- Z. Chen, J. Zhang, J. Fu, M. Wang, X. Wang, R. Han and Q. Xu, J. Hazard. Mater., 2014, 273, 263–271 CrossRef CAS PubMed.
- W. Zhang, X. Xiao, L. Zheng and C. Wan, Can. J. Chem. Eng., 2015, 93, 1594–1602 CrossRef CAS.
- X. Zhang, X. Liu, G. Liang, R. Li, H. Xu and B. Yan, J. Quant. Spectrosc. Radiat. Transfer, 2016, 168, 66–77 CrossRef CAS.
- T. Yan, N. Li, Z. Qiao, W. Li, H. Wang, Z. Jing, Y. Yu and Z. Jiang, J. Alloys Compd., 2019, 784, 256–265 CrossRef CAS.
- M. T. Yagub, T. K. Sen, S. Afroze and H. M. Ang, Adv. Colloid Interface Sci., 2014, 209, 172–184 CrossRef CAS PubMed.
- M. S. Embaby, S. D. Elwany, W. Setyaningsih and M. R. Saber, Chin. J. Chem. Eng., 2018, 26, 731–739 CrossRef CAS.
- Y. Chao, W. Zhu, X. Wu, F. Hou, S. Xun, P. Wu, H. Ji, H. Xu and H. Li, Chem. Eng. J., 2014, 243, 60–67 CrossRef CAS.
- A. Pal, T. K. Jana, T. Roy, A. Pradhan, R. Maiti, S. M. Choudhury and K. Chatterjee, ChemistrySelect, 2018, 3, 81–90 CrossRef CAS.
- Y. Li, H. Li, S. Zhou, H. Yang, F. Xie and W. Li, Res. Chem. Intermed., 2018, 44, 4353–4364 CrossRef CAS.
- Z. Zeng, S. Ye, H. Wu, R. Xiao, G. Zeng, J. Liang, C. Zhang, J. Yu, Y. Fang and B. Song, Sci. Total Environ., 2019, 648, 206–217 CrossRef CAS PubMed.
- S. A. Ansari, R. Kumar, M. Barakat and M. H. Cho, J. Mater. Sci.: Mater. Electron., 2018, 29, 7792–7800 CrossRef CAS.
Footnote |
| † Electronic supplementary information (ESI) available. See DOI: 10.1039/c9ra05427h |
| This journal is © The Royal Society of Chemistry 2019 |

