DOI:
10.1039/C9RA05414F
(Paper)
RSC Adv., 2019,
9, 35599-35607
Structural, magnetic, electrical and dielectric properties of Pr0.8Na0.2MnO3 manganite
Received
15th July 2019
, Accepted 22nd October 2019
First published on 1st November 2019
Abstract
The orthorhombic Pr0.8Na0.2MnO3 ceramic was prepared in polycrystalline form by a Pechini sol–gel method and its structural, magnetic, electrical and dielectric properties were investigated experimentally. A structural study confirms that the sample is single phase. Magnetic measurements show that the sample is a charge ordered manganite. The sample undergoes two successive magnetic phase transitions with the variation of temperature: a charge ordering transition occurred at TCO = 212 K followed by a paramagnetic (PM) to ferromagnetic (FM) transition around TC = 115 K. From an electrical point of view, a saturation region was marked in the conductivity as a function of temperature σ(T) curves at a specific temperature. The dc-conductivity (σdc) reaches a maximum value at 240 K. The obtained results are in good agreement with the temperature dependence of the average normalized change (ANC). We found that the conduction mechanism was governed by small polaron hopping (SPH) in the high temperature region and by variable range hopping (VRH) in the low temperature region. Complex impedance analysis indicates the presence of a non-Debye relaxation phenomenon in the system. Also, the compound was modeled by an electrical equivalent circuit. Then, the contribution of the grain boundary in the transport properties was confirmed.
1. Introduction
Perovskite manganites with the general formula RAMnO3 (R (rare earth): La, Nd, Pr; A (monovalent ion): K, Na, Rb, Cs) have been of considerable recent interest due to their magnetic, electrical and magnetocaloric properties. They can be used as magnetoresistive transducers, magnetic sensors, computer memory systems and magnetic refrigerants.1,2 Numerous studies of the mixed-valence manganites show that their magnetic and electrical properties depend principally on the competition between different interactions (charge, spin, orbital, …). These interactions are very sensitive to several intrinsic parameters such as Mn3+/Mn4+ ratio, substitution level, cation disorder, oxygen stoichiometry, grain boundary engineering and particle size.3–6 Moreover, mixed-valence manganites are characterized by the presence of mobile eg electrons hopping from Mn3+ to Mn4+ cations. This interaction is considerably affected by some external stimuli (applied electric and magnetic fields) and is responsible for the ferromagnetism and metallic conductivity observed in these oxides. In Mn-based manganites, different conduction mechanisms (hopping and percolation process) appear when modifying intrinsic parameters or external stimulus. The physical properties of maganites oxides can be improved by closing dopants,7,8 substitution sites9 preparation route10,11 and insertion of nanostructures.12 Many methods of synthesis have been used to manufacture rare earth manganites with perovskites structure, including solid-state reaction,13,14 sol–gel,15 co-precipitation,16 combustion,17 hydrothermal,18 acrylamide polymerization19 and microwave techniques.20 Most of the work available on the preparation of sodium doped praseodymium manganites is commonly based on high temperature ceramic method.21,22 Basically, many authors have worked on ferromagnetic or charge-ordered manganites and their synthesis methods to optimize their electrical and magnetic properties towards potential applications in memory devices. Particularly, in the case of Na-doped manganites, the physical properties show different scenarios when the sample is subjected to several measurements. Especially, it is observed that the La0.8Na0.2MnO3 system is only undergoes a transition from ferromagnetic metal to a paramagnetic insulator phase between 1.8 and 400 K.23,24 However, according to the results of Z. Q. Li et al.,25 the Nd0.8Na0.2MnO3 manganite prepared by the sol–gel method exhibits complex behaviour when the sample is exposed to external stimuli. The latter compound shows four distinct temperature intervals with different physical properties. For T > 155 K, the sample is a paramagnetic insulator. At T = 155 K, the aforementioned compound undergoes a first order charge-ordered (CO) transition. For 110 K < T < 155 K, the Nd0.8Na0.2MnO3 is a paramagnetic CO insulator. Below 110 K, the authors demonstrate the coexistence of ferromagnetic metal clusters and paramagnetic insulator domains in Nd0.8Na0.2MnO3, which makes this manganite intrinsically inhomogeneous. For temperatures below 40 K, the sample exhibits metallic behaviour because in this temperature range the fraction of ferromagnetic metal clusters exceeds its percolation threshold value. Also, it is observed that under 14 T the CO state is destroyed and it remains only the ferromagnetic metal to paramagnetic transition insulator in this system throughout the measured temperature range. All of these behaviors observed on monovalent-doped manganites provide a rich field for further investigations aimed at better understanding the many properties and phenomena of manganites. It is also interesting to note that the sodium-doped manganites have been studied because of the possibility of using them as magnetic refrigerant materials.26–29 These oxides demonstrate significant magnetic effect values which make them potential candidates for magnetic cooling. In contrary, the electrical and dielectric properties have rarely been investigated in Na-doped manganites. Besides, the prospect of novel electroceramic compositions in microelectronics has led to extensive research that pays particular attention to determining functional properties of manganites. Obtaining reliable information on either the microstructure, the distribution of electrical parameters, or their mutual interaction with one another definitely decides the progress in utilization of these materials in current and emerging applications such as resonator, capacitor, and sensor. Motivated by such observations, the study presented in this work was conducted to further advance in developing multifunctional materials based on sodium doping manganites system. However, the 20% sodium doped praseodymium manganite was successfully prepared by sol–gel processing. Then, the crystal microstructure, magnetic, electrical and dielectric properties of Pr0.8Na0.2MnO3 ceramic will be discussed. Such work completes structural and magnetic studies and helps understand the interplay among magnetic, electric and lattice interactions. It also yields optimized physical parameter which can be useful in detecting or sensing devices.
2. Experimental details
The polycrystalline Pr0.8Na0.2MnO3 sample has been prepared by using Pechini sol–gel method. Appropriate proportions of high purity (>99.9%) Pr6O11, Na2CO3, and MnO2 were dissolved in a concentrated nitric acid solution with continuous stirring and moderate heating (50 °C) resulting in a transparent solution. In this synthesis route, the nitric acid was added to convert the required constituent oxides into their respective nitrates. The monohydrate citric acid (complexing agent) and the ethylene glycol (polymerization agent) were used as additional agents to ensure the homogeneity and the transparency of the solution. The obtained solution was dried at 120 °C to promote polymerization and to allow solvent removal. A viscous gel was thus formed and heated up to 300 °C. This step was carried out to ensure the propagation of a combustion, which transforms the gel into a fine powder. After crushing, the sample was calcined at 600 °C during 10 h and then at 800 °C during 14 h in air with intermediate grinding. Subsequent sintering was done at 900 °C for 24 h, and at 1000 °C in air for 24 h. In these steps the products were then ground, pressed into pellets and finally slow-cooled to room temperature in order to prepare the required sample. After that, the obtained sample was checked the crystal structure by an X-ray diffractometer using CuKα radiation. The surface morphology and grain size distribution were conducted by Scanning Electron Microscopy (SEM). The magnetization measurements were done by using an extraction magnetometer. Two silver circular electrodes have been deposited on both sides of each pellet by means of thermal evaporation under vacuum. Thus, we obtained a configuration of plate capacitor to measure both the electrical and dielectric properties. Then, the aforementioned sample was mounted in a cryostat VPF 800 of Janis Corporation which allows the variation of temperature. An Agilent 4294A impedance analyser was used in order to conduct and collect measurements over a wide frequency range [40–107 Hz]. The latter measurements were executed by the parallel mode for the equivalent circuit with signal amplitude of 20 mV.
3. Results and discussions
A. Structural properties
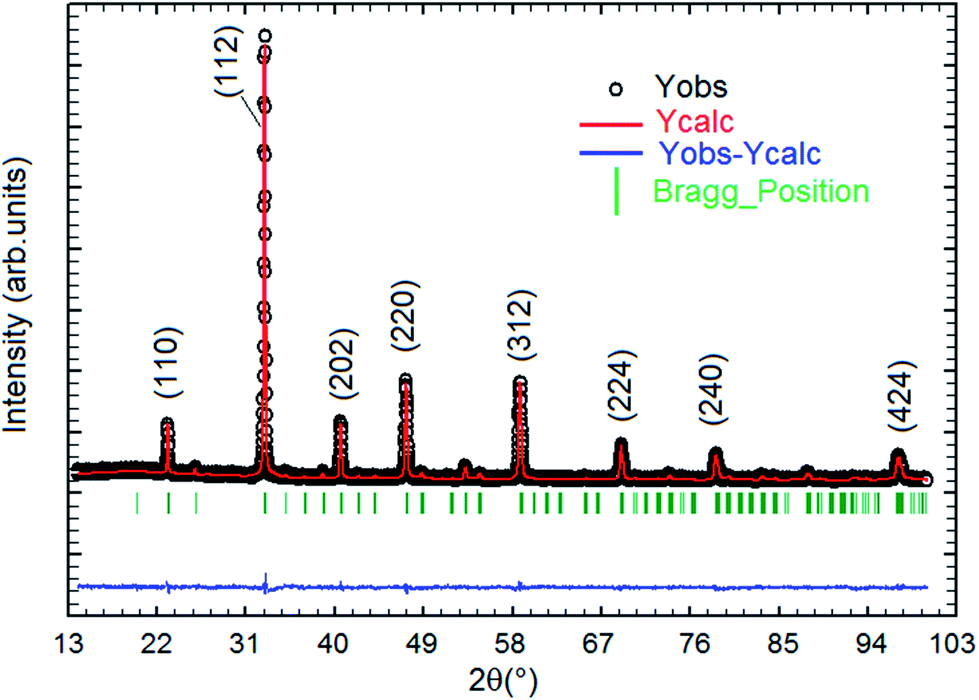
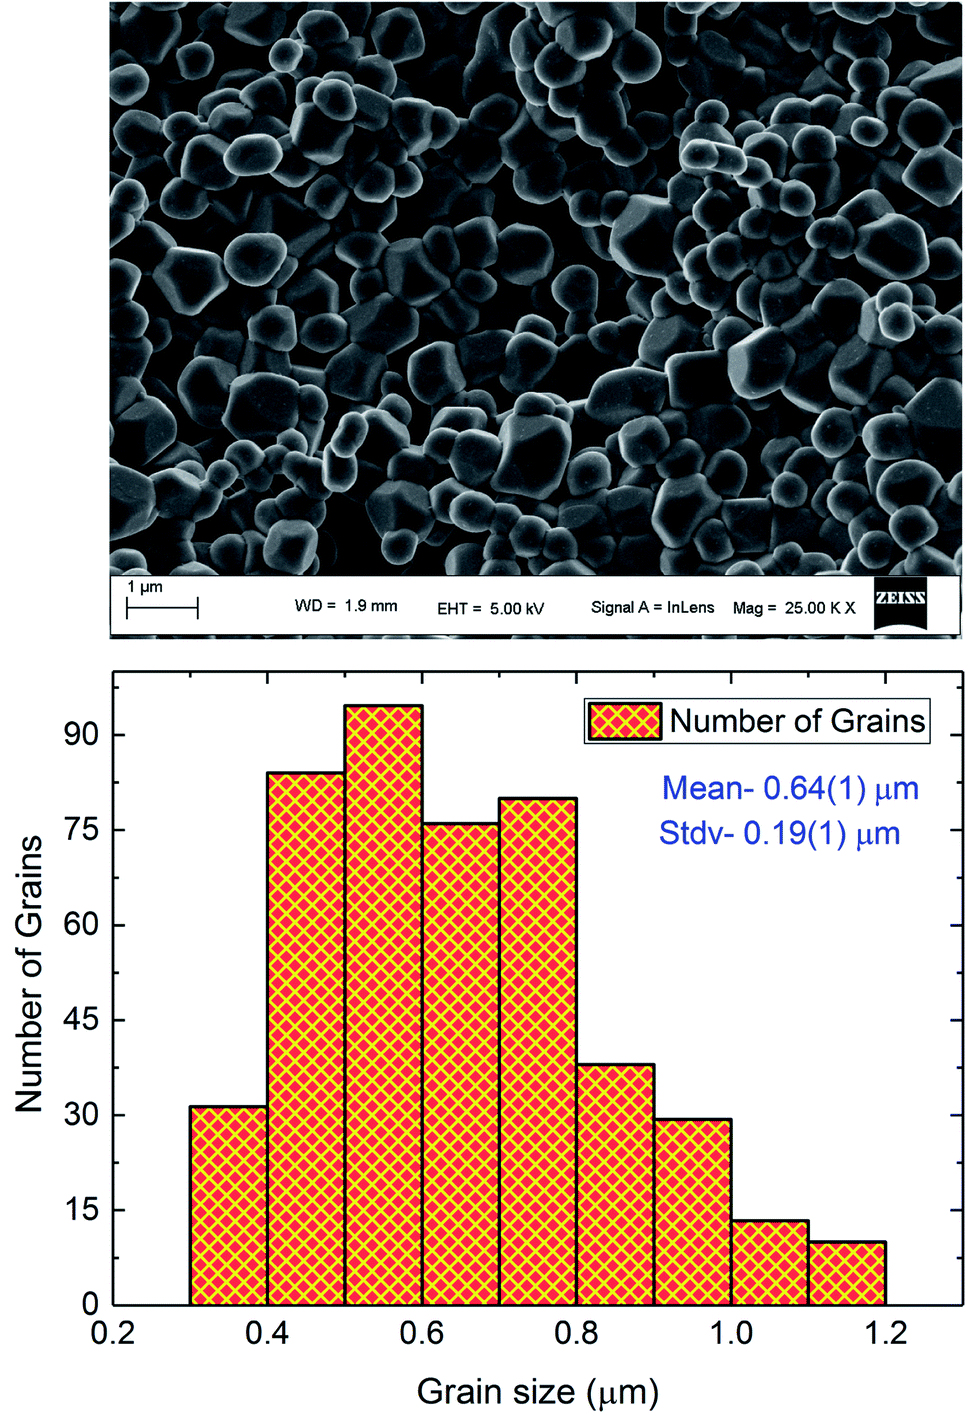
Fig. 1 displays the X-ray powder diffraction patterns of the polycrystalline ceramic Pr0.8Na0.2MnO3 at room temperature. The XRD investigation confirmed the single-phase nature of the Pr0.8Na0.2MnO3 sample, within the sensitivity limits of the experiment. The powder diffraction pattern is analyzed by the Rietveld refinement method using the Fullprof program.30,31 The diffraction peaks can be indexed in the orthorhombic setting of the Pbnm space group like Pr0.8Na0.2MnO3 prepared by solid–solid method.32 The cell parameters are found to be a = 5.448 (3) Å, b = 5.435 (9) Å and c/√2 = 5.434 (5) Å and the unit cell volume V = 227.61 Å3. The average crystallite size, determined from Rietveld refinement, is estimated to be 72.9 (7) nm. The quality of the refinement is evaluated through the goodness of the fit indicator χ2 = 1.55, the residuals for Braggs factor RBragg = 9% and structure factor RF = 11.5%. All these parameters were used a numerical criterion of the quality of the fit of calculated to experimental diffraction data. The morphology and grain size of Pr0.8Na0.2MnO3 ceramic, revealed by SEM, are depicted in Fig. 2. The SEM micrographs reveals that all the grains are multi-faceted. 453 grains were taken randomly from the micrographs with grain size distribution in the range 0.3–1.2 μm as shown in Fig. 2. The average grain size based on the histogram is around 0.64 (1) μm. For the prepared sample, the average size observed on SEM graph are much larger than that derived by XRD patterns which indicates that each grain observed by SEM basically consists of several crystallites.33 Such behavior is observed in other manganites such as Pr0.85Na0.15MnO3. Regarding the result obtained for the latter compound, a clear difference was observed between the size of the grains and that of the crystallites. The authors explained that this difference is due to the fact that the grains are composed of several crystallites, probably because of internal stresses and/or defects in the structure.34
 |
| | Fig. 1 X-ray diffraction pattern and the corresponding Rietveld refinement of the Pr0.8Na0.2MnO3 sample. | |
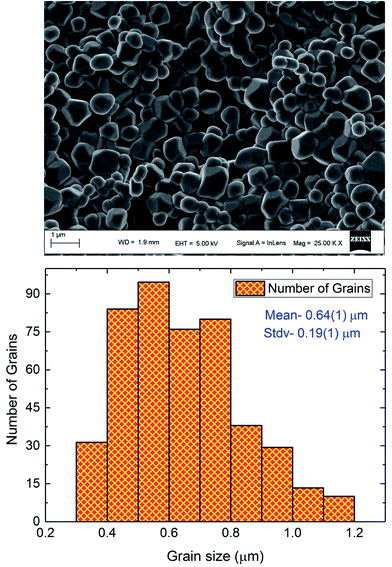 |
| | Fig. 2 The SEM micrograph of Pr0.8Na0.2MnO3 and histogram of grain size distribution. | |
B. Magnetic properties
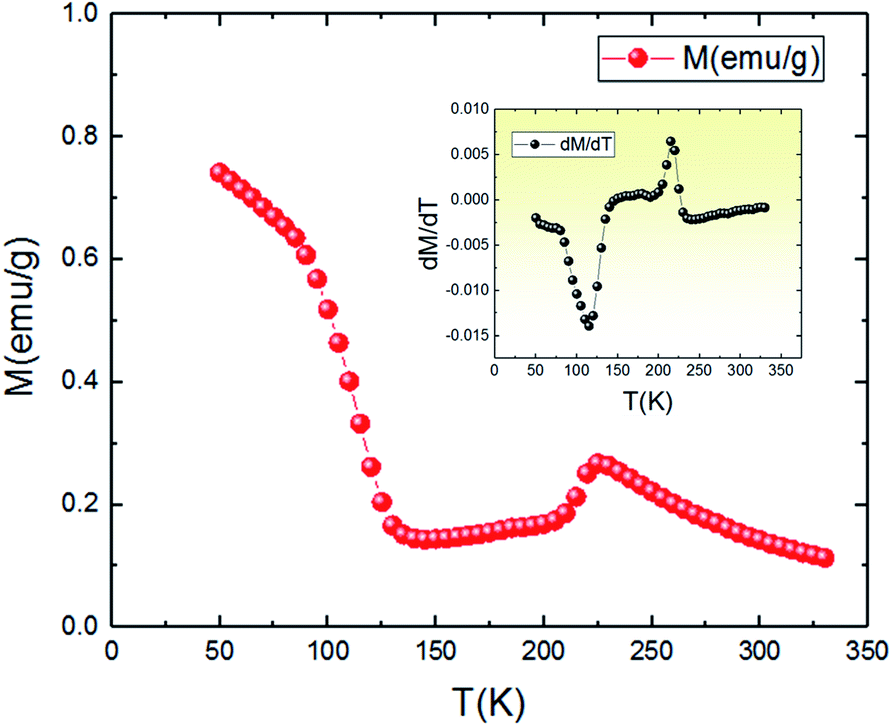
The temperature dependence of magnetization M(T) for the aforementioned compound was studied in the field-cooled (FC) process with an applied field of 0.05 T, and the results are shown in Fig. 3. With the decrease of temperature, it is clearly observed that the magnetization gradually increases and then slightly decreases around the TCO = 212 K. The presence of this small broad hump indicates the existence of a charge ordering (CO) state. Such kind of peak is also observed in other manganites, in particular Pr0.6Ca0.4MnO3,35 Pr1.xNaxMnO3,36 Nd0.5Ca0.5MnO3,37,38 and Ca1−xCexMnO3 (0.075 < x < 0.20),39 and have been established (by neutron diffraction or electron diffraction) to be associated with a transition into Mn-site charge-ordered state. Also, the M(T) keeps on decreasing, but abruptly shifts to a rise near the temperature TC = 115 K, exhibiting a change transition from a disordering state to an ordering state and indicating a typical paramagnetic–ferromagnetic phase transition. This behavior is relatively similar to those obtained by other authors.36 It should be noted that the critical temperatures (TCO and TC) are obtained from the extrema (maximum and minimum) values of dM/dT vs. T curves shown in the inset of Fig. 3.
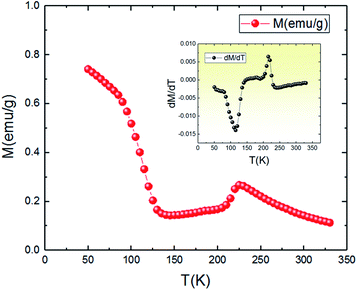 |
| | Fig. 3 Temperature dependence of the magnetization at 0.05 T for Pr0.8Na0.2MnO3 sample. The inset is the dM/dT curve. | |
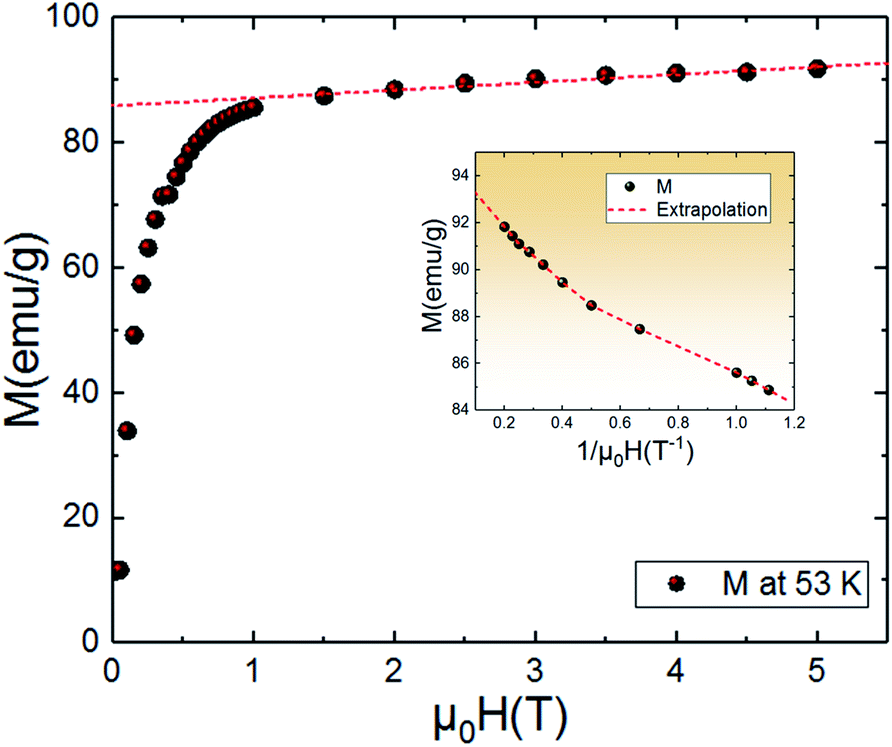
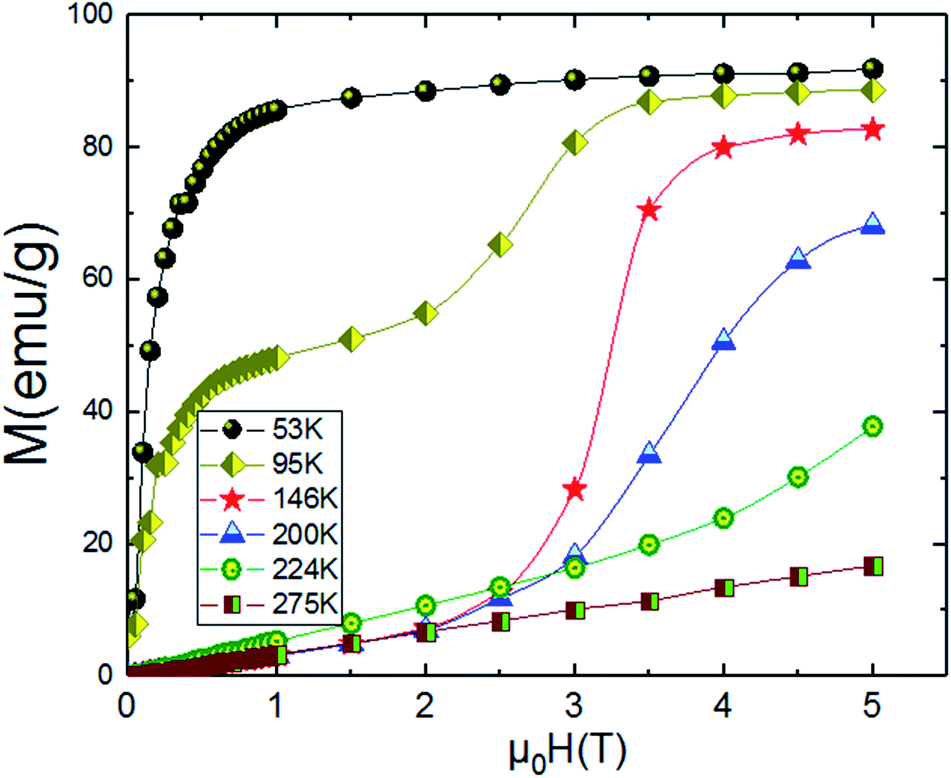
An approximate method of spontaneous magnetization MSp at 53 K can be estimated40 by extrapolating the linear part of the high field magnetization curve to zero field. MSp is found to be 86 emu g−1 for the Pr0.8Na0.2MnO3. Also, the saturations magnetization Msat at 53 K can be obtained from the M vs. 1/μ0H data at 1/μ0H = 0 (see Fig. 4). The obtained value of Msat is 93.3 emu g−1. In addition to the M(T) measurement, the magnetic field dependence of the magnetization, M(H), at a series of selected temperature points are shown in Fig. 5. For each selected temperature, the measurements were performed from 0 T to 5 T. It can be seen that the M(H) curves prove the presence of several magnetic phases. In the high temperature region of T = 275 K, the presented isothermal magnetization increases almost linearly with increasing magnetic fields, which is consistent with the paramagnetic character (PM). As T = 224, 200 and 146 K, M(H) increases almost linearly with the applied magnetic field, then the slope of M(H) curve increases rapidly as the magnetic field is increased further, which is a clear signature of the coexistence of FM and AFM-CO phases. The latter character indicates the presence of metamagnetic transition in the Pr0.8Na0.2MnO3 sample. According to the M(T) data, the sample lies in a CO state at these temperature regions. Furthermore, as we can see from the same figure the apparition of the ferromagnetic behavior indicating the disappears of the metamagnetic transition at low temperature T = 95 and 53 K. Furthermore, the M(H, T = 53 K) increases quickly at low magnetic field corresponding to a rapid rearrangement of the magnetic domains and then tends to saturate from the 0.7 T value of H and beyond the value of the field, the magnetization remains almost constant tending towards saturations. In comparison with other charge ordered manganite, similar behaviour is observed in La0.275Pr0.35Ca0.375MnO3. It is clearly seen that this system passes through different magnetic ground states namely PM for T ≥ 220 K, AFM-CO for 80 ≤ T < 200 K and FM for 10 ≤ T ≤ 50 K. Particularly, As T = 200 K, the M(H) curve rises almost linearly with increasing H up to 3.41 T, then the slope of M–H curve shows a rapid increase as the magnetic field increases further.41
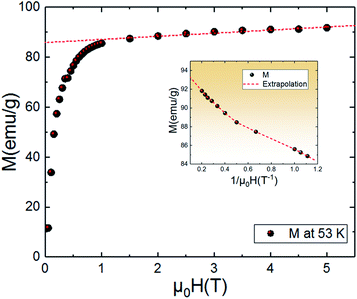 |
| | Fig. 4 Variation of the magnetization as a function of applied magnetic field for of Pr0.8Na0.2MnO3 sample at T = 53 K. In the inset: determination of the saturation magnetization of the samples at 53 K. Red dashed lines are given as guides to the eye. | |
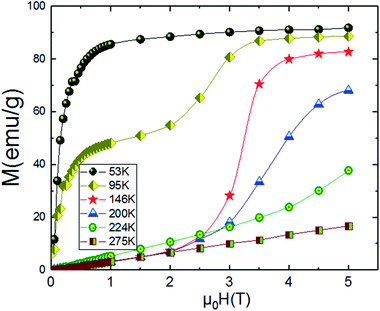 |
| | Fig. 5 Isothermal magnetization for Pr0.8Na0.2MnO3 sample measured at selected temperature. | |
C. Electrical and dielectric properties
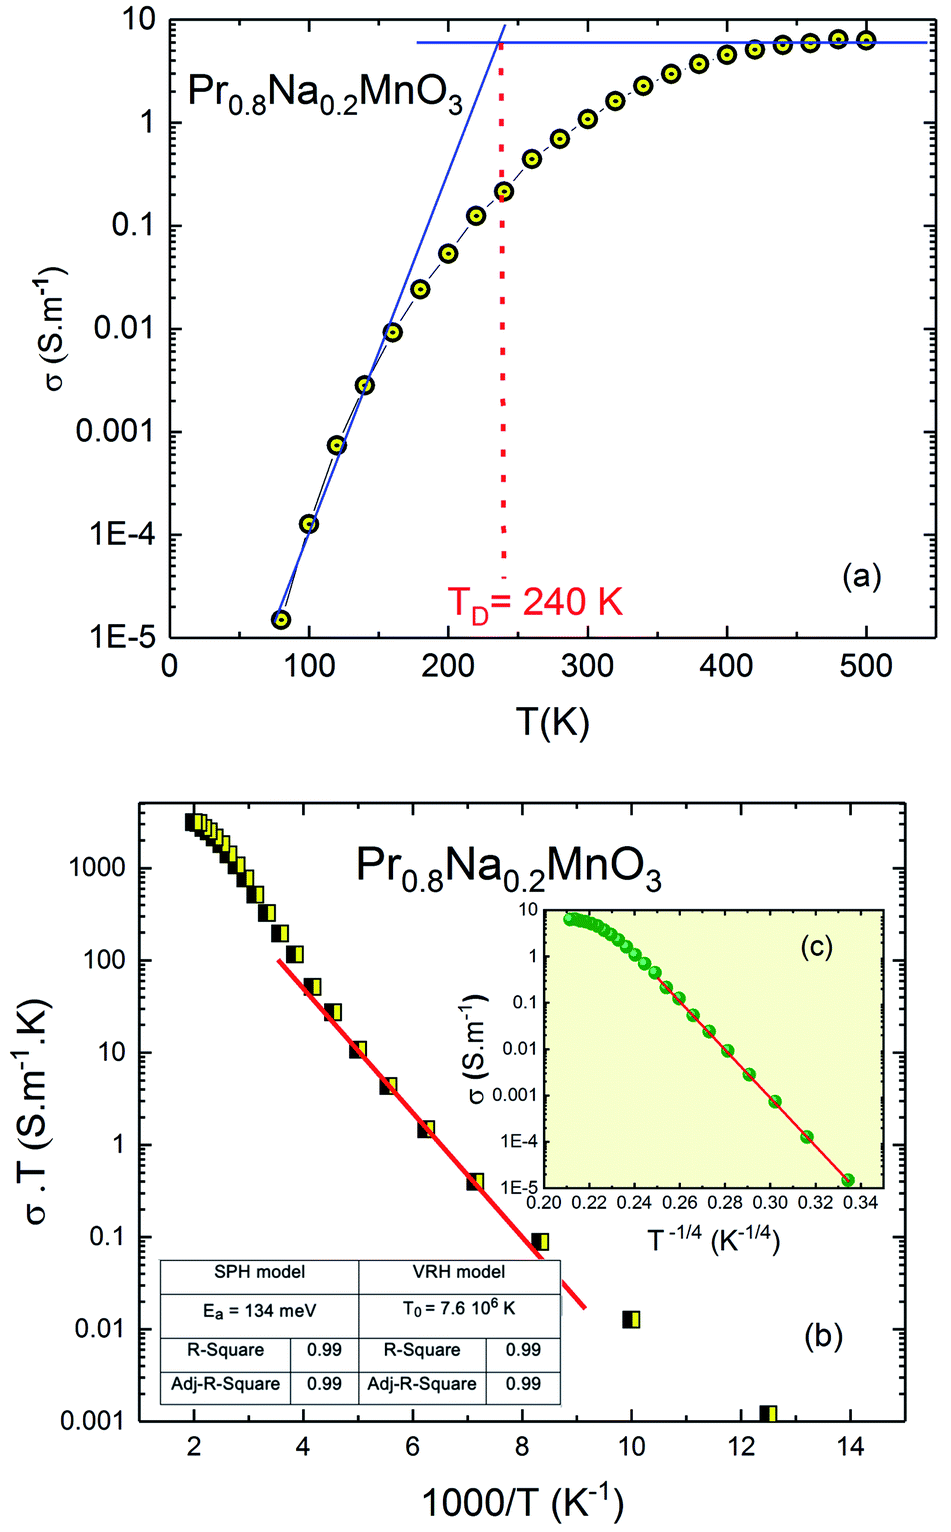
a. DC-conductivity analysis. The variation of dc-conductivity as a function of temperature for Pr0.8Na0.2MnO3 is shown in Fig. 6a. It is clear that the conductivity increases throughout the temperature range without appearance of transition. The investigated material exhibits a semiconductor behavior. When the temperature increases, we estimate that the density of free carriers increases and the carriers acquire a sufficient thermal energy to be able to easily cross the encountered barriers. In the σ(T) curve we observe a saturation region at high temperature. In such temperature region the available trapping states are completely emptied and the free carrier density reaches its maximum. We consider these factors to explain the plateau observed in the curve σ(T) for higher temperatures.
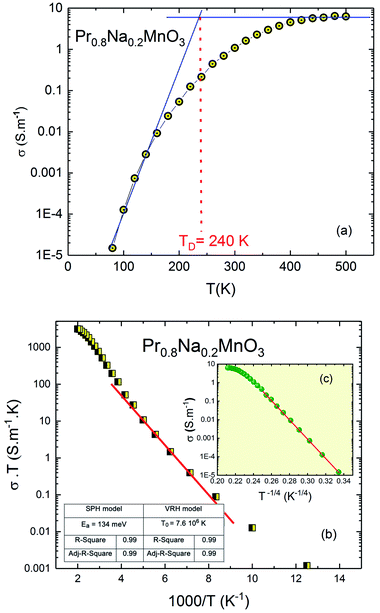 |
| | Fig. 6 (a) Temperature dependence of the conductivity of Pr0.8Na0.2MnO3 system. (b) SPH model, (c) in the inset; VRH model. | |
To extract information about the type of conduction mechanism, we used the experimental data in the Fig. 6a. We have applied two jump models: in the high temperature region, we use the small polaron hopping model (SPH) which is mathematically described by the relation σDCT = σ0![[thin space (1/6-em)]](https://www.rsc.org/images/entities/char_2009.gif) exp(−Ea/kBT). With σ0 is the pre-exponential factor, Ea is the activation energy and kB is the Boltzmann constant. In the low temperature region, the variable range hopping model (VRH) is used using the relationship: σDC = Aexp(−T0/T)1/4. Where T0 is a constant. The fitting parameters considering both models in dc conductivity were inserted in the inset of Fig. 6b. For perovskite materials,42,43 T0 is an important parameter used to calculate the density of the localized states at the Fermi level. Such parameter is found to be between 103 and 108 for manganite and ferrite materials. The obtained value is in good agreement with the literature.43,44 The Fig. 6b confirms that the conduction process is thermally activated and that electronic conduction is dominated by the thermally activated hopping of small polaron.44 The inferred activation energy is about 134 meV which is in good agreement with the literature for manganite system. For the doped perovskite manganite, it is found that the activation energy values depend on the dopant element concentration and related to the temperature range. The inferred activation energy value agrees with previous work45,46 for similar manganite materials. Recently,46 it is found that Ea varies from 110 meV to 165 meV as function of the dopant element concentration which is related to the localization and delocalization effects. For hopping process of the charge carriers, the obtained Ea value for our system (Ea = 134 meV) is found to be in the same range. The inset of Fig. 6b (see Fig. 6c) confirms that the conduction mechanism is dominated by the VRH process in the low temperature region where it can be elucidated by the existence or distribution of trapping centers having multiple activation energy.47–49
exp(−Ea/kBT). With σ0 is the pre-exponential factor, Ea is the activation energy and kB is the Boltzmann constant. In the low temperature region, the variable range hopping model (VRH) is used using the relationship: σDC = Aexp(−T0/T)1/4. Where T0 is a constant. The fitting parameters considering both models in dc conductivity were inserted in the inset of Fig. 6b. For perovskite materials,42,43 T0 is an important parameter used to calculate the density of the localized states at the Fermi level. Such parameter is found to be between 103 and 108 for manganite and ferrite materials. The obtained value is in good agreement with the literature.43,44 The Fig. 6b confirms that the conduction process is thermally activated and that electronic conduction is dominated by the thermally activated hopping of small polaron.44 The inferred activation energy is about 134 meV which is in good agreement with the literature for manganite system. For the doped perovskite manganite, it is found that the activation energy values depend on the dopant element concentration and related to the temperature range. The inferred activation energy value agrees with previous work45,46 for similar manganite materials. Recently,46 it is found that Ea varies from 110 meV to 165 meV as function of the dopant element concentration which is related to the localization and delocalization effects. For hopping process of the charge carriers, the obtained Ea value for our system (Ea = 134 meV) is found to be in the same range. The inset of Fig. 6b (see Fig. 6c) confirms that the conduction mechanism is dominated by the VRH process in the low temperature region where it can be elucidated by the existence or distribution of trapping centers having multiple activation energy.47–49
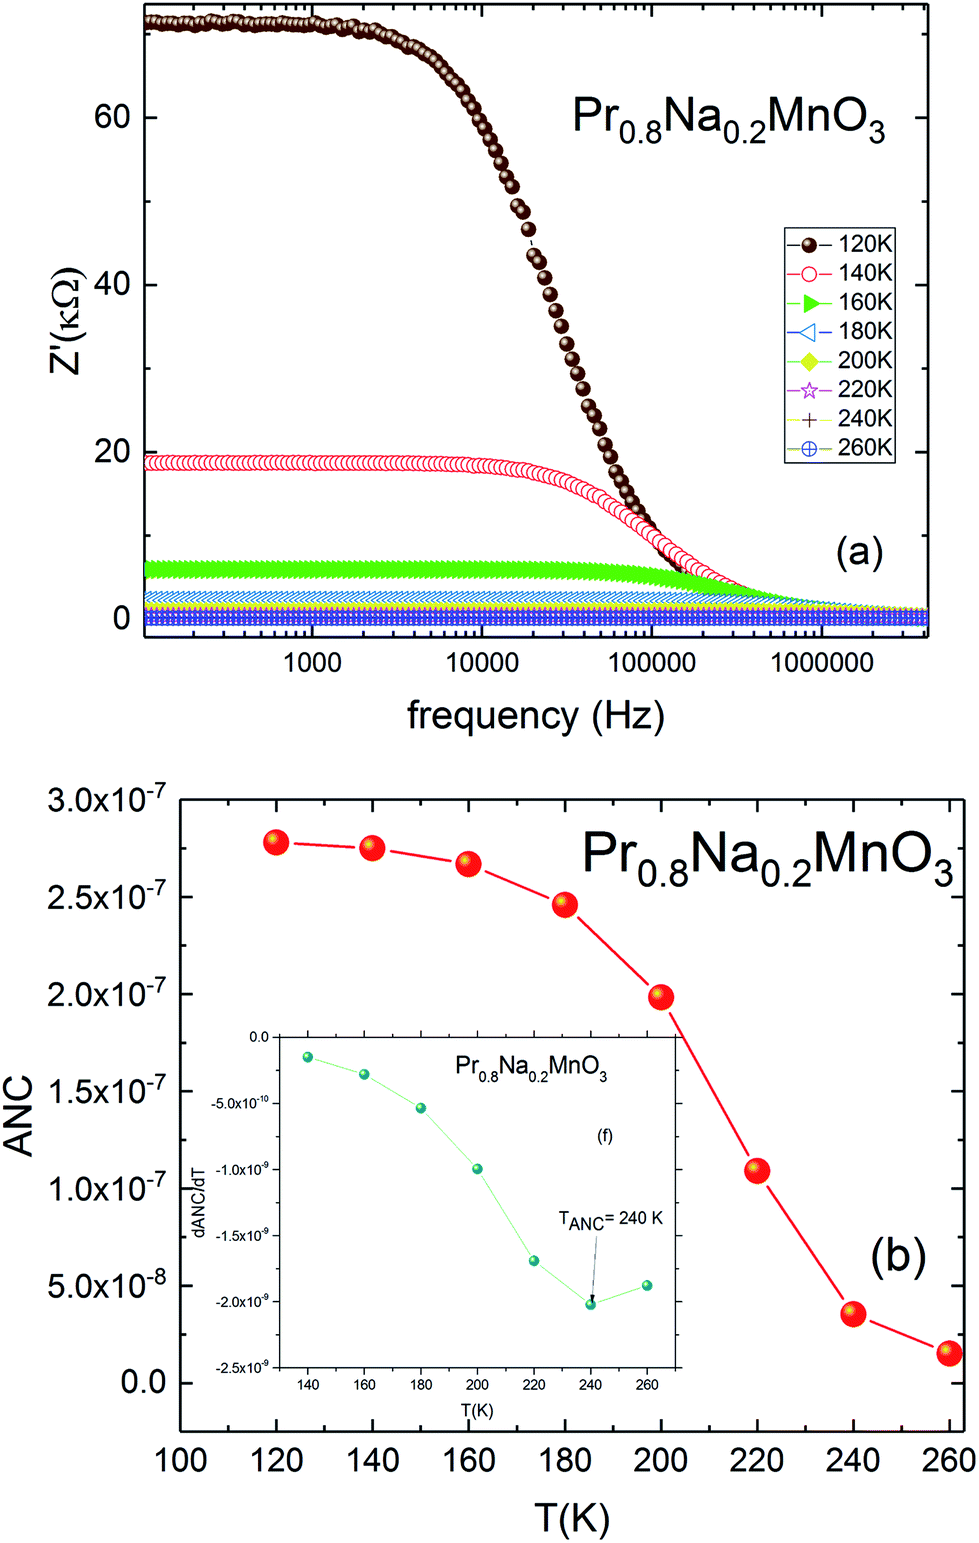
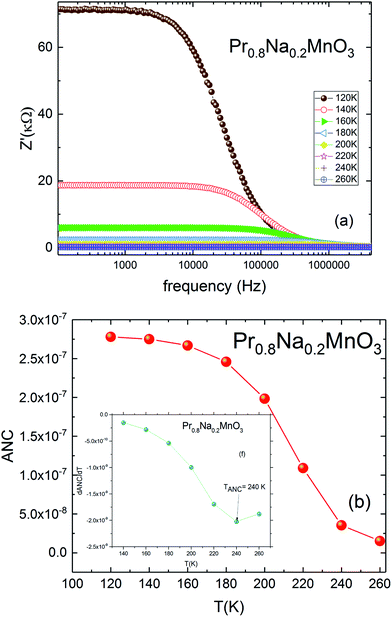
b. Complex impedance analysis. Fig. 7a shows the variation of the real part of impedance (Z′) with the frequency at different temperature. At low temperature, the impedance is typically high. When increasing the frequency and the temperature, Z′ decreases indicating the increase of the conductivity. Such evolution can be attributed to the improvement of mobility and the reduction of trapped charge density.50 At high frequencies, the values of Z′ merge, which confirms the presence of space charge polarization in the material. This is also confirmed by the high values of Z′ observed at low frequencies. It is well known that the average normalized change (ANC) is treated as the intrinsic response of the material. Such parameter clarified the changes of Z′ as a function of temperature. The ANC is deduced using the equation ANC = (ΔZ′/Δf)/Z0, where Z0 is the value of Z′ at frequency equal 0. Z0 is determined from the extrapolation of the plateau to low frequency. ΔZ′ is the difference between the value Z'low of Z′ at low frequency (flow) and its value Z'high at high frequency (fhigh): ΔZ' = Z'low − Z'high and Δf = flow − fhigh.51For the investigated compound, the variation of the ANC as a function of temperature is illustrated in Fig. 7b. The curve is characterized by a region where the ANC is temperature independent. Then a change is observed by increasing the temperature. This change indicates the presence of different conduction mechanisms in the low and high temperature regions. The inset of Fig. 7b shows the variation of the derivative of ANC as a function of temperature.52 A change in the slope of the derivative of ANC with temperature was observed at TANC = 240 K. Such change indicates that the available density of trapped charge has vanished. These temperature values are identical to those observed in the conductivity-temperature dependence (TANC = TD) (Fig. 6a). These results are in concordance with the conductivity saturation observed in Fig. 6a and confirms the presence of different conduction mechanisms. In the σ(T) curve, the conductivity increases rapidly with increasing temperature. When T = TD = 240 K, σ increases slowly and reaches a saturation region in the high temperature. As TANC is the temperature at which the trapped center are vanished (TANC = 240 K). So, the variation of σ(T) can be explained by the same phenomenon as TANC = TD.
 |
| | Fig. 7 (a) Real part of impudence Z′ vs. frequency for Pr0.8Na0.2MnO3 model. (b) Temperature dependence of ANC parameter, in the inset; dANC/dT. | |
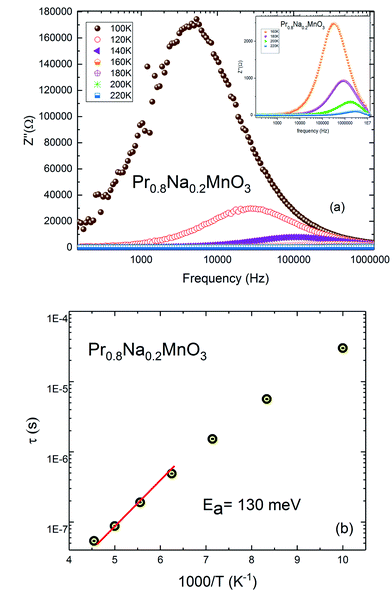
The frequency and temperature dependence of imaginary part of impedance Z′′(f) for Pr0.8Na0.2MnO3 is shown in Fig. 8a. The spectrum is characterized by the appearance of a peak at a frequency which is conventionally known as the “relaxation frequency” (fr). It is noteworthy from Fig. 8a that the peak height decreases and the relaxation frequency shifts to the higher frequencies when the temperature increases. We join this result to the previous ones to confirm the semiconducting behavior of the sample and to indicate that thermally activated charge carriers are implicated in electrical conduction. The appeared peaks in Z′′ (f) spectra are well defined. Such observation indicates the presence of electrical relaxation phenomenon. The relaxation frequency fr values are used to calculate the relaxation time τ using the relation 2πfrτ = 1. Fig. 8b shows the variation of logτ versus 1000/T. That the activation energy value deduced from relaxation time is equal to Ea inferred from conductivity analysis (Ea = 130 meV). It can be concluded that some relaxation species, such as defects, may be accountable for electrical conduction in the compound.53
 |
| | Fig. 8 (a) Plot of the imaginary part of impedance with frequency of Pr0.8Na0.2MnO3 system. (b) Plot of relaxation time vs. 1000/T. | |
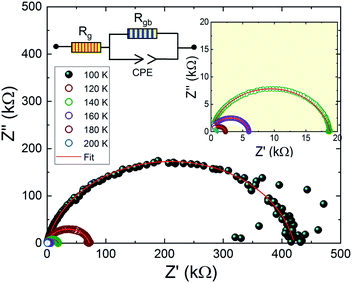
Fig. 9 shows the complex impedance plots of Pr0.8Na0.2MnO3 at different temperatures. The spectra are characterized by the presence of a semicircle arc for all temperatures. We observe that the diameters of semicircles decrease when increasing temperature. Such behavior proves that conduction process is thermally activated and confirms the semiconducting character of the compound in the whole explored temperature range. In general, the complex impedance analysis was used to correlate the microstructure of the material with the ac electrical properties using an electrical equivalent circuit model. The investigated sample can be modeled by an equivalent circuit model which contains a grain resistance Rg connected in series with (Rgb//CPE). Fig. 9, where Rgb and CPE are respectively the resistance and the constant phase element impedance. From impedance spectrum, we can easily determine the Rg and Rgb values. The left intercept of these mi-circle with Z′ axis gives the Rg value and the right one gives the total resistance R = Rgb + Rg. As shown in Fig. 9, the Rgb values are greater than Rg ones. In perovskite manganite the grain boundaries are more resistive than grains. Such behavior can be attributed to the non-stoichiometric distribution of oxygen and the existence of dangling bonds on the grain boundaries. These factors play a role in charge carrier traps and barrier layer width.54–56 From Table 1, it is remarked that the grain exhibits a conductor character. Grain resistance has a weak value which is temperature independent. In contrary, the grain boundary exhibits a significant resistive character. It is observed that the grain boundary resistance decreases dramatically with increasing temperature confirming the thermally activated conduction process. Then, such results indicate that the electrical and dielectrical properties in the present compound are governed by the grain boundary. As it is well noticed that the investigated compound exhibits a conductor grain and a resistive grain boundary, so, we can suppose that the dielectric structure of the sample is constituted by low resistive grains separated by poor conducting thin grain boundaries. Then, when the electric field is applied, the localized accumulation of charges leads to the interfacial polarization which defined the dielectric properties. Similar behavior was observed in manganite materials family.57
 |
| | Fig. 9 Impedance plan plots of Pr0.8Na0.2MnO3 model. The electrical equivalent circuit is used for all temperature. | |
Table 1 Electrical equivalent circuit parameters
| |
100 K |
120 K |
140 K |
160 K |
180 K |
200 K |
| Grain resistance (kΩ) |
0.1 |
0.1 |
0.1 |
0.1 |
0.1 |
0.1 |
| Grain boundary resistance (kΩ) |
420 |
70 |
19 |
6 |
2 |
1 |
| Grain boundary capacity (10−10 F) |
2.9 |
3.3 |
3.7 |
3.4 |
3.1 |
3 |
| Exponent 'α' (grain boundary) |
0.875 |
0.879 |
0.883 |
0.900 |
0.922 |
0.947 |
4. Conclusion
Summarizing, we have prepared the Pr0.8Na0.2MnO3 sample by a Pechini sol–gel process. The structural, magnetic, electric and dielectric investigations have been performed. Rietveld refinement of XRD pattern shows that Pr0.8Na0.2MnO3 possesses orthorhombic structure with Pnma space group. The prepared sample exhibit different magnetic ground states, such as paramagnetic (PM), charge-ordering (CO) and ferromagnetic (FM) behavior. Moreover, we have found that the sample shows a semiconductor behavior and that a dc-conductivity is marked by saturation value at a high temperature. The temperature dependence of the average normalized change shows that the temperature at which the available density of trapped charge states vanishes is close to the temperature at which the conductivity begins to saturate. The activation energy value deduced from the conductivity and relaxation time are close to each other. These results confirm that the electric conduction and relaxation phenomenon are related to the same origin.
Conflicts of interest
There are no conflicts to declare.
Acknowledgements
This study is supported by the Tunisian Ministry of Higher Education and Scientific Research and the Neel Institute.
References
- V. S. Kolat, H. Gencer, M. Gunes and S. Atalay, Effect of B-doping on the structural, magnetotransport and magnetocaloric properties of La0.67Ca0.33MnO3 compounds, J. Mater. Sci. Eng. B, 2007, 140, 212 CrossRef CAS.
- N. Khare, D. P. Singh, H. K. Gupta, P. K. Siwach and O. N. Srivastava, Preparation and study of silver added La0.67Ca0.33MnO3 film, J. Phys. Chem. Solids, 2004, 65, 867 CrossRef CAS.
- A. Sakka, R. M’nassri, N. Chniba-Boudjada, M. Ommezzine and A. Cheikhrouhou, Effect of trivalent rare earth doping on magnetic and magnetocaloric properties of Pr0.5(Ce,Eu,Y)0.1Sr0.4MnO3 manganites, Appl. Phys. A: Mater. Sci. Process., 2016, 122(6), 603 CrossRef.
- R. M'nassri and A. Cheikhrouhou, Evolution of Magnetocaloric Behavior in Oxygen Deficient La2/3Ba1/3MnO3−δ Manganites, J. Supercond. Novel Magn., 2014, 27(6), 1463–1468 CrossRef.
- P. Lampen, A. Puri, M.-H. Phan and H. Srikanth, J. Alloys Compd., 2012, 512, 94 CrossRef CAS.
- R. M'nassri, N. ChnibaBoudjada and A. Cheikhrouhou, J. Alloys Compd., 2015, 626, 20 CrossRef.
- A. Nucara, F. MilettoGranozio, W. S. Mohamed, A. Vecchione, R. Fittipaldi, P. P. Perna, M. Radovic, F. M. Vitucci and P. Calvani, Optical spectra of LaMn0.5Ga0.5O3: A contribution to the assignment of the electronic transitions in manganites, Phys. Rev. B: Condens. Matter Mater. Phys., 2014, 433, 102 CrossRef CAS.
- L. Seetha Lakshmi, V. Sridharan, D. V. Natarajan, R. Rawat, S. Chandra, V. SankaraSastry and T. S. Radhakrishnan, Double metal–insulator transitions and MR in La0.67Ca0.33Mn1−xRuxO3 (x ≤ 0.10): a qualitative understanding in light of possible magnetic phase separation, J. Magn. Magn. Mater., 2004, 279, 41 CrossRef.
- R. Ganguly, I. K. Gopalakrishnan and J. V. Yakhmi, Magnetic and electrical properties of La0. 67Ca0. 33MnO3 as influenced by substitution of Cr, Physica B, 2000, 275, 308 CrossRef CAS.
- T. Barbier, C. Autret-Lambert, C. Honstrette, F. Gervais and M. Lethiecq, Dielectric properties of hexagonal perovskite ceramics prepared by different routes, Mater. Res. Bull., 2012, 47, 4427 CrossRef CAS.
- G. Venkataiah, D. C. Krishna, M. Vithal, S. S. Rao, S. V. Bhat, V. Prasad, S. V. Subramanyam and P. Venugopal Reddy, Effect of sintering temperature on electrical transport properties of La0.67Ca0.33MnO3, Physica B, 2005, 357, 370 CrossRef CAS.
- P. G. Li, M. Lei, H. L. Tang, Y. F. Guo and W. H. Tang, Magnetic and electrical transport properties of nanostructured La0.67Ca0.33MnO3 networks, J. Alloys Compd., 2008, 460, 60 CrossRef CAS.
- A. Selmi, A. Bettaibi, H. Rahmouni, R. M'nassri, N. C. Boudjada, A. Chiekhrouhou and K. Khirouni, Physical properties of 20% Cr-doped Pr0.7Ca0.3MnO3 perovskite, Ceram. Int., 2015, 41(9), 11221–11227 CrossRef CAS.
- H. B. Khlifa, R. M'nassri, W. Cheikhrouhou-Koubaa, G. Schmerber, C. Leuvrey, C. Ulhaq-Bouillet, A. Dinia and A. Cheikhrouhou, Structural characterization and magnetic field dependence of the magnetocaloric properties in Pr0.8Na0.05K0.15MnO3 ceramic, J. Magn. Magn. Mater., 2017, 439, 148–155 CrossRef.
- A. Sakka, R. M'nassri, S. Tarhouni, W. Cheikhrouhou-Koubaa, N. Chniba-Boudjada, M. Oumezzine and A. Cheikhrouhou, Impact of synthesis routes on normal and inverse magnetocaloric effects and critical behaviour in the charge-ordered Pr0.5Sr0.5MnO3 manganite, Eur. Phys. J. Plus, 2019, 134(5), 216 CrossRef.
- E. Vladimirova, V. Vassiliev and A. Nossov, Synthesis of La1−xPbxMnO3 colossal magnetoresistive ceramics from co-precipitated oxalate precursors, J. Mater. Sci., 2001, 36, 1481–1486 CrossRef CAS.
- S. T. Aruna, M. Muthuraman and K. C. Patil, Combustion synthesis and properties of strontium substituted lanthanum manganites La1−xSrxMnO3 (0 ≤ x ≤ 0.3), J. Mater. Chem., 1997, 7, 2499–2503 RSC.
- J. Liu, H. Wang, M. Zhu, B. Wang and H. Yan, Synthesis of La0.5A0.5MnO3 (A= Sr, Ba) by a hydrothermal method at low temperature, Mater. Res. Bull., 2003, 38, 817–822 CrossRef CAS.
- G. Dezanneau, A. Sin, H. Roussel, H. Vincent and M. Audier, Synthesis and characterisation of La1−xMnO3±δ nanopowders prepared by acrylamide polymerisation, Solid State Commun., 2002, 121, 133–137 CrossRef CAS.
- Z. Jir'ak, J. Hejtmanek, K. Knızek, M. Marysko, E. Pollert, M. Dlouha, S. Vratislav, R. Kuzel and M. Hervieu, Structure and magnetism in the Pr1−xNaxMnO3 perovskites (0 ≤ x ≤ 0.2), J. Magn. Magn. Mater., 2002, 250, 275–287 CrossRef.
- Z. Jir'ak, J. Hejtmanek, K. Knızek, M. Marysko, E. Pollert, M. Dlouha, S. Vratislav, R. Kuzel and M. Hervieu, Structure and magnetism in the Pr1−xNaxMnO3 perovskites (0 ≤ x ≤ 0.2), J. Magn. Magn. Mater., 2002, 250, 275–287 CrossRef.
- S. C. Maatar, R. M'nassri, W. C. Koubaa, M. Koubaa and A. Cheikhrouhou, Structural, magnetic and magnetocaloric properties of La0.8Ca0.2−xNaxMnO3 manganites (0 ≤ x ≤ 0.2), J. Solid State Chem., 2015, 225, 83–88 CrossRef.
- S. Roy, Y. Q. Guo, S. Venkatesh and N. Ali, J. Phys.: Condens. Matter, 2001, 13, 9547 CrossRef CAS.
- G. H. Rao, J. R. Sun, K. Barner and N. Hamad, J. Phys.: Condens. Matter, 1999, 11, 1523 CrossRef CAS.
- Z. Q. Li, H. Liu, X. J. Liu, X. D. Liu, H. L. Bai, C. Q. Sun and E. Y. Jiang, J. Magn. Magn. Mater., 2004, 284, 133–139 CrossRef CAS.
- S. Das and T. K. Dey, Structural and magnetocaloric properties of La1−yNayMnO3 compounds prepared by microwave processing, J. Phys. D: Appl. Phys., 2007, 40, 1855–1863 CrossRef CAS.
- S. C. Maatar, R. M'nassri, W. C. Koubaa, M. Koubaa and A. Cheikhrouhou, Structural, magnetic and magnetocaloric properties of La0.8Ca0.2− xNaxMnO3 manganites (0 ≤ x ≤ 0.2), J. Solid State Chem., 2015, 225, 83–88 CrossRef.
- R. Thaljaoui, W. Boujelben, M. Pękała, D. Pociecha, J. Szydłowska and A. Cheikhrouhou, Room temperature magnetocaloric and magneto-transport properties of monovalent doped Pr0.6Sr0.35Na0.05MnO3 manganite, J. Alloys Compd., 2012, 530, 138–143 CrossRef CAS.
- S. Choura-Maatar, R. M'nassri, W. Cheikhrouhou-Koubaa, M. Koubaa, N. Chniba-boudjada and A. Cheikhrouhou, Role of lanthanum vacancy on the structural, magnetic and magnetocaloric properties in the lacunar perovskite manganites La 0.8− x□ x Na0.2 MnO3 (0 ≤ x ≤ 0.15), RSC Adv., 7(79), 50347–50357 RSC.
- T. Roisnel and J. Rodriguez-Carvajal, WinPLOTR: a windows tool for powder diffraction patterns analysis, Mater. Sci. Forum, 2001, 378–381, 118–123 CAS.
- J. Rodriguez-Carvajal, Recent advances in magnetic structure determination by neutron powder diffraction, Physica B, 1993, 192, 55–69 CrossRef CAS.
- J. Hejtmánek, Z. Jirák, J. Šebek, A. Strejc and M. Hervieu, Magnetic phase diagram of the charge ordered manganite Pr0.8Na0.2MnO3, J. Appl. Phys., 2001, 89, 7413 CrossRef.
- S. Das and T. K. Dey, Structural and magnetocaloric properties of La1−yNayMnO3 compounds prepared by microwave processing, J. Phys. D: Appl. Phys., 2007, 40, 1855 CrossRef CAS.
- S. W. Ng, K. P. Lim, S. A. Halim, H. Jumiah, A. H. M. Gan, H. W. Chin and K. H. Cheong, Effect of Sintering on Structural and Transport Properties on Nanosized Pr0.85Na0.15MnO3, Adv. Mat. Res., 2015, 1107, 272–277 Search PubMed.
- M. R. Lees, J. Barratt, G. Balakrishnan, D. Mc K. Paul and M. Yethiraj, Phys. Rev. B: Condens. Matter Mater. Phys., 1995, 52, R14303 CrossRef CAS.
- J. Hejtmanek, Z. Jirák, J. Sebek, A. Strejc and M. Hervieu, Magnetic phase diagram of the charge ordered manganite Pr0.8Na0.2MnO3, J. Appl. Phys., 2001, 89, 7413 CrossRef CAS.
- F. Millange, S. de Brion and G. Chouteau, Phys. Rev. B: Condens. Matter Mater. Phys., 2000, 62, 5619 CrossRef CAS.
- T. Vogt, A. K. Cheetham, R. Mahendiran, A. K. Ray-chaudhuri, R. Mahesh and C. N. R. Rao, Phys. Rev. B: Condens. Matter Mater. Phys., 1996, 54, 15303 CrossRef CAS.
- Z. Zeng, M. Greenblatt and M. Croft, Phys. Rev. B: Condens. Matter Mater. Phys., 2001, 63, 224410 CrossRef.
- S. Mahjoub, R. M'nassri, M. Baazaoui, E. K. Hlil and M. Oumezzine, Tuning magnetic and magnetocaloric properties around room temperature via chromium substitution in La0.65Nd0.05Ba0.3MnO3 system, J. Magn. Magn. Mater., 481, 29–38 CrossRef CAS.
- B. C. Zhao, Y. Q. Ma, W. H. Song and Y. P. Sun, Phys. Lett. A, 2006, 354, 472–476 CrossRef CAS.
- H. E. Sekrafi, A. Ben Jazia Kharrat, M. A. Wederni, K. Khirouni, N. Chniba-Boudjada and W. Boujelben, Mater. Res. Bull., 2019, 111, 329–337 CrossRef CAS.
- H. Rahmouni, A. Benali, B. Cherif, E. Dhahri, M. Boukhobza, K. Khirouni and M. Sajieddine, Physica B, 2015, 466–467, 31–37 CrossRef CAS.
- N. F. Mott and E. A. Davis, Electronic Process in Non Crystalline Materials, Clarendon Press, Oxford, 1979 Search PubMed.
- Z. Mohamed, N. Ibrahim, M. A. Ghani, S. D. Safian and S. N. Mohamed, Results Phys., 2019, 12, 861–866 CrossRef.
- A. M. Ahmed, Physica B, 2004, 352, 330–336 CrossRef CAS.
- C. C. Wang and L. W. Zhang, Polaron relaxation related to localized charge carriers in Pr1xCaxMnO3, New J. Phys., 2007, 9, 210 CrossRef.
- H. Gencer, M. Pektas, Y. Babur, V. S. Kolat and T. Izgi, Electrical Transport and Magnetoresistance of La0.67Ca0.33MnO3: Ag x(x = 0, 0.1, 0.2, 0.3, 0.4) Composites, J. Magn., 2012, 17, 184 Search PubMed.
- J. Suchanicz, The low-frequency dielectric relaxation Na0.5Bi0.5TiO3 ceramics, Mater. Sci. Eng., B, 1998, 55, 114 CrossRef.
- J. Hu and H. Qin, Giant magnetoimpedance effect in La0.7Ca0.3MnO3 under low magnetic fields, J. Magn. Magn. Mater., 2001, 231(1), 1–3 CrossRef.
- M. Nadeem, M. J. Akthar and M. N. Haque, Increase of grain boundary resistance with time by impedance spectroscopy in La0.50Ca0.50MnO3+δ at 77 K, Solid State Commun., 2008, 145, 263 CrossRef CAS.
- M. Shah, M. Nadeem, M. Idrees, M. Atif and M. J. Akhtar, Change of conduction mechanism in the impedance of grain boundaries in Pr0.4Ca0.6MnO3, J. Magn. Magn. Mater., 2013, 332, 61 CrossRef CAS.
- P. S. Anantha and K. Haritharan, Structure and ionic transport studies of sodium borophosphate glassy system, Mater. Chem. Phys., 2005, 89, 428 CrossRef CAS.
- D. K. Pradhan, B. K. Samanthary, R. N. P. Choudhary and A. K. Thakur, Complex impedance studies on a layered perovskite ceramic oxide—NaNdTiO4, Mater. Sci. Eng., B, 2005, 116, 7 CrossRef.
- J. Plocharski and W. Wieczorek, Impedance spectroscopy and phase structure of PEO-NaI complexes, Solid State Ionics, 1988, 979, 28 Search PubMed.
- S. A. Hashmi, A. K. Thakur and H. M. Upadhaya, Experimental studies on polyethylene oxide–NaClO4 based composite polymer electrolytes dispersed with Na2SiO3, Eur. Polym. J., 1998, 34, 1277 CrossRef CAS.
- H. Rahmouni, M. Smari, B. Cherif, E. Dhahri and K. Khirouni, Dalton Trans., 2015, 44, 10457 RSC.
|
| This journal is © The Royal Society of Chemistry 2019 |
Click here to see how this site uses Cookies. View our privacy policy here. 
 Open Access Article
 This Open Access Article is licensed under a Creative Commons Attribution-Non Commercial 3.0 Unported Licence
 b,
R. M'nassri
b,
R. M'nassri