
 Open Access Article
 This Open Access Article is licensed under a Creative Commons Attribution-Non Commercial 3.0 Unported Licence
Distribution, contents and health risk assessment of heavy metal(loid)s in fish from different water bodies in Northeast China
XiaoLi Huangab,
DongLi Qin b,
Lei Gaob,
Qirui Haob,
Zhongxiang Chenb,
Peng Wangb,
Shizhan Tangb,
Song Wub,
Haifeng Jiangb and
Wei Qiu*ac
b,
Lei Gaob,
Qirui Haob,
Zhongxiang Chenb,
Peng Wangb,
Shizhan Tangb,
Song Wub,
Haifeng Jiangb and
Wei Qiu*ac
aState Key Laboratory of Urban Water Resource and Environment, Harbin Institute of Technology, 150090, Harbin, Heilongjiang, China. E-mail: qiuweihit@126.com
bHeilongjiang River Fisheries Research Institute, Chinese Academy of Fishery Sciences, 150070, Harbin, Heilongjiang, China
cSchool of Municipal & Environmental Engineering, Harbin Institute of Technology, 150090, Harbin, Heilongjiang, China
First published on 16th October 2019
Abstract
This study aimed at investigating the accumulation and potential risks of eight metal(loid)s in fish from natural and culturing water samples in Northeast China. Chromium (Cr), nickel (Ni), copper (Cu), zinc (Zn), arsenic (As), cadmium (Cd), lead (Pb) and mercury (Hg) contents in 16 fish species (155 samples) and sediments of their habitats were analyzed. In general, the concentrations of these eight metal(loid)s in most fish samples are lower than the guideline levels and legal limits, and the Pb and Hg level in 0.65% of samples were exceeded the quality standards in China. The Cr, As, Cd and Pb levels in most fish samples are less than those reported in previous studies. Nonetheless, Hg levels in these fish samples are significantly higher than those reported in previous studies conducted in other regions. Different from the wild fish, significant positive correlations are found between Cr, Ni, As and Cd concentrations in cultured fish and those in pond sediment (P < 0.05), which might be due to the closed static water environment and concentrated feeding operations. Cu, Zn, As and Hg concentrations differed significantly among wild species, while Cu and Zn concentrations differed significantly among cultured species (P < 0.05), which might be because of the different feeding and foraging habitats. The target hazard quotients (THQs) at high exposure levels of target metal(loid)s in the studied fish were below 1 (except for Hg), and the carcinogenic risk indices of Cr, As, and Cd were less than 10−4. The levels of metal(loid)s (except for Hg) in the studied fishes fell within an acceptable range, but more attention should be paid to the potential carcinogenic risks.
1 Introduction
Increasing human activities have caused the increasing release of heavy metals into the hydrosphere.1,2 This is especially the case for the surface water, which turns into a sink for heavy metals from the wastes (e.g., emission, wastewater and waste solids). Studies have found high levels of heavy metals being released into freshwater ecosystems because of the effects of urbanization and industrialization.3 Some rivers and lakes have encountered different levels of ecological risks due to heavy metal pollution.4–7 Fishes exposed to elevated metal levels can absorb the bioavailable metals (e.g., cadmium (Cd), nickel (Ni), lead (Pb), and mercury (Hg)) directly from an aquatic environment8 and regulate metal concentrations where bioaccumulation will occur in tissues to some extent.9 Researchers have found evidence that supports the biomagnification of some heavy metals (e.g., chromium (Cr), copper (Cu), arsenic (As), Cd, Pb and Hg) with trophic levels in marine and freshwater ecosystems.10–14 Bioaccumulation and biomagnification can cause heavy metal burdens in the muscle tissues of fish to increase.8,15 Excessive levels of heavy metals could harm aquatic organisms, causing the escalation of heavy metal levels in fish tissues to dangerous levels.16 The consumption of polluted fish could potentially result in serious food poisoning among the general public.In general, heavy metal levels in a fish are related to its living environment, feeding behavior and foraging habitats.17,18 There are numerous studies on the relationship between heavy metal pollution in the environment and in fish. For instance, sediment acts as an important sink for heavy metals, which affects the heavy metal bioconcentration by affecting bioavailability.19 Because of the biogeochemical characteristics and pathways of trophic transfer, the metal burdens in food web components are different, which lead to the difference in individual fish taxa by functional feeding groups.20,21 Previous studies have suggested that the foraging habitat is a strong predictor for variations in heavy metal concentrations in fish.21 While heavy metal contamination of freshwater and marine biota in China has been well described,10,12,17,18,22 such investigations are rather limited in Northeast China. Some heavy metals (i.e., As, Cd, Pb and Hg) are of major environmental concern as they can cause severe health implications for humans and other living organisms. Moreover, some elements (e.g., Cr, Ni, Cu and zinc (Zn)) that play essential roles in life activities become toxic in excess amounts.
Northeast China is a water-rich area with satisfactory water resource conditions and long fishing history, especially the Amur River basin, which contains a rich freshwater ecosystem with various fish species from the frigid-zone, temperate zone and even the tropical zone. In Northeast China, aquatic environments such as rivers, lakes, artificial reservoirs and ponds provide all types of aquaculture. However, many major cities and chemical enterprises in Northeast China are located near rivers and lakes, where the released waste threatens these aquatic ecosystems. Recently, two serious environmental contamination accidents have occurred in the Songhua River, which is the third-largest river in China and one of the biggest tributaries of the Amur River.23,24 Studies have found elevated heavy metal concentrations in the water and sediment in some rivers and lakes in Northeast China.25–27 Studies have been conducted to investigate the trace elements in the tissues of fish from fish farms28 and individual rivers or areas in Northeast China.29 Nonetheless, little is known about the heavy metal levels in fish from Northeast China, particularly for various species with different feeding habits, and the relationship between heavy metals and the environment.
This study aims to develop a large-scale analysis to compare eight metal(loid) levels (including Cr, Ni, Cu, Zn, As, Cd, Pb and Hg) in fish from different water types in Northeast China, investigate the relationship between heavy metals and the environment as well as evaluate the potential health risks associated with fish consumption.
2 Materials and methods
2.1 Study area and sample collection
In the period from May to September of 2015, a total of 155 fish samples representing 16 species were randomly collected from various fishery areas, including the trunk stream of Amur River (Amur R.), Songhua River (Songhua R.), Ussuri River (Ussuri R.), Second Songhua River (SSonghua R.) and Nen River (Nen R.), Chagan Lake (CGL), Songhua Lake (SHL), Xingkai Lake (XKL), Jingpo Lake (JPL) and some ponds at city sites (Harbin, Jiamusi, Zhaodong, Changchun, Jilin and Songyuan) (Fig. 1). Sediment samples were also collected from the same localities. Basic biological information on the sampled fish, e.g., species, number, feeding habits, age, total length and body weights, are displayed in Table 1. The dorsal muscle tissues of fish samples were taken and homogenized. Fish samples were put into a clean polythene bag and immediately stored at −20 °C before the subsequent heavy metal analysis. A total of 235 sediment samples were extracted from the upper layer (0–10 cm) of the sampling sites (five sampling sites in each sampling area) using polyvinyl chloride corers. The sediment samples were immediately mixed and 2.0 kg were reserved in a hermetic bag and stored at 4 °C before arriving at the laboratory.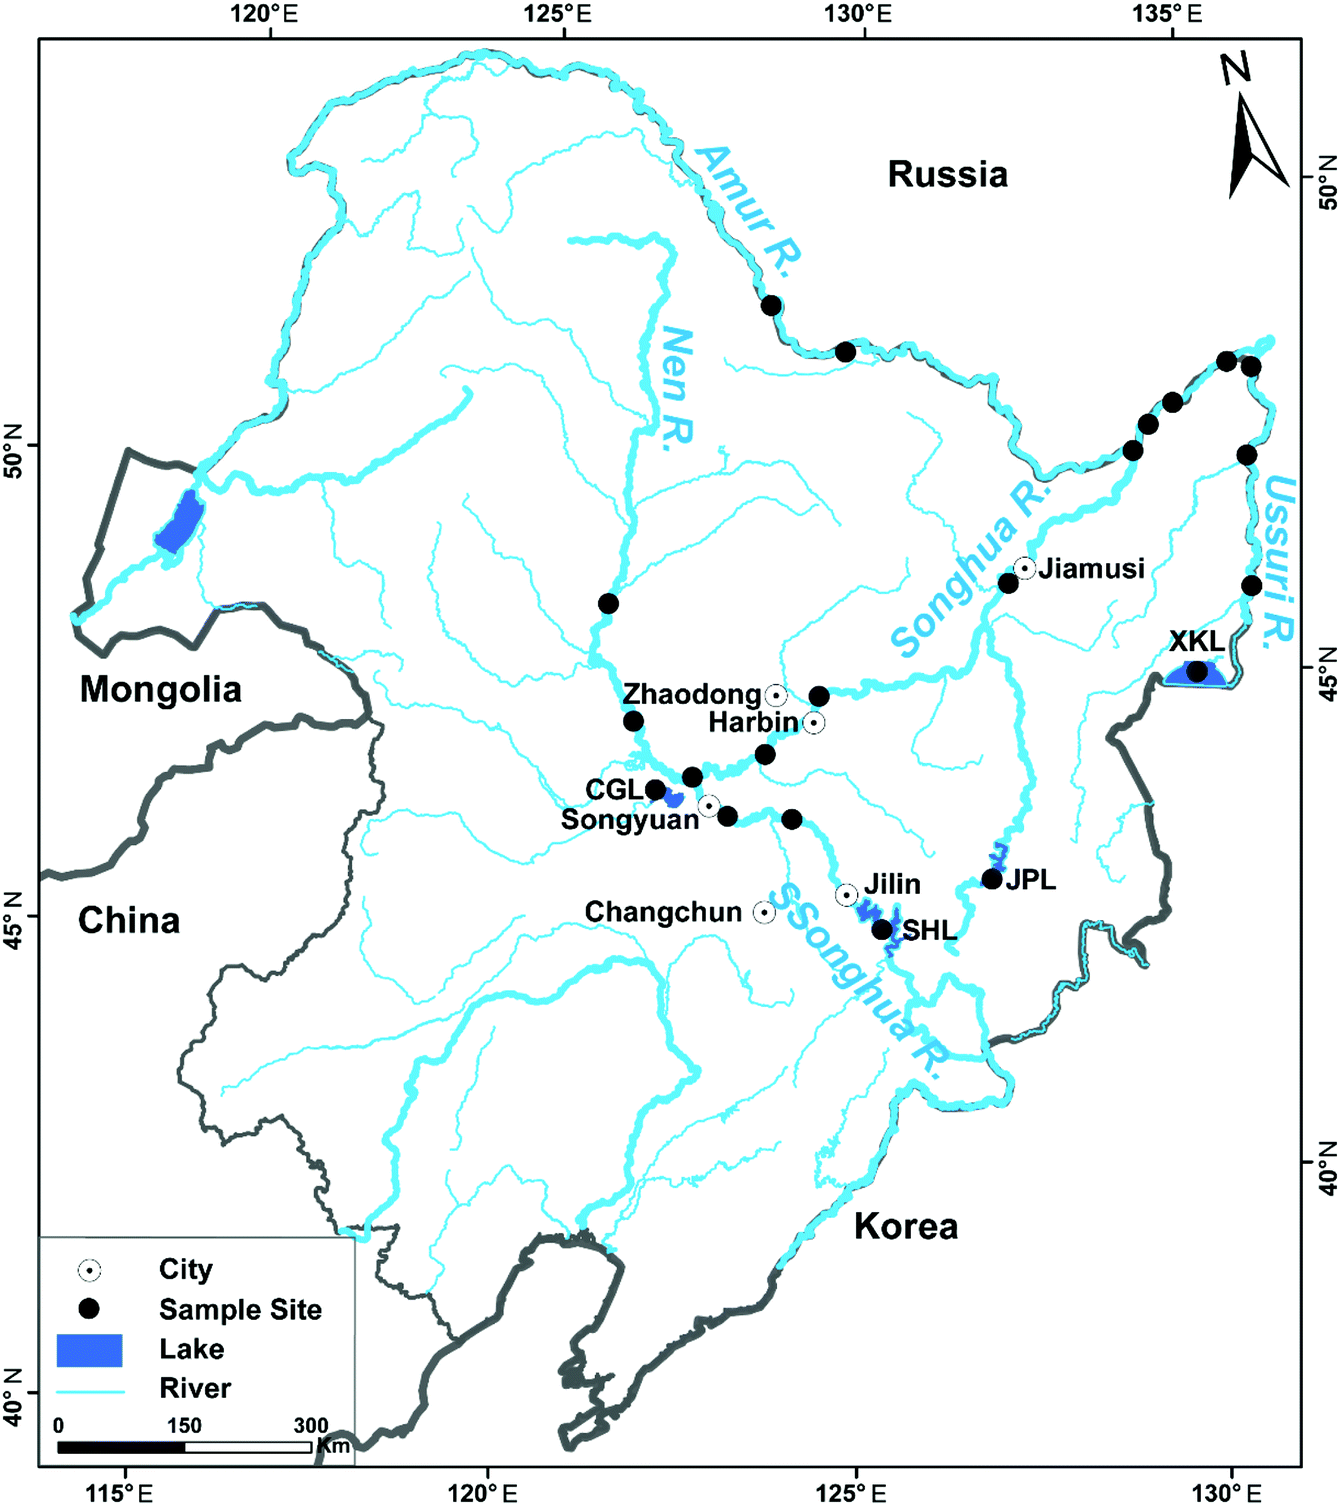 | ||
| Fig. 1 Fish sampling locations in the study area. | ||
| Scientific name | English name | n | Feeding habits | Foraging habitats | The total length (cm) | Body weights (kg) |
|---|---|---|---|---|---|---|
| a n means the number of samples. | ||||||
| Hypomesus olidus | Pond smelt | 1 | Omnivory | Pelagic fishes | 10.20 | 0.0085 |
| Esox reicherti | Amur pike | 6 | Sarcophagy | Pelagic fishes | 50.60 ± 2.40 (47.00–55.00) | 0.64 ± 0.14 (0.52–0.91) |
| Leuciscus waleckii | Amur ide | 3 | Omnivory | Pelagic fishes | 23.90 ± 3.60 (19.00–29.00) | 0.14 ± 0.093 (0.035–0.28) |
| Ctenopharyngodon idellus | Grass carp | 19 | Herbivority | Middle-lower layers fishes | 53.00 ± 11.20 (38.00–72.00) | 1.93 ± 1.14 (0.71–4.23) |
| Hemibarbus labeo | Barbell steed | 2 | Omnivory | Bottom fishes | 26.00 ± 4.90 (22.50–29.50) | 0.16 ± 0.09 (0.095–0.23) |
| Hemibarbus maculatus | Spotted steed | 1 | Omnivory | Middle-lower layers fishes | 28.00 | 0.22 |
| Saurogobio dabryi | Chinese lizard gudgeon | 1 | Omnivory | Middle-lower layers fishes | 13.70 | 0.031 |
| Erythroculter ilishaeformis | Topmouth culter | 7 | Sarcophagy | Pelagic fishes | 54.90 ± 8.50 (42.00–69.00) | 1.23 ± 0.46 (0.71–2.06) |
| Erythroculter mongolicus | Mongolian redfin | 1 | Sarcophagy | Pelagic fishes | 24.50 | 0.22 |
| Cyprinus carpio | Common carp | 39 | Omnivory | Bottom fishes | 42.80 ± 7.40 (29.00–61.00) | 1.29 ± 0.87 (0.32–4.40) |
| Carassius auratus | Crucian carp | 36 | Omnivory | Bottom fishes | 21.80 ± 5.50 (8.80–29.00) | 0.22 ± 0.14 (0.019–0.47) |
| Hypophthalmichthys molitrix | Silver carp | 11 | Filter feeder (zooplankton, phytoplankton) | Pelagic fishes | 47.30 ± 11.90 (26.00–61.00) | 1.22 ± 0.86 (0.15–3.65) |
| Aristichthys nobilis | Bighead carp | 12 | Filter feeder (zooplankton, phytoplankton) | Pelagic fishes | 51.20 ± 9.40 (33.00–64.00) | 2.16 ± 1.13 (0.45–4.19) |
| Pseudobagrus fulvidraco | Yellow catfish | 2 | Omnivory | Bottom fishes | 15.10 ± 3.40 (12.70–17.50) | 32.0 ± 2.83 (30.0–34.0) |
| Parasilurus asotus | Sheatfish | 13 | Sarcophagy | Bottom fishes | 37.00 ± 9.40 (25.00–50.00) | 0.41 ± 0.36 (0.10–1.38) |
| Protosalanx hyalocranius | Clearhead icefish | 1 | Sarcophagy | Pelagic fishes | 14.50 | 0.025 |
2.2 Analysis of metal(loid)s
In a report by Qin et al.,28 target metal(loid)s except Hg were determined using an inductively-coupled plasma mass spectrometer (ICP-MS, Agilent 7500cx, USA) equipped with an octopole reaction system (ORS). For fish muscle (epaxial muscle on the dorsal surface without skin and backbone) analysis, each 1.0 g of the homogenized sample was digested and mixed using an automatic microwave system with a mixture of HNO3![[thin space (1/6-em)]](https://www.rsc.org/images/entities/char_2009.gif) :H2O2:Milli-Q water = 5:2:1. After cooling, the sample was diluted with Milli-Q water (Milli-Pore Co., USA; resistivity, 18.2 MΩ cm), stored at 4 °C temperature, and analyzed within 24 h. For sediment samples, each 0.1 g of dried and powdered sediment sample was digested with mixed acids (HClO4:HF:HCl = 1:5:1) in an automatic microwave digestion system. After cooling, the sample was distilled to dryness and diluted with Milli-Q water. For analysis of the Hg content, an Automatic Mercury Analyzer Hydra IIC (Teledyne Leeman Labs Hudson, NH, USA) was used.
:H2O2:Milli-Q water = 5:2:1. After cooling, the sample was diluted with Milli-Q water (Milli-Pore Co., USA; resistivity, 18.2 MΩ cm), stored at 4 °C temperature, and analyzed within 24 h. For sediment samples, each 0.1 g of dried and powdered sediment sample was digested with mixed acids (HClO4:HF:HCl = 1:5:1) in an automatic microwave digestion system. After cooling, the sample was distilled to dryness and diluted with Milli-Q water. For analysis of the Hg content, an Automatic Mercury Analyzer Hydra IIC (Teledyne Leeman Labs Hudson, NH, USA) was used.
2.3 QA/QC
Nitric acid, peroxide hydrogen and hydrochloric acid utilized in this study were all guaranteed reagents. Glassware used in this study were all immersed in 10% (V/V) of nitric acid overnight, washed three times with Milli-Q water, and then dried in an oven. The certified reference solution ICP Standards of Cr, Ni, Cu, Zn, As, Cd and Pb (1000 μg mL−1) were all purchased from the National Analysis and Testing Center for Nonferrous Metals & Electronic Materials. Yellow croaker (GBW08573), GSS-3 (GBW-07403) and GSS-5 (GBW-07405) were utilized as processing Certified Reference Materials for analysis validation. The results were in good agreement with the certified values and recoveries ranged from 86.5% to 104.3%. Analytical blanks were prepared in parallel in the same way as the samples for evaluating the possibility of pollution and background interference. For fish samples, the limits of detection (LOD, mg kg−1 wet weight) were the following: Cr 0.005, Ni 0.010, Cu 0.008, Zn 0.015, As 0.003, Cd 0.001, Pb 0.005, and Hg 0.001. For sediment samples, the limits of detection (LOD, mg kg−1 wet weight) were the following: Cr 0.180, Ni 0.100, Cu 0.100, Zn 0.700, As 0.190, Cd 0.003, Pb 0.040, and Hg 0.001.2.4 Risk assessment
where FIR is the food ingestion rate of fish and fish products (g per person per day, wet weight), Ci is the average concentration of a single heavy metal in a fish muscle (mg kg−1), and BW is the average body weight of an adult.30 For adults in rural and urban areas of China, the food ingestion rate of fish was 23.7 g per person per day.31 The average body weight of an adult is 60 kg. If the element concentration was lower than the limit of detection (LOD), the value would be taken as half of the respective detection limits (½ LOD).


When the THQ value is less than one, there should be no obvious non-carcinogenic risks for the exposed population. Otherwise, the exposed population would experience adverse health risks. Such concerns would further increase with a higher THQ value.
where EF is the exposure frequency (365 d per year), ED is the exposure duration (70 year), TA is the averaging time (365 × ED d), and SFi is the oral slope factor ((mg kg−1 d−1)−1) for a single heavy metal. The oral intake of carcinogenic slope factors for Cr, As, and Cd are 0.50, 0.38 and 1.50, respectively. When the CRI value is less than 10−6, the compound is safe for humans. When the CRI value is between 10−6 and 10−4, there are potential carcinogenic risks to the exposed population. When the CRI value is more than 10−4, the exposed people would encounter excess carcinogenic risk.

2.5 Statistical analysis
Statistical analysis was performed using the SPSS software (IBM SPSS statistics for Windows, version 20.0; SPSS Inc., Chicago, IL). The Mann–Whitney test was performed to compare the metal(loid)s concentration in fish samples captured from natural waters and that from aquaculture ponds. Metal(loid) concentrations in fish and sediment samples were log(x) transformed and their relationships were expressed using the Pearson correlation test. The linear regression analyses were performed to compare the relationships between metal(loid)s concentration in fish and sediment samples. One-way ANOVA followed by the Dunn's test was performed to determine whether differences in metal(loid) concentrations in different fish species were significant. The statistical significance level was acceptable at p < 0.05. All sample values were expressed as mg kg−1 wet weight.3 Results and discussion
3.1 Levels of eight metal(loid)s in fish muscles
The levels of eight metal(loid)s (wet weight) in fish muscles are shown in Table 2. The essential elements (Cu and Zn) are found in all the samples, while the elements that are essential but toxic in excess amounts (Cr and Ni) and the detection rates of toxic elements (As, Cd, Pb and Hg) are 33.55%, 19.35%, 97.42%, 48.39%, 70.97% and 74.19%, respectively. The metal concentration of Zn is the highest (7.97 ± 6.05 mg kg−1), followed by Cu (0.27 ± 0.13 mg kg−1), Hg (0.079 ± 0.14 mg kg−1), As (0.052 ± 0.054 mg kg−1) and Pb (0.034 ± 0.074 mg kg−1). In contrast, other heavy metals (Cr, Ni and Cd) are of minor importance because of low concentrations (<0.02 mg kg−1). None of the fish samples have Cr, Cu and Cd levels above the guideline levels and legal limits shown in Table 2.30,34–37 The concentrations of As, Pb and Hg are in the range of ND–0.39 mg kg−1, ND–0.70 mg kg−1 and ND–0.82 mg kg−1, respectively. Total As levels in some of the fish muscle samples exceed the inorganic arsenic criterion quality standard in China34 of 0.10 mg kg−1 and overall, 10.97% (17 fish muscle samples) were above the criterion. According to the hypothesis, inorganic arsenic levels could be estimated using a value of 10% of total As. The estimated concentration of inorganic arsenic for the 17 fish muscle samples are all below the criterion of 0.10 mg kg−1. Nonetheless, the Pb level of one fish muscle sample exceeds the maximum levels set by the quality standard in China and DHO action levels (of 0.50 mg kg−1 wet weight); and 1.94% (3 samples) and 2.58% (4 samples) of the samples are above the Commission Regulation (EC) (0.30 mg kg−1) FAO guidelines (0.20 mg kg−1), respectively.30,36 Total Hg levels in 2.58% (4 samples) of the samples were greater than 0.50 mg kg−1, but only one sample was above the methylmercury criterion set by the quality standard in China because of the maximum level for predatory fish (1.0 mg kg−1). Based on the assumption that 75% of total mercury in fish was methylmercury,38 the estimated methylmercury value of the Hg-excess sample still exceeded the criterion of 0.50 mg kg−1.| Heavy metals | Min. | Max. | Mean | Standard deviation | Median | Detection rate (%) | Maximum levels (MLs) for heavy metals in fish | Over-limit ratiob (%) | |||
|---|---|---|---|---|---|---|---|---|---|---|---|
| Quality standard in China | Commission regulation (EC) | FAO | DHO | ||||||||
| a n means the number of muscle samples.b According to the quality standard in China.c ND: Not detected, means the value is lower than the limit of detection. Concentrations less than the LOD were set to ½ LOD for statistical analysis.d GB 2762-2017 National Food Safety Standard Maximum Levels of Pollutants in Foods (in Chinese).34 The maximum level for predatory fish is 1.00 mg kg−1, but for all other fish it is 0.50 mg kg−1.e NY 5073-2006 Limited Quantity of Poisonous and Harmful Contents of the National Pollution-Free Aquatic Products (in Chinese).35f The maximum level for predatory fish including swordfish is 1.00 mg kg−1 but for all other fish and processed fish, it is 0.50 mg kg−1. | |||||||||||
| Cr | NDc | 0.49 | 0.018 | 0.048 | 0.019 | 33.55 | 2.00d | 0 | |||
| Ni | ND | 0.78 | 0.019 | 0.069 | 0.039 | 19.35 | |||||
| Cu | 0.067 | 0.97 | 0.27 | 0.13 | 0.25 | 100.00 | 50e | 30 | 0 | ||
| Zn | 2.49 | 51.38 | 7.97 | 6.05 | 5.94 | 100.00 | 30 | ||||
| As | ND | 0.39 | 0.052 | 0.054 | 0.039 | 97.42 | 0.10d | 3.00 | 10.97 | ||
| Cd | ND | 0.009 | 0.0012 | 0.0013 | 0.0010 | 48.39 | 0.10d | 0.05 | 0.05 | 1.00 | 0 |
| Pb | ND | 0.70 | 0.034 | 0.074 | 0.024 | 70.97 | 0.50d | 0.30 | 0.20 | 0.50 | 0.65 |
| Hg | ND | 0.82 | 0.079 | 0.14 | 0.057 | 74.19 | 0.50/1.00d | 0.50 | 0.50/1.00f | 0.50/1.00f | 0.65 |
The results presented here are comparable to the studies conducted elsewhere, which also reported Cu and Zn to be the most abundant compounds among detected chemical elements (Table 3).17,18,39–41 The concentrations of Cr, As, Cd and Pb in most of the samples are either less than previous studies10,11,22,39,40,42 or undetected. Hg concentrations of fish in this study are higher than those from the Yellow River Estuary,10 South China Sea,12 East China Sea43 and Yangtze River,44 confirming heavy metal pollution in the waters of Northeast China.
| Location | Number of fish species | Cr | Ni | Cu | Zn | As | Cd | Pb | Hg | References |
|---|---|---|---|---|---|---|---|---|---|---|
| a Wet weight.b Dry weight.c ND means not detected. | ||||||||||
| Northeast of Chinaa | 16 | NDc–0.49 | ND–0.78 | 0.067–0.97 | 2.49–51.38 | ND–0.39 | ND–0.009 | ND–0.70 | ND–0.82 | Present study |
| Bangshi River (Bangladesh)b | 0.47–2.07 | 8.33–43.18 | 42.83–418 | 1.97–6.24 | 0.09–0.87 | 1.76–10.27 | 39 | |||
| Yangtze River (China)a | 0.10–0.24 | 0.77–1.22 | 2.8–7.55 | NA | 0.046–0.12 | 0.21–0.81 | 18 | |||
| Pearl River (China)a | 13 | 0.11–4.27 | 0.15–7.55 | 8.78–30.3 | NA | 0.01–0.13 | 0.09–30.70 | 40 | ||
| Nam Co Lake, Yamdro Lake and Lhasa River (China)a | 7 | 0.094–0.22 | 0.33–2.0 | 2.5–6.9 | 0.067–0.27 | 0.013–0.029 | 0.024–0.079 | 41 | ||
| Taihu Lake (China)a | 1 | 0.12–0.50 | 0.39–1.47 | 0.02–0.11 | 0.35–1.20 | 17 | ||||
| Yellow River Estuary (China)a | 11 | 0.01–0.87 | 0.01–0.22 | 10 | ||||||
| Pearl River Delta (China/Hong Kong)a | 11 | 0.20–0.65 | 0.79–2.26 | 15.20–29.50 | 0.03–1.53 | 0.02–0.06 | 0.03–8.62 | 22 | ||
| Hainan coastal area, South China sea (China)a | 1.38–4.36 | 0.07–0.94 | 1.45–8.07 | 0.48–6.99 | ND–0.012 | 0.02–0.05 | 12 | |||
| Western continental shelf of South China Sea | 4 | 0.86–2.89 | 0.48–0.78 | 0.39–2.65 | 11.75–15.59 | 0.027–0.15 | 0.54–2.17 | 11 | ||
| Northeast Mediterranean Sea (Europe)b | 6 | 1.24–2.42 | 2.34–4.41 | 16.5–37.4 | 0.37–0.79 | 2.98–6.12 | 42 | |||
3.2 Effect of environment on the metal(loid) levels in fish
The target metal(loid) concentrations in wild fish from natural waters and cultured fish from aquaculture ponds are compared in Fig. 2. The Mann–Whitney test of the Ni, Cu and Zn concentrations in fish showed little differences between the means of both separate fish samples (α = 0.05). The mean concentrations of Cr in the cultured fish were higher than those in the wild fish and differed significantly among the water types (P = 0.003). The accumulation of As was relatively high (P = 0.017) in wild fish from rivers and lakes as compared to those from ponds. Significantly higher Cd and Hg levels (P < 0.0001) were found in wild fish as compared to those in the cultured fish. The concentration of Pb was much higher (P < 0.0001) in cultured fish than that in wild fish. The detection frequencies of these toxic elements (As, Cd and Hg) in wild fish (97.78%, 61.11% and 92.22%, respectively) were higher than those in cultured fish (96.92%, 32.31% and 49.23, respectively). The detection frequency of Pb in wild fish was lower than that in cultured fish (52.22% and 96.92%, respectively). Among the essential elements (Cr, Ni, Cu and Zn), Cu and Zn were detected in all the samples. However, Cr and Ni detection rates (27.78% and 15.56%) in wild fish were lower than in cultured fish (47.69% and 24.62%). | ||
| Fig. 2 The target metal(loid) concentrations in wild fish from natural waters and cultured fish from aquaculture ponds. | ||
The relationship between metal(loid) concentrations in fish and in their living environment is shown in Fig. 3. The target metal(loid) concentrations in wild fish are not correlated to those in the sediment of their living environment (except for Cd). Cd concentrations in wild fish samples were positively correlated to Cd levels in the sediments of nature water (R2 = 0.081, P = 0.012). Positive correlations were observed between Cr, Ni, As and Cd concentrations in the cultured fish and in pond sediment (R2 = 0.099, R2 = 0.070, R2 = 0.038 and R2 = 0.145, respectively, P < 0.05 for all tests). However, correlations between Cu, Zn, Pt and Hg concentrations in cultured fish and those in pond sediment were relatively weak (R2 = 0.022, R2 = 0.044, R2 = 0.025 and R2 = 0.004, in order, P > 0.05 for all tests).
 | ||
| Fig. 3 The relationship between metal(loid) concentrations in fish and in their living environment. | ||
Metal(loid)s in the fish samples analyzed in this study are closely related to their living environment.10 In the closed static water environment, cultured fish can absorb the essential elements Cr, Ni, Cu and Zn from aquaculture feed, which results in higher levels and detection rates. This may explain why Cr and Ni levels in cultured fish tend to correlate with those in the pond sediment (mainly composed of feed bait, excrement, plankton particles and other suspended matter). Ponds investigated in this study usually use groundwater or clean spring water as the aquaculture water source. Thus, the significant relationship between the As and Cd concentrations in cultured fish and in pond sediment may indicate that As and Cd in cultured fish originate from the aquaculture feed. The potential routes of metal(loid)s entering a fish include food and non-food particle intake, surface absorption by fish tissues (gill, skin and body mucus) and oral consumption of water.8,45
Relative to wild fish, the higher detection rates and levels of Pb in cultured fish are the results of compounded effects from the aquaculture feed and water environment. Metal(loid)s in fish can reflect the water environmental pollution to a certain extent.10,14 The detection frequency of As in cultured fish was similar to that in fish from natural water, while the As concentration was significantly lower than in wild fish, which indicated As-pollution in natural waters. The Songhua River in Northeastern China is one of the representative Hg-polluted rivers in China.23 About 149.8 t of Hg from the Jilin chemical plant had been directly discharged into the Songhua River in 1958–1971. Studies on Hg pollution of fish and sediment in the Songhua River and health concerns of local residents have been uninterrupted over the past 40 years.25,46,47 Recent research showed that the T-Hg pollution level of the Second Songhua River was moderate to severe with high ecological risk, and the pollution levels in the main stream of the Songhua River were mild with low ecological risk.26 As mentioned above, the Hg levels in wild fish in this study are significantly higher than in the cultured fish (P < 0.0001), confirming the high level of Hg pollution and the potential ecological risk of natural waters.
3.3 Effects of different species on the metal(loid) levels in fish
The mean concentrations of eight metal(loid)s for each fish species from Northeast China are displayed in Table 4. Because of the different fish species and environmental factors, the data for wild and cultured fishes were analyzed separately. For the wild fish, because the sample sizes of Ctenopharyngodon idellus (n = 2), Erythroculter mongolicus (n = 1), Saurogobio dabryi (n = 1), Hemibarbus labeo (n = 2), Leuciscus waleckii (n = 3), Pseudobagrus fulvidraco (n = 2) and Hemibarbus maculatus (n = 1) were small, their data were not included in the further analysis for post hoc testing. The levels of Pb, Zn, As and Hg significantly differed among the wild species (P = 0.0067, P < 0.0001, P = 0.001 and P = 0.0005, in order). Significantly higher Cu levels were found in wild Carassius auratus as compared to Esox reicherti and Parasilurus asotus (P < 0.05 for post hoc tests). The level of Zn in wild Carassius auratus was significantly higher than in wild Esox reicherti, Hypophthalmichthys molitrix, Parasilurus asotus and Aristichthys nobilis, and was high in Cyprinus carpio relative to Hypophthalmichthys molitrix (P < 0.05). The toxic elements As and Hg in fish need to be paid more attention. Significantly higher As levels were found in wild Carassius auratus, Hypophthalmichthys molitrix and Cyprinus carpio compared to those in Parasilurus asotus (P < 0.05). Mercury was found to be high in Esox reicherti as compared to that in Carassius auratus, Aristichthys nobilis and Cyprinus carpio (P = 0.007, P = 0.016 and P = 0.006, respectively). For the cultured fish, since the sample sizes of Hypophthalmichthys molitrix (n = 1) and Aristichthys nobilis (n = 3) were small, they were excluded from the post hoc test. Only Cu and Zn significantly differed among the cultured species (P = 0.0005 and P = 0.030, respectively). Much higher Cu levels were found in cultured Carassius auratus and Ctenopharyngodon idellus as compared to those in Cyprinus carpio (P = 0.0016 and P = 0.0046, respectively). Zinc levels were obviously higher in cultured Ctenopharyngodon idellus as compared to that in Cyprinus carpio (P = 0.039).| Scientific name | Cr | Ni | Cu | Zn | As | Cd | Pb | Hg | |
|---|---|---|---|---|---|---|---|---|---|
| a ND means not detected. | |||||||||
| Carassius auratus | Cultured | 0.027 ± 0.043 (ND–0.15) | 0.028 ± 0.050 (ND–0.20) | 0.34 ± 0.20 (0.15–0.97) | 7.93 ± 3.65 (3.83–18.44) | 0.035 ± 0.030 (0.003–0.14) | 0.0008 ± 0.0006 (ND–0.003) | 0.031 ± 0.013 (0.015–0.067) | 0.003 ± 0.005 (ND–0.018) |
| Wild | 0.040 ± 0.12 (ND–0.49) | 0.018 ± 0.030 (ND–0.12) | 0.37 ± 0.15 (0.12–0.55) | 16.59 ± 11.57 (4.94–51.38) | 0.075 ± 0.069 (0.009–0.28) | 0.002 ± 0.002 (ND–0.008) | 0.020 ± 0.021 (ND–0.071) | 0.082–0.085 (0.001–0.26) | |
| Cyprinus carpio | Cultured | 0.026 ± 0.041 (ND–0.13) | 0.008 ± 0.009 (ND–0.035) | 0.20 ± 0.067 (0.12–0.35) | 6.12 ± 2.71 (3.20–13.74) | 0.037 ± 0.034 (ND–0.13) | 0.0008 ± 0.0006 (ND–0.003) | 0.032 ± 0.02 (0.014–0.085) | 0.041 ± 0.18 (ND–0.82) |
| Wild | 0.0072 ± 0.0098 (ND–0.031) | 0.006 ± 0.002 (ND–0.011) | 0.29 ± 0.12 (0.12–0.46) | 12.40 ± 8.44 (4.30–29.74) | 0.049 ± 0.041 (0.01–0.27) | 0.002 ± 0.001 (ND–0.004) | 0.044 ± 0.11 (ND–0.70) | 0.095–0.053 (ND–0.18) | |
| Ctenopharyngodon idellus | Cultured | 0.022 ± 0.037 (ND–0.16) | 0.061 ± 0.19 (ND–0.78) | 0.31 ± 0.095 (0.20–0.50) | 8.77 ± 4.53 (4.53–20.01) | 0.042 ± 0.030 (0.003–0.14) | 0.0006 ± 0.0004 (ND–0.002) | 0.082 ± 0.11 (ND–0.43) | 0.005 ± 0.006 (ND–0.019) |
| Wild | ND | ND | 0.25 ± 0.21 (0.11–0.40) | 9.26 ± 7.26 (4.13–14.39) | 0.074 ± 0.045 (0.042–0.11) | ND | 0.036 ± 0.031 (0.014–0.058) | 0.010 ± 0.013 (ND–0.019) | |
| Esox reicherti | Wild | 0.005 ± 0.005 (ND–0.014) | ND | 0.18 ± 0.11 (0.074–0.39) | 4.50 ± 0.77 (4.61–5.73) | 0.085 ± 0.086 (0.027–0.26) | 0.0013 ± 0.001 (ND–0.003) | 0.004 ± 0.003 (ND–0.01) | 0.37 ± 0.099 (0.27–0.56) |
| Pseudobagrus fulvidraco | Wild | 0.013 ± 0.015 (ND–0.023) | ND | 0.25 ± 0.12 (0.16–0.33) | 7.47 ± 3.43 (5.04–9.89) | 0.013 ± 0.006 (0.008–0.017) | 0.002 ± 0.001 (0.001–0.003) | 0.022 ± 0.002 (0.02–0.023) | 0.080 ± 0.004 (0.077–0.082) |
| Hypophthalmichthys molitrix | Cultured | 0.0025 | 0.005 | 0.46 | 9.78 | 0.02 | 0.0005 | 0.019 | ND |
| Wild | 0.005 ± 0.006 (ND–0.019) | 0.011 ± 0.013 (ND–0.046) | 0.28 ± 0.10 (0.14–0.48) | 4.28 ± 2.22 (2.78–10.33) | 0.072 ± 0.030 (0.029–0.13) | 0.0006 ± 0.0002 (ND–0.001) | 0.015 ± 0.028 (ND–0.079) | 0.11 ± 0.10 (0.005–0.27) | |
| Parasilurus asotus | Wild | 0.016 ± 0.042 (ND–0.15) | 0.015 ± 0.027 (ND–0.10) | 0.20 ± 0.079 (0.086–0.40) | 5.28 ± 1.93 (2.77–10.55) | 0.015 ± 0.018 (ND–0.052) | 0.001 ± 0.001 (ND–0.004) | 0.016 ± 0.012 (ND–0.042) | 0.12 ± 0.11 (ND–0.32) |
| Erythroculter ilishaeformis | Wild | 0.011 ± 0.014 (ND–0.04) | ND | 0.23 ± 0.072 (0.15–0.35) | 5.17 ± 1.01 (3.27–6.08) | 0.034 ± 0.013 (0.018–0.050) | 0.002 ± 0.002 (ND–0.005) | 0.030 ± 0.044 (ND–0.12) | 0.36 ± 0.25 (0.057–0.63) |
| Leuciscus waleckii | Wild | ND | ND | 0.29 ± 0.059 (0.23–0.34) | 5.56 ± 0.73 (4.72–6.05) | 0.072 ± 0.016 (0.062–0.09) | 0.0008 ± 0.0003 (ND–0.001) | 0.004 ± 0.003 (ND–0.008) | 0.057 ± 0.030 (0.023–0.075) |
| Aristichthys nobilis | Cultured | 0.023 ± 0.036 (ND–0.065) | 0.016 ± 0.019 (ND–0038) | 0.24 ± 0.053 (0.18–0.28) | 5.38 ± 2.18 (3.28–7.64) | 0.053 ± 0.030 (0.034–0.087) | 0.0007 ± 0.0003 (ND–0.001) | 0.037 ± 0.18 (0.019–0.054) | ND |
| Wild | 0.004 ± 0.004 (ND–0.015) | 0.028 ± 0.068 (ND–0.21) | 0.22 ± 0.068 (0.13–0.33) | 4.55 ± 1.325 (2.49–6.76) | 0.060 ± 0.048 (ND–0.16) | 0.001 ± 0.001 (ND–0.004) | 0.006 ± 0.007 (ND–0.024) | 0.068 ± 0.049 (ND–0.17) | |
| Hemibarbus labeo | Wild | ND | ND | 0.38 ± 0.26 (0.20–0.56) | 5.65 ± 0.96 (4.97–6.32) | 0.042 ± 0.016 (0.03–0.053) | 0.002 ± 0.0007 (0.001–0.002) | 0.011 ± 0.012 (ND–0.02) | 0.090 ± 0.053 (0.052–0.13) |
| Hypomesus olidus | Wild | ND | ND | 0.26 | 24.01 | 0.39 | 0.007 | ND | 0.008 |
| Protosalanx hyalocranius | Wild | ND | ND | 0.067 | 9.52 | 0.059 | 0.004 | ND | ND |
| Hemibarbus maculatus | Wild | ND | ND | 0.24 | 5.51 | 0.066 | 0.001 | ND | 0.12 |
| Erythroculter mongolicus | Wild | 0.005 | ND | 0.18 | 5.57 | 0.039 | ND | 0.01 | 0.13 |
| Saurogobio dabryi | Wild | ND | ND | 0.25 | 14.56 | 0.050 | 0.009 | 0.007 | 0.065 |
Fish species are one of the most important drivers for metal(loid) accumulation, probably because of different feeding habits and foraging habitats of the studied fish. Dietary habits would affect the concentrations of the toxic elements As and Hg in fish from Northeast China. Relatively high As levels are observed in wild filter-feeding (Hypophthalmichthys molitrix and Aristichthys nobilis) and omnivory (Carassius auratus and Cyprinus carpio) fish, while the wild sarcophagi fish (Parasilurus asotus and Erythroculter ilishaeformis) had lower As concentration. Differences in As levels among wild fish species could be due to trophic transfer in the food web/sources.48 The Hypophthalmichthys molitrix and Aristichthys nobilis were strictly planktivorous and were expected to acquire As from small plankton and zooplankton. Carassius auratus and Cyprinus carpio do not feed exclusively on the small plankton and zooplankton but also feed on benthic animals. Parasilurus asotus and Erythroculter ilishaeformis are carnivorous and feed on small fishes. Chen and Folt20 reported that As could be elevated in lower trophic levels, and lower trophic feeders in the fish feeding strategy experiment would have higher metal burdens (planktivores > omnivores and piscivores). Notably, higher As is found in the muscle of the omnivorous fish, Carassius auratus, which could be due to both the foraging habitat and feeding habits. Similar to previous studies, the current study has found that the Hg concentration in wild sarcophagi fish is higher than that in omnivores and filter-feeding. Many studies also reported evidence of the biomagnification and bioaccumulation of mercury with trophic levels.13,15,49 Particularly, total mercury burdens in muscle tissue are a result of biomagnification through the food web rather than bioaccumulation.15
3.4 Human health risk assessment of metal(loid)s via fish consumption
Oral reference dose (RfDs) values for Ni, Cu, Zn and Cd are 20, 40, 300 and 1 μg per kg per day, respectively.32 The RfD of Cr(VI) (3.0 μg per kg per day), inorganic arsenic (0.3 μg per kg per day) and methylmercury (0.1 μg per kg per day) are taken to represent that of Cr, As, and Hg, respectively.32 Following the European Food Safety Authority,50 the RfD of Pb is set to 1.5 μg per kg per day. The target hazard quotients (THQs) are calculated using the average, maximum concentrations of eight metal(loid)s (Table 5). Regardless of the exposure levels utilized in the computational formula, all THQs of target elements were below 1.0 through the consumption of either fish alone, with the exception of THQ-Hg at high exposure levels. Hg shows maximum values for individual target hazard quotient (0.10), followed by As (0.069) and Zn (0.0089); whereas, THQs of Pb, Cu, Cr, Cd and Ni were small (below 0.01). The total hazard index (HI) is estimated by summing each THQ value of the target metal(loid)s. The HI at average exposure level was 0.20, indicating a lower health risk associated with the exposure of eight metal(loid)s. However, the HI at high exposure level is greater than 1.0 (1.94), suggesting a high risk from exposure to the maximum concentration of the target metal(loid)s in fish. In a sense, the accumulation of eight metal(loid)s would increase human health risks.| Elements | RfDs, μg per kg per day | Average exposure level | High exposure level | CRI (10−6) | ||
|---|---|---|---|---|---|---|
| EDI, μg per kg per day | THQ | EDI, μg per kg per day | THQ | |||
| a RfDs obtain from EPA.32b Standard of hexavalent chromium.c Standard of inorganic arsenic.d Data from European Food Safety Authority.50e Standard of mercuric chloride (and other mercury salts).f HI (average exposure level) = ∑THQs; HI (high exposure level) = ∑THQs; CRIt = ∑CRIt. | ||||||
| Cr | 3a,b | 0.0071 | 0.0024 | 0.19 | 0.064 | 3.57 (0.49–95.99) |
| Ni | 20a | 0.0076 | 0.0004 | 0.31 | 0.016 | |
| Cu | 40a | 0.11 | 0.0027 | 0.38 | 0.0096 | |
| Zn | 300a | 3.15 | 0.011 | 20.30 | 0.068 | |
| As | 0.3a,c | 0.021 | 0.069 | 0.15 | 0.51 | 31.04 (0.89–231.08) |
| Cd | 1a | 0.0005 | 0.0005 | 0.0036 | 0.0036 | 0.189 (0.075–1.35) |
| Pb | 1.5d | 0.013 | 0.0089 | 0.27 | 0.18 | |
| Hg | 0.3a,e | 0.031 | 0.10 | 0.33 | 1.08 | |
| HIf/CRIt | 0.20 | 1.94 | 34.79 (1.46–232.62) | |||
There are significant differences in the contribution rates of the eight metal(loid)s for HI at average exposure levels. Among the heavy metal elements, the contribution rate of Cu is the highest (27.78%), followed by Zn (15.51%), As (13.43%), Cd (13.01%) and Hg (9.62%), while that of Pb, Cr and Ni are quite low (all below 5.00%). While Cu and Zn are essential elements for the human body, their excessive accumulation would be detrimental for human health. The EDIs at the average exposure levels of Cu and Zn are much lower than the RfD values, and the THQs are below 1.0, implying that Cu and Zn are not high-risk elements. Although THQs of As, Cd and Hg are below 1.0, these toxic elements could still cause serious health issues to the general public.
For the single element, the average carcinogenic risk indexes of Cr, As, and Cd are all lower than 10−4 (Table 5), indicating that the carcinogenic risk of the residual metal(loid)s in the studied fish are acceptable. The total carcinogenic risk index ranges from a minimum of 1.46 × 10⁻⁶ to a maximum of 232.62 × 10⁻⁶ (an average value of 34.79 × 10⁻⁶) in fish consumption in Northeast China. The results show the potential carcinogenic risk of fish consumption in Northeast China. The levels of carcinogenic elements (Cr, As, and Cd) in fish in this area should be monitored.
4 Conclusions
This study investigated the concentrations of eight metal(loid)s in fish samples from Northeast China and evaluated the health risks from fish consumption. Relative to previous studies conducted in other regions, Cu, Cr, As, Cd and Pb (Ni, Zn and Hg) concentrations are higher (lower) in Northeast China. Apart from individual samples, most of the fish samples have metal(loid) levels below the guideline levels and legal limits. Some sort of relationships exist between the metal(loid)s in fish and their living environment. For instance, Cr, Ni, As and Cd levels in cultured fish appeared to correlate with those in pond sediment. Higher detection frequencies and concentrations of As and Hg in wild fish indicated a certain As-pollution and Hg-pollution in natural waters. The mean concentrations of eight metal(loid)s for each fish species are different, which might be due to different feeding habits and foraging habitats. In particular, Pb is the key risk factor in cultured fish, while As and Hg are the main risk factors in wild fish. Our results also indicate that consuming fish from Northeast China poses carcinogenic risk, and wild fish consumption would probably lead to mercury poisoning.Conflicts of interest
There are no conflicts to declare.Acknowledgements
This research was financially supported by Open Project of State Key Laboratory of Urban Water Resource and Environment, Harbin Institute of Technology (No. ES201604), Natural Science Foundation of Heilongjiang Province (No. QC2017033) and the Special Fund for Agro-scientific Research in the Public Interest (No. 201503108).References
- M. Hutton and C. Symon, Sci. Total Environ., 1986, 57, 129–150 CrossRef CAS PubMed.
- H. Bing, Y. Wu, J. Zhou, R. Li and J. Wang, Chemosphere, 2016, 148, 211–219 CrossRef CAS.
- J. R. Martín, C. De Arana, J. Ramos-Miras, C. Gil and R. Boluda, Environ. Pollut., 2015, 196, 156–163 CrossRef.
- S. Cheng, Environ. Sci. Pollut. Res., 2003, 10, 192–198 CrossRef CAS.
- Y. Guo and S. Yang, Sci. Total Environ., 2016, 543, 105–115 CrossRef CAS.
- J. Ren, Z. Shang, L. Tao and X. Wang, Pol. J. Environ. Stud., 2015, 24, 1041–1048 CrossRef CAS.
- W. Wildi, J. Dominik, J. L. Loizeau, R. L. Thomas, P. Y. Favarger, L. Haller, A. Perroud and C. Peytremann, Lakes Reservoirs: Res. Manage., 2004, 9, 75–87 CrossRef CAS.
- H. Nussey, Water SA, 2000, 26, 269–284 Search PubMed.
- A. G. Heath, Water Pollution and Fish Physiology, CRC Press, Boca Raton, Florida, U.S.A, 1987 Search PubMed.
- Y. Liu, G. Liu, Z. Yuan, H. Liu and P. K. Lam, Sci. Total Environ., 2018, 613, 462–471 Search PubMed.
- Y. G. Gu, Q. Lin, H.-H. Huang, L. g. Wang, J. J. Ning and F. Y. Du, Mar. Pollut. Bull., 2017, 114, 1125–1129 CrossRef CAS PubMed.
- J. L. Liu, X.-R. Xu, Z. H. Ding, J. X. Peng, M. H. Jin, Y. S. Wang, Y. G. Hong and W. Z. Yue, Ecotoxicology, 2015, 24, 1583–1592 CrossRef CAS.
- I. Jæger, H. Hop and G. W. Gabrielsen, Sci. Total Environ., 2009, 407, 4744–4751 CrossRef.
- N. L. Gale, C. D. Adams, B. G. Wixson, K. A. Loftin and H. Yue-Wern, Environ. Sci. Technol., 2002, 36, 4262–4268 CrossRef CAS.
- L. Atwell, K. A. Hobson and H. E. Welch, Can. J. Fish. Aquat. Sci., 1998, 55, 1114–1121 CrossRef CAS.
- V. Sirot, T. Guérin, J. L. Volatier and J.-C. Leblanc, Sci. Total Environ., 2009, 407, 1875–1885 CrossRef CAS.
- S. Rajeshkumar, Y. Liu, X. Zhang, B. Ravikumar, G. Bai and X. Li, Chemosphere, 2018, 191, 626–638 CrossRef CAS.
- Y.-J. Yi and S.-H. Zhang, Environ. Sci. Pollut. Res., 2012, 19, 3989–3996 CrossRef CAS.
- A. Mountouris, E. Voutsas and D. Tassios, Mar. Pollut. Bull., 2002, 44, 1136–1141 CrossRef CAS.
- C. Y. Chen and C. L. Folt, Environ. Sci. Technol., 2000, 34, 3878–3884 CrossRef CAS.
- A. Goutte, Y. Cherel, C. Churlaud, J.-P. Ponthus, G. Massé and P. Bustamante, Sci. Total Environ., 2015, 538, 743–749 CrossRef CAS.
- H. Leung, A. Leung, H. Wang, K. Ma, Y. Liang, K. Ho, K. Cheung, F. Tohidi and K. Yung, Mar. Pollut. Bull., 2014, 78, 235–245 CrossRef CAS.
- G. B. Jiang, J. B. Shi and X. B. Feng, Environ. Sci. Technol., 2006, 40, 3672–3678 CrossRef CAS.
- L. Bingli, S. Huang, Q. Min, L. Tianyun and W. Zijian, J. Environ. Sci., 2008, 20, 769–777 CrossRef.
- N. Li, Y. Tian, J. Zhang, W. Zuo, W. Zhan and J. Zhang, Environ. Sci. Pollut. Res., 2017, 24, 3214–3225 CrossRef CAS.
- D. Qin, H. Jiang, X. Huang, L. Gao, Z. Chen, Z. Mou and L. I. Gang, Acta Sci. Circumstantiae, 2016, 36, 1910–1916 CAS.
- K. Pan and W.-X. Wang, Sci. Total Environ., 2012, 421, 3–16 CrossRef.
- D. Qin, H. Jiang, S. Bai, S. Tang and Z. Mou, Food Control, 2015, 50, 1–8 CrossRef CAS.
- H. Jiang, D. Qin, Z. Chen, S. Tang, S. Bai and Z. Mou, Bull. Environ. Contam. Toxicol., 2016, 97, 536–542 CrossRef CAS.
- FAO, in Heavy Metals Regulations Legal Notice No 66/2003, FAO, Rome, 2003 Search PubMed.
- F. Zhai, H. Wang, S. Du, Y. He, Z. Wang, K. Ge and B. M. Popkin, Nutr. Rev., 2009, 67, S56–S61 CrossRef.
- EPA, in Regional Screening Level (RSL) Resident Fish Table, United States Environmental Protection Agency, Washington DC, 2018 Search PubMed.
- EPA, Guidance for Assessing Chemical Contaminant Data for Use in Fish Advisories, Risk Assessment and Fish Consumption Limits, Washington DC, 2000 Search PubMed.
- NHFPC, National standards for food safety-contaminants limit in food, 2017, GB 2762-2017 Search PubMed.
- SAC, Non-environmental Pollution Food-limit of Poisonous and Harmful Substances in Aquatic Products, NY, 2006, pp. 5073–2006 Search PubMed.
- EC, in Official Journal of the European Union, No. 1881/2006, 2015 Search PubMed.
- DOH, in Foodstuffs, cosmetics and disinfectants act, 1972 (Act no. 54 of 1972), Government Gazette, 2004 Search PubMed.
- R. Nakagawa, Y. Yumita and M. Hiromoto, Chemosphere, 1997, 35, 2909–2913 CrossRef CAS.
- M. S. Rahman, A. H. Molla, N. Saha and A. Rahman, Food Chem., 2012, 134, 1847–1854 CrossRef CAS.
- C. Ip, X. Li, G. Zhang, C. Wong and W. Zhang, Environ. Pollut., 2005, 138, 494–504 CrossRef CAS.
- R. Yang, T. Yao, B. Xu, G. Jiang and X. Xin, Environ. Int., 2007, 33, 151–156 CrossRef CAS.
- M. Canli and G. Atli, Environ. Pollut., 2003, 121, 129–136 CrossRef CAS.
- K. A. Asante, T. Agusa, H. Mochizuki, K. Ramu, S. Inoue, T. Kubodera, S. Takahashi, A. Subramanian and S. Tanabe, Environ. Pollut., 2008, 156, 862–873 CrossRef CAS.
- Y. Yujun, W. Zhaoyin, K. Zhang, Y. Guoan and D. Xuehua, Int. J. Sediment Res., 2008, 23, 338–347 CrossRef.
- R. D. Handy and F. B. Eddy, J. Fish Biol., 1989, 34, 865–874 CrossRef CAS.
- H. Zhou and M. H. Wong, Water Res., 2000, 34, 4234–4242 CrossRef CAS.
- H. Zhu, B. Yan, H. Cao and L. Wang, Environ. Monit. Assess., 2012, 184, 77–88 CrossRef CAS.
- J. Reinfelder, N. Fisher, S. Luoma, J. Nichols and W. X. Wang, Sci. Total Environ., 1998, 219, 117–135 CrossRef CAS.
- L. M. Campbell, R. J. Norstrom, K. A. Hobson, D. C. Muir, S. Backus and A. T. Fisk, Sci. Total Environ., 2005, 351, 247–263 CrossRef.
- EFSA, EFSA J., 2010, 8, 1570 CrossRef.
| This journal is © The Royal Society of Chemistry 2019 |