DOI:
10.1039/C9RA05167H
(Paper)
RSC Adv., 2019,
9, 29864-29872
Temperature tuned syntheses of two new d10-based Cd(II) cluster metal–organic frameworks: luminescence sensing and photocatalytic properties†
Received
8th July 2019
, Accepted 11th September 2019
First published on 20th September 2019
Abstract
The solvothermal reactions of 5,5′-(1,4-phenylenebis(methyleneoxy))diisophthalic acid (H4L) and the N-donor ancillary ligand 3,3′,5,5′-tetramethyl-4,4′-bipyrazole (bpz) with cadmium(II) salts at two different reaction temperatures yielded two new metal–organic frameworks (MOFs), viz., [Cd(H2L)(bpz)]n (1) and [Cd2(H4L)(L)(bpz)2]n (2), which have been characterized by FTIR and single crystal X-ray diffraction. The single crystal X-ray diffraction studies revealed that 1 displays a 3-periodic network with monometallic SBU, while 2 exhibits a 3-periodic network with a 2-fold interpenetration feature. The effects of variation in reaction temperature on the architecture of MOFs 1 and 2 have been discussed. The luminescence investigation indicates that both 1 and 2 displayed good turn-off luminescence sensing against nitroaromatic compounds (NACs), especially m-nitrophenol (MNP), via a decrease in their luminescence intensities with a Ksv value of 6.43 × 10³ for 1 and 2.03 × 10⁴ for 2 and LOD values of 1.09 and 0.81 ppm for 1 and 2, respectively. The plausible mechanism for the decline in luminescence intensity of the MOFs with NACs has been addressed using theoretical calculations. The photocatalytic properties for both the MOFs demonstrated that they display efficient photocatalytic performances to degrade methyl violet (MV) under UV irradiation. The plausible mechanism through which these MOFs exhibited photocatalytic properties has been suggested using band gap calculations.
Introduction
In the past couple of years, extensive development has been witnessed in the design and engineering of multidimensional metal–organic frameworks (MOFs) due to their potential applications in fields such as adsorption, sensing and catalysis.1,2 In order to build new molecular architectures, much effort has been made to improve the basic building blocks by varying the experimental conditions.3 A subtle change in factors such as the reaction temperature may lead to a drastic change in the dimensions and topologies of the resulting MOFs, which results in difficulty in controlling the topology of the obtained structure.4–6 Although many MOFs with diverse structures have been synthesized by varying the reaction conditions, few of them are based on the same secondary building unit (SBU) and organic ligand. Hence, it is still required to have a fundamental understanding of the factors such as reaction temperature that influence crystal growth.7
It is well established that the nitroaromatic compounds (NACs) such as m-nitrophenol (MNP) and 2,4,6-trinitrophenol (TNP) are strong explosives and dangerous energy sources. The contamination of MNP in the environment imposes several health issues because of its mutagenic and carcinogenic activities. Although some MOFs had been reported which successfully detected many NACs, but the selective sensing of MNP is still challenging. Therefore, the workers actively working in the area of MOF-based sensors are still looking for the new MOFs that can selectively sense MNP.
In addition, organic dyes (such as methyl violet (MV)) are the most hazardous organic pollutant that causes the water pollution and poses problem in the development of society and industries.8 The removal or sustainable decomposition of these aromatic dyes from the waste water effectively is still a formidable challenge. It had been reported that the idea of using MOFs as photocatalysts had originated from its framework, which could be used as charge carrier transporting systems through the photoexcitation of linkers or metal clusters.9
Encouraged by these synthetic strategies and applications of MOFs and in continuation to our pursuit for development of new MOF-based sensors for NACs and photocatalyst for safe degradation of aromatic dyes, we herein report two new Cd(II)-based MOFs viz. [Cd(H2L)(bpz)]n (1) and [Cd2(H4L)(L)(bpz)2]n (2) which have been synthesized by temperature modulation strategy using H4L and bpz ligands (Scheme 1). These MOFs have been used as sensors for the selective detection of MNP and as photocatalyst to photodegrade MV dye. The results of these investigations are presented herewith.
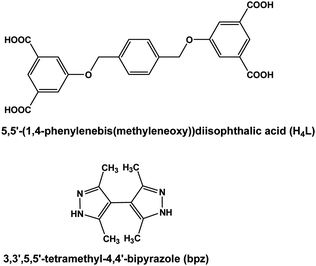 |
| | Scheme 1 Structure of the ligand and ancillary ligand. | |
Results and discussion
Crystal structure description
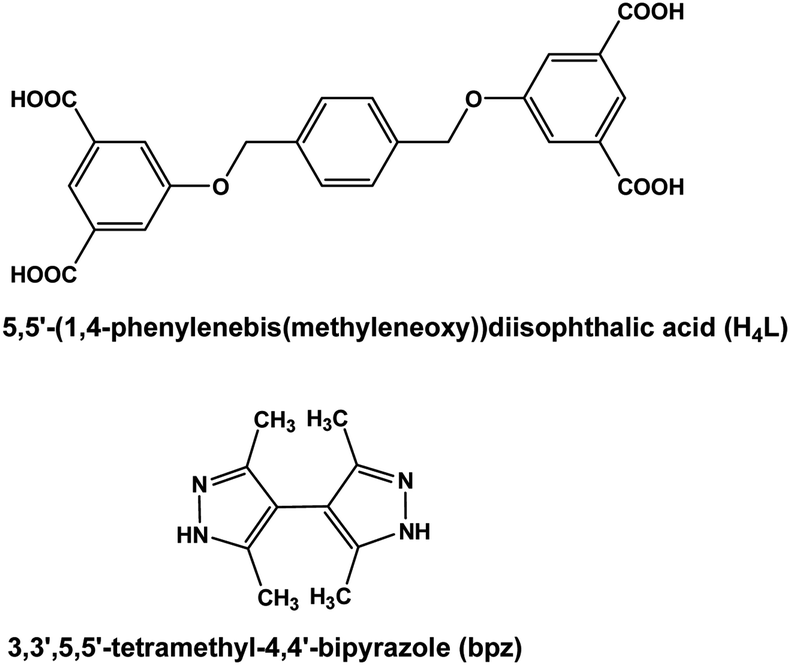
Single crystal X-ray diffraction indicates that the MOF 1 crystallizes in P21/c space group and the asymmetric unit contains one Cd(II), one L2− with half of the carboxylic acids deprotonated (Fig. 1a and Scheme S1a†) and one bpz (Fig. 1b). In 1, each hepta-coordinated Cd(II) links to two nitrogen centers of two bpz, one oxygen of one carboxylate, two oxygens from two carboxylic acids and two O from one carboxylate to form a monometallic SBU (Fig. S1†). The L2− coordinates with Cd(II) to form a 3-periodic network (Fig. 1c), and then bpz links two adjacent Cd(II) to construct 3D network (Fig. 1d). Interestingly, the OH group of CO2H and NH of bpz form four hydrogen bonds in each SBU (Fig. 1e). The two O–H⋯O hydrogen bonding interactions are 2.4452 Å and 2.5136 Å long while the corresponding angles are 158.152° and 153.248°. The two N–H⋯O hydrogen bonding interactions are 2.6977 Å and 2.8106 Å long with angles 143.607° and 127.221°.
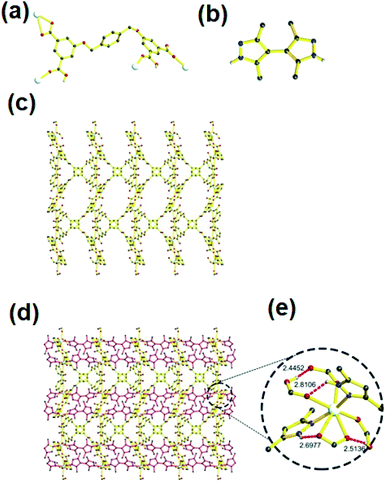 |
| | Fig. 1 (a) L2− in MOF 1; (b) the structure of bpz; (c) the network of MOF 1 when omitted bpz; (d) 3D structure of MOF 1 and (e) the SBU for MOF 1 and the intramolecular hydrogen bond (red dashed bond represents intramolecular hydrogen bonds). The argent, black, red and blue spheres represent Cd, C, O and N respectively; except those hydrogen atoms involve in hydrogen bond, other hydrogen atoms are omitted for clarity. | |
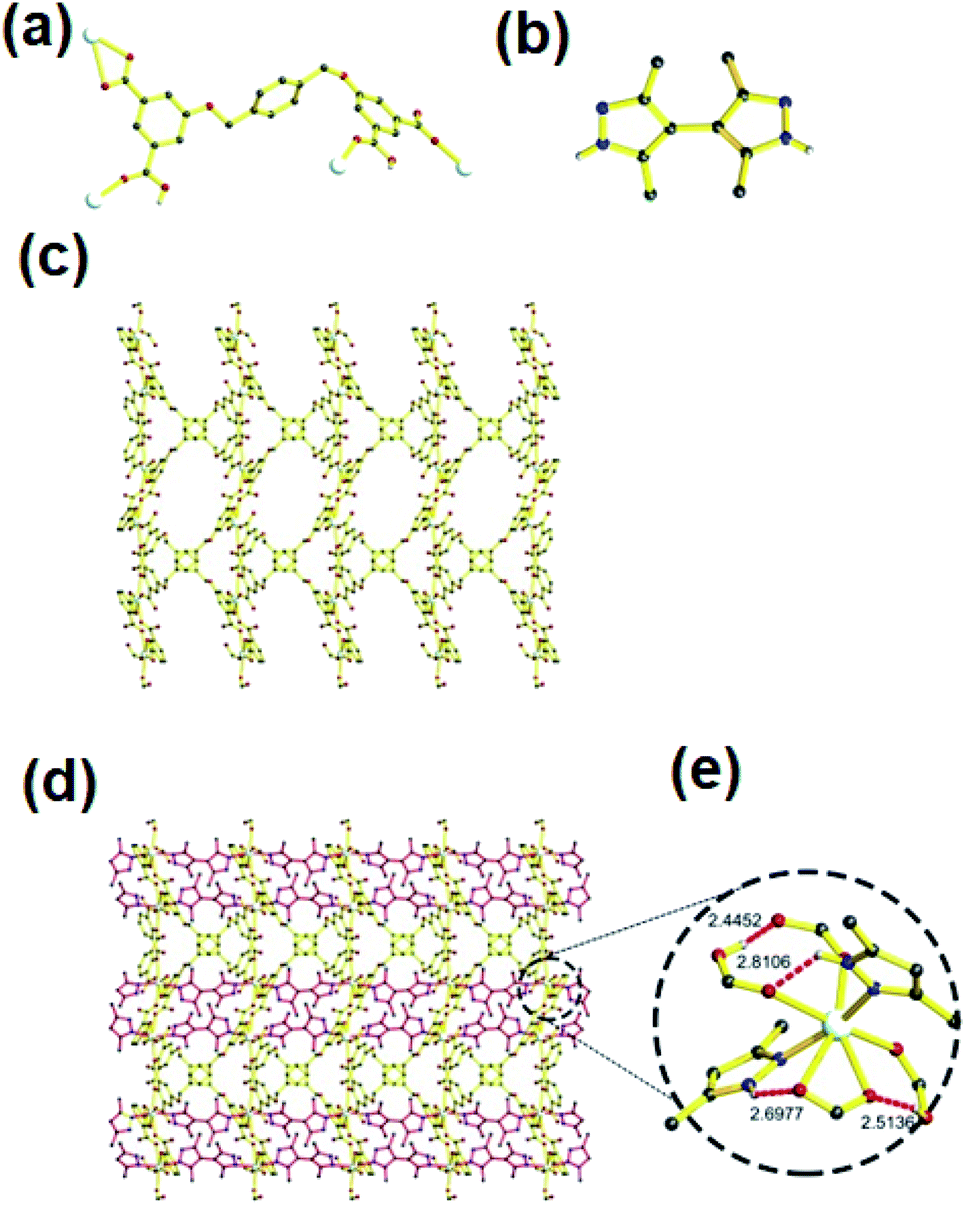
Unlike 1, the MOF 2 crystallizes in P-1 space group. It is interesting that two kinds of L (one H4L and a fully-deprotonated L4−) exist in the structure of 2 (Fig. 2a and b, Schemes S1b and c†). Each asymmetric unit contains one Cd(II), one bpz, half L and half L4−. Each six coordinated Cd(II) is coordinated to two nitrogens of two bpz, one oxygen from L, one oxygen from L4− and two oxygens from one carboxylate of L4− to form a 3-periodic framework (Fig. S2† and 2c). Further, these single nets self-assemble into a 2-fold interpenetrated structure using hydrogen bonds to lock each other (Fig. 2d). Except two intramolecular hydrogen bonds surrounding the SBU (O–H⋯O having distance and angle of 2.4460 Å and 167.937°, respectively; N–H⋯O with distance and angle of 2.7406 Å and 126.135°, respectively), two additional intermolecular hydrogen bonds (O–H⋯O distance 2.5605 Å and angle of 168.718°; N–H⋯O interaction having distance and angle of 2.8305 Å and 179.253°, respectively) also exist in each SBU (Fig. 2e).
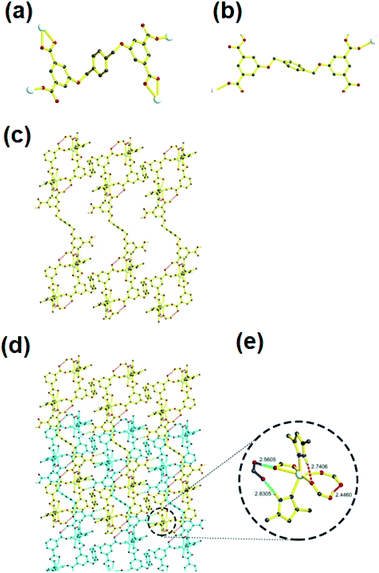 |
| | Fig. 2 (a) and (b) L4− and H4L in MOF 2, respectively; (c) and (d) the single net and 2-fold interpenetrated structure of MOF 2, each net is highlighted with different color, respectively; (e) the SBU of MOF 2 and the intra- and intermolecular hydrogen bond (red and green dot bond represents intra- and intermolecular hydrogen bond respectively). The argent, black, red and blue spheres represent Cd, C, O and N respectively; except those hydrogen atoms involve in hydrogen bond, other hydrogen atoms are omitted for clarity. | |
Influence of temperature on coordination chemistry of MOFs
The frameworks of both the MOFs can be described as constitutional isomers because they possess SBUs with different coordination environments, but having the same chemical formula.10a It had been reported that the topology as well framework of MOFs could be controlled by adjusting the reaction conditions in particular the reaction temperature.10 In a typical representative example, MOFs having entirely different topology and framework have been synthesized at different reaction temperatures using the succinate ligand and same metal salt. This investigation further demonstrated that with increasing the reaction temperature, the overall dimensionality and density of the MOFs increases.10c Similar phenomena have been observed in other work also.10d
IR spectroscopy
The FTIR spectra of 1 and 2 display bands corresponding to νC![[double bond, length as m-dash]](https://www.rsc.org/images/entities/char_e001.gif) N, νN–N of bpz ligand at 1528 and 1045 cm−1, respectively. In comparison to the free bpz ligand, the shift in νN–N and the shift in vibration of bipyrazole ring to lower energy can be attributed to the coordination of bipyrazole nitrogen to the Cd(II) center. The strong and broad stretching bands at ca. 3440 cm−1 can be assigned to the vibrations arising from the water molecules (Fig. S3†). The band around 1700 cm−1 in 1 and 2, suggest that the H4L ligands in MOFs are not completely deprotonated. The intense bands observed at ca. 1600 and 1380 cm−1 arises because of the asymmetric and symmetric stretching vibrations of the carboxylate group of H4L ligands, respectively. The νas(COO)–νs(COO) appears at 211 and 188 in 1; 255 cm−1 in 2, suggesting that the H4L ligand in 1 and 2 adopts monodentate and bidentate coordination modes, respectively.
N, νN–N of bpz ligand at 1528 and 1045 cm−1, respectively. In comparison to the free bpz ligand, the shift in νN–N and the shift in vibration of bipyrazole ring to lower energy can be attributed to the coordination of bipyrazole nitrogen to the Cd(II) center. The strong and broad stretching bands at ca. 3440 cm−1 can be assigned to the vibrations arising from the water molecules (Fig. S3†). The band around 1700 cm−1 in 1 and 2, suggest that the H4L ligands in MOFs are not completely deprotonated. The intense bands observed at ca. 1600 and 1380 cm−1 arises because of the asymmetric and symmetric stretching vibrations of the carboxylate group of H4L ligands, respectively. The νas(COO)–νs(COO) appears at 211 and 188 in 1; 255 cm−1 in 2, suggesting that the H4L ligand in 1 and 2 adopts monodentate and bidentate coordination modes, respectively.
Powder X-ray diffraction (PXRD) and thermal analyses
To determine whether the crystal structures of the MOFs 1 and 2 are true representative of their bulk materials which have been used for property investigation, powder X-ray diffraction (PXRD) experiments were carried out for both the MOFs (Fig. S4†). The experimental and simulated diffraction patterns were observed to be well matched with respect to their corresponding key positions which indicate the phase purity of the bulk samples of 1 and 2. Additionally, to assess the thermal stability of MOFs 1 and 2, thermogravimetric analyses (TGA) were performed under nitrogen atmosphere (Fig. S5†). For anhydrous 1, the decomposition of the organic ligands takes place at 300 °C. The weight loss occurring in temperature range 355 to 775 °C corresponds to the decomposition of the organic ligands. The remaining residue can be attributed to the formation of Cd2O3. In 2, the weight has been observed to decrease continuously after 55 °C, which indicates that 2 is unstable in nature which on heating between 55–355 °C lead to the removal of bpz ligand. This observation is consistent with the removal of one molecule (calcd. 21.4% and found 21.8%) in 2.
Photoluminescence properties
Since, the multidentate ligands and their complexes containing d10 metal ions commonly possess strong photoluminescent (PL) properties, therefore the emission properties of free H4L ligand and both Cd-based MOFs were studied at room temperature (Fig. S6†). The emission studies indicates that upon excitation at 320 nm, the free H4L ligand displayed emission maxima at 336 nm. While, the MOFs 1 and 2 exhibited blue emission band upon excitation at 333 nm, which can probably be attributed to a ligand-centered charge transfer transition.11
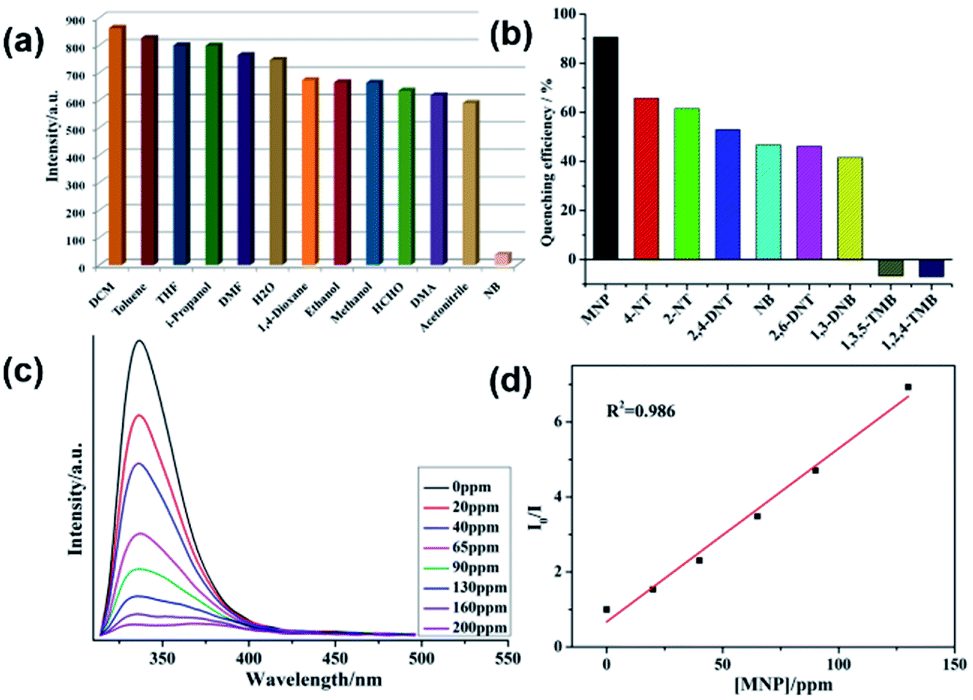
The emission responses of both 1 and 2 in DMF suspensions towards organic molecules were also investigated. It was observed that nitrobenzene (NB) was capable of quenching the emission intensities of both 1 and 2 effectively (Fig. 3a and 4a). Hence, to gain more insight into the aromatic sensing behaviour of both the MOFs, different aromatic compounds (ACs) viz. 2,4-dinitrotoluene (2,4-DNT), 2,6-dinitrotoluene (2,6-DNT), 2-nitrotoluene (2-NT), 4-nitrotoluene (4-NT), 1,3-dinitrobenzene (1,3-DNB), m-nitrophenol (MNP), 1,2,4-trimethylbenzene (1,2,4-TMB), 1,3,5-trimethylbenzene (1,3,5-TMB), were employed to substantiate sensing studies. The emission studies indicated that all the aromatic compounds possessing –NO2 NACs declined the luminescent intensity of both 1 and 2 to varied extent. The sequence in which the aromatic compounds declined the emission intensity of 1 is MNP > 4-NT > 2-NT > 2,4-DNT > NB ≈ 2,6-DNT ≈ 1,3-DNB > 1,3,5-TMB > 1,2,4-TMB. While for 2 this quenching efficiency follows the order MNP > 4-NT > 2,4-DNT > NB ≈ 4-NT > 2,6-DNT > 2-NT > 1,3-DNB > 1,3,5-TMB > 1,2,4-TMB for 2 (Fig. 3b, 4b and S7–S22†). Further investigations indicated that the emission intensities of both 1 and 2 declined steadily with increase in the concentrations of MNP. Also, upon addition of 200 ppm and 130 ppm of MNP the fluorescence intensities of 1 and 2 were almost negligible (Fig. 3c and 4c).12 However, all other nitro-aromatic compounds also showed quenching effect to different extent on the emission intensities of MOFs (Fig. S7–S22, S13–S34†). In contrast to the addition of nitroaromatic compounds to the MOFs 1 and 2 where decline in the luminescence intensities resulted to different extents, the addition of 1,3,5-TMB and 1,2,4-TMB to both the MOFs exhibited almost negligible effect on their luminescence intensities (Fig. 3b and 4b). Hence, these results demonstrated that both 1 and 2 displayed selective sensing properties to detect MNP in presence of different NACs.
 |
| | Fig. 3 (a) The luminescence intensity of 1 dispersed in different solvents; (b) luminescence quenching efficiency of 1 dispersed in different NACs; (c) emissive response of 1 against variable concentration of MNP; (d) S–V plot of MNP. | |
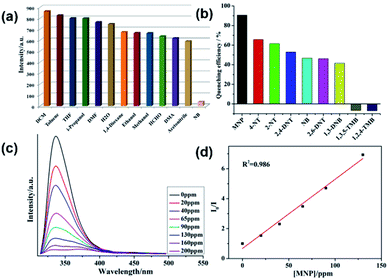 |
| | Fig. 4 (a) The luminescence intensity of 2 dispersed in different solvents; (b) luminescence quenching efficiency of 2 dispersed in different NACs; (c) emissive response of 2 against variable concentration of MNP; (d) S–V plot of MNP. | |
The emission quenching efficiency for both the MOFs have quantitatively been explained with the assistance of Stern–Volmer (SV) equation: (I0/I) = 1 + Ksv[Q]. The Stern–Volmer plots for MNP is nearly linear at low concentrations with the Ksv value of 6.43 × 10³ for 1 and 2.03 × 10⁴ for 2 (Fig. 3d and 4d). The detection limit for MNP had been calculated to be 1.09 ppm for 1 and 0.81 ppm for 2 which is based on the 3δ/slope.13,14 The LOD values reported herein are almost comparable to the LOD values of some previously reported materials (Table S3†). Therefore, both 1 and 2 can be employed to distinguish the NACs comprising of electron-donor and/or electron-withdrawing substituents.15 The results also indicate the MOF 2 possess higher selectivity than that of the MOF 1 to detect MNP. This difference in sensing properties of both the MOFs can be attributed to the formation of hydrogen-bonding interactions (O–H⋯O) by –COOH and –NO2 groups existing in both the MOFs.14d,14e Since, there are more number of free –COOH groups in 2, therefore it can form more number of hydrogen bonds with –NO2 groups of MNP which resulted in superior sensing properties exhibited by 2 than 1 to detect MNP. Also, such quenching effect mainly arises due to the energy transfer mechanism. However, compared with other MOFs, 2 exhibits less selective MNP sensing, which is due to its smaller void space (Table S3†).14b,c Therefore, the presence of small pores in both the MOFs and by considering the sizes of different NACs, there is no possibility of the accommodation of these NACs in the pores of MOF. The PXRD experiments have been conducted for both the MOFs after sensing experiments which revealed that the crystallinity and the structural integrity of both 1 and 2 were well preserved because the PXRD patterns were comparable with the pristine 1 and 2 (Fig. S4†).
In order to provide rationale for the decrease in luminescence intensity of both the MOFs to variable degree with NACs, the HOMO–LUMO energies of MOFs 1 and 2 as well as all the aromatic analytes exploited in this work had been calculated using density functional theory (DFT) calculations which were performed at the B3LYP level (Table 1, Fig. S23†). The most likely reason for the decrease in luminescence intensity of MOFs when different NACs are incorporated in their suspension is the charge transfer. The direction of such charge transfer transitions is usually from LUMO of photo-excited MOFs to the LUMO of these analytes. Such phenomenon will be feasible only when the LUMO energies of MOFs are greater than the LUMOs of acceptor analytes.16–18 The Table 1 indicates that the LUMO energies of 1 and 2 are greater than the LUMO energies levels of all the NACs except 1,2,4-TMB and 1,3,5-TMB. So, these NACs can accept charge to variable extent photo-excited MOFs 1 and 2 which in turn results in the decrease in luminescence intensity of both the MOFs. Also, the LUMO of analytes 1,2,4-TMB and 1,3,5-TMB possess higher energies than both the MOFs and hence are not in appropriate position to accept charge from these photo-excited MOFs. Hence these two analytes have small effect on luminescence intensities of both the MOFs. But, the experimental sequence of decrease in luminescence intensity associated with both the MOFs with different NACs are not in agreement with the corresponding LUMO energies of NACs. Hence, in addition to charge transfer, there are chances of weak interactions that are formed between both the MOFs and NACs which additionally are responsible for the decrease in luminescence intensities.18 Also, the existence of constraints related to transition probability of MOFs 1 and 2 for example probably different NACs may inhibits linker motions (in the excited state) in MOFs to different extent may be responsible for the decrease in luminescence intensities.18e,f The similar decline in luminescence have been reported with other MOFs/CPs when different NACs were added to them.19
Table 1 The HOMO–LUMO energies (in eV) for different analytes and MOFs
| Ligand/1/analyte |
HOMO |
LUMO |
| 1 |
−4.82 |
−2.21 |
| 2 |
−4.91 |
−2.19 |
| m-Nitrophenol (MNP) |
−6.78 |
−2.40 |
| 2-Nitrotoluene (2-NT) |
−7.28 |
−2.32 |
| 4-Nitrotoluene (4-NT) |
−7.36 |
−2.32 |
| Nitrobenzene (NB) |
−7.60 |
−2.43 |
| 2,6-Dinitrotoluene (2,6-DNT) |
−7.91 |
−2.87 |
| 2,4-Dinitrotoluene (2,4-DNT) |
−8.11 |
−2.98 |
| 1,3-Dinitrobenzene (1,3-DNB) |
−8.42 |
−3.14 |
| 1,2,4-Trimethylbenzene (1,2,4-TMB) |
−6.03 |
0.28 |
| 1,3,5-Trimethylbenzene (1,3,5-TMB) |
−6.18 |
0.26 |
Photocatalysis
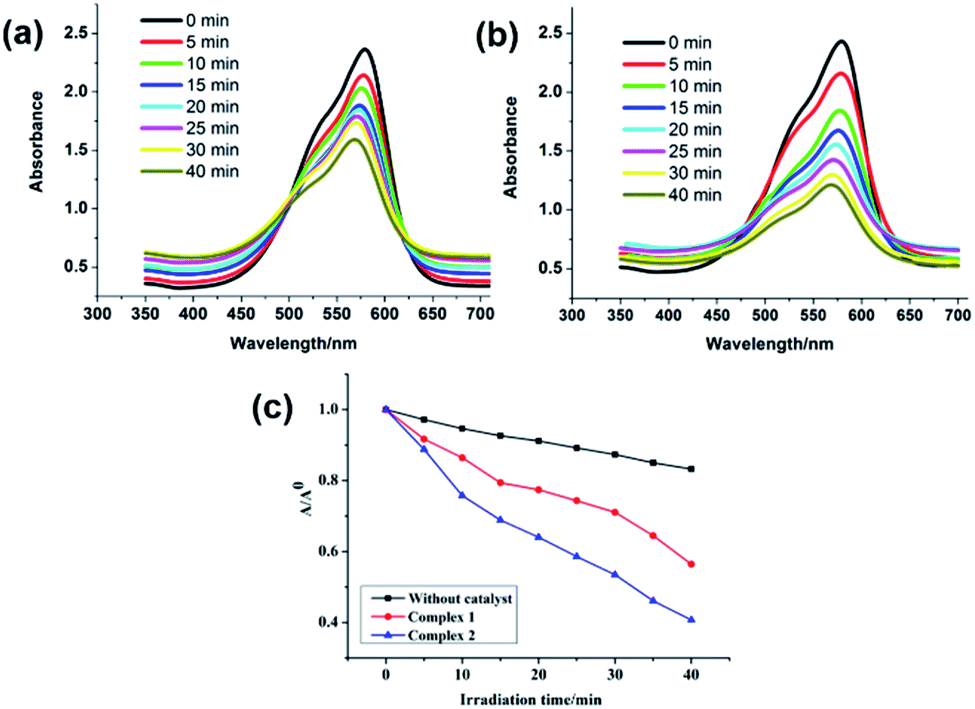
The solid state UV/Vis spectra for both MOFs were recorded at room temperature which displayed absorption in UV region (Fig. S24†). The main intense absorption peaks are at around 250–350 nm for MOFs can be attributed to π–π* transitions operating in the ligand or because of the ligand-to-metal charge transfer.20 In the diffuse reflectance spectroscopy (DRS), scattered radiation are collected by excluding the reflected light which are matching closely with the Kubelka–Munk function. The energy band gaps (Eg) obtained by extrapolation of the linear portion of the absorption edges were estimated to be 2.71 eV and 3.32 eV for 1 and 2, respectively which indicates their semiconducting nature. The band gap sizes of 1 and 2 indicated that they may show absorption responses to UV light and hence have the potential for the catalytic photodegradation of organic dyes. Organic dyes are widely used as colouring materials in the textile industry as they have good chemical stability but poor biodegradability.20 In the last couple of years we had provided significant new insight into the development of efficient heterogeneous photocatalytic materials comprising of varied coordination polymers and MOFs for the safe and sustainable decomposition of these organic dyes.21 In the presented work MV was selected as a model dye contaminant to investigate the photocatalytic activities of MOFs 1 and 2. The photocatalytic activities of 1 and 2 were assessed by decomposing aqueous solution of MV under the UV irradiation. The electronic absorption bands of MV displayed perceptible decline with reaction time (Fig. 5a and b). Moreover, the electronic absorption band intensity of MV was plotted against time (min) in presence of 1 and 2 (Fig. 5c). The results showed that 60.9% MV degraded within 45 min in presence of 2. While in the presence of 1 merely 44.6% of MV degraded. The degradation efficiency of MOF 2 is comparable to the efficiencies of previously reported MOFs (Table S4†). In order to investigate the stabilities of both MOFs after the photocatalytic reactions, the PXRD data for both 1 and 2 were recorded (Fig. S4†). The powder XRD patterns of both 1 and 2 were nearly matching with the as-synthesized MOFs. These results indicated that both the MOFs could be used as the stable photo-catalysts for the degradation of MV in aqueous solutions under UV irradiation. The observed differences in the photocatalytic properties of 1 and 2 may be because of the differences in their 3D frameworks and band-gaps.22,23 The reusability of both 1 and 2 have been checked for four catalytic cycles. The results indicated that both the MOFs can be reused for four catalytic cycles with moderate photocatalytic efficiency decay (Fig. S25†) and concomitant loss of crystallinity (Fig. S4†). These results imply that both 1 and 2 can be considered as robust catalysts for the degradation of MV. In addition, the photocatalytic properties of free H4L ligand was tested against the photodegradation of MV. The Fig. S26† presents the comparison of photocatalytic profiles of MOFs 1, 2, H4L ligand under similar conditions. An equimolar amount of H4L used as catalyst decomposed only 31% of MV after 45 min. Also, on comparing the results of control experiments, it can be concluded that the presence of MOF as well as UV light irradiation are required for the photodecomposition of MV. Furthermore, when photodegradation reaction time for MV in presence of these MOFs 1 and 2 were enhanced for 1.5 h indicated no perceptible decline in the electronic absorption band characteristic of MV, which indicated that there were negligible possibility of adsorption of MV dye by the framework of these MOFs.
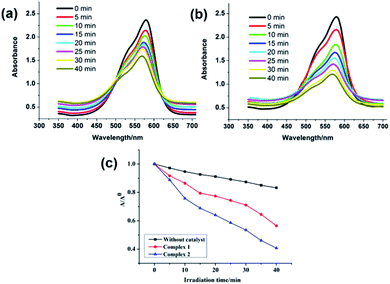 |
| | Fig. 5 Absorption spectra of the MV solution during the photodegradation reaction under UV irradiation in the presence of compounds (a) for 1 and (b) for 2; (c) photocatalytic efficiency of MV in the following conditions: compounds 1 and 2 as catalyst under UV light, MV photodegradation without catalyst under UV light. | |
Also, to explore further the main active species responsible for the photodegradation of MV, the trapping experiments were conducted by introducing 15 mg benzoquinone (BQ, as a quencher of O2˙−) or 0.3 mL tertiary butyl alcohol (TBA, as a quencher of ·OH) or 15 mg ammonium oxalate (AO, as a quencher of holes, h+) in the reaction medium (Fig. S27†). It was observed that the photocatalytic degradation efficiency of 1 to degrade MV declined to 20.9% in presence of BQ, 26.6% with TBA and 36.8% with AO. While the photocatalytic degradation efficiency of 2 utilized for the photodegradation of MV decreased to 30.4% with BQ, 43.6% in presence of TBA and 51.2% with AO (Fig. S27†). Thus, these experiments indicate that all the three active species viz. O2˙−, ·OH and h+ are responsible for the photocatalytic degradation of MV.
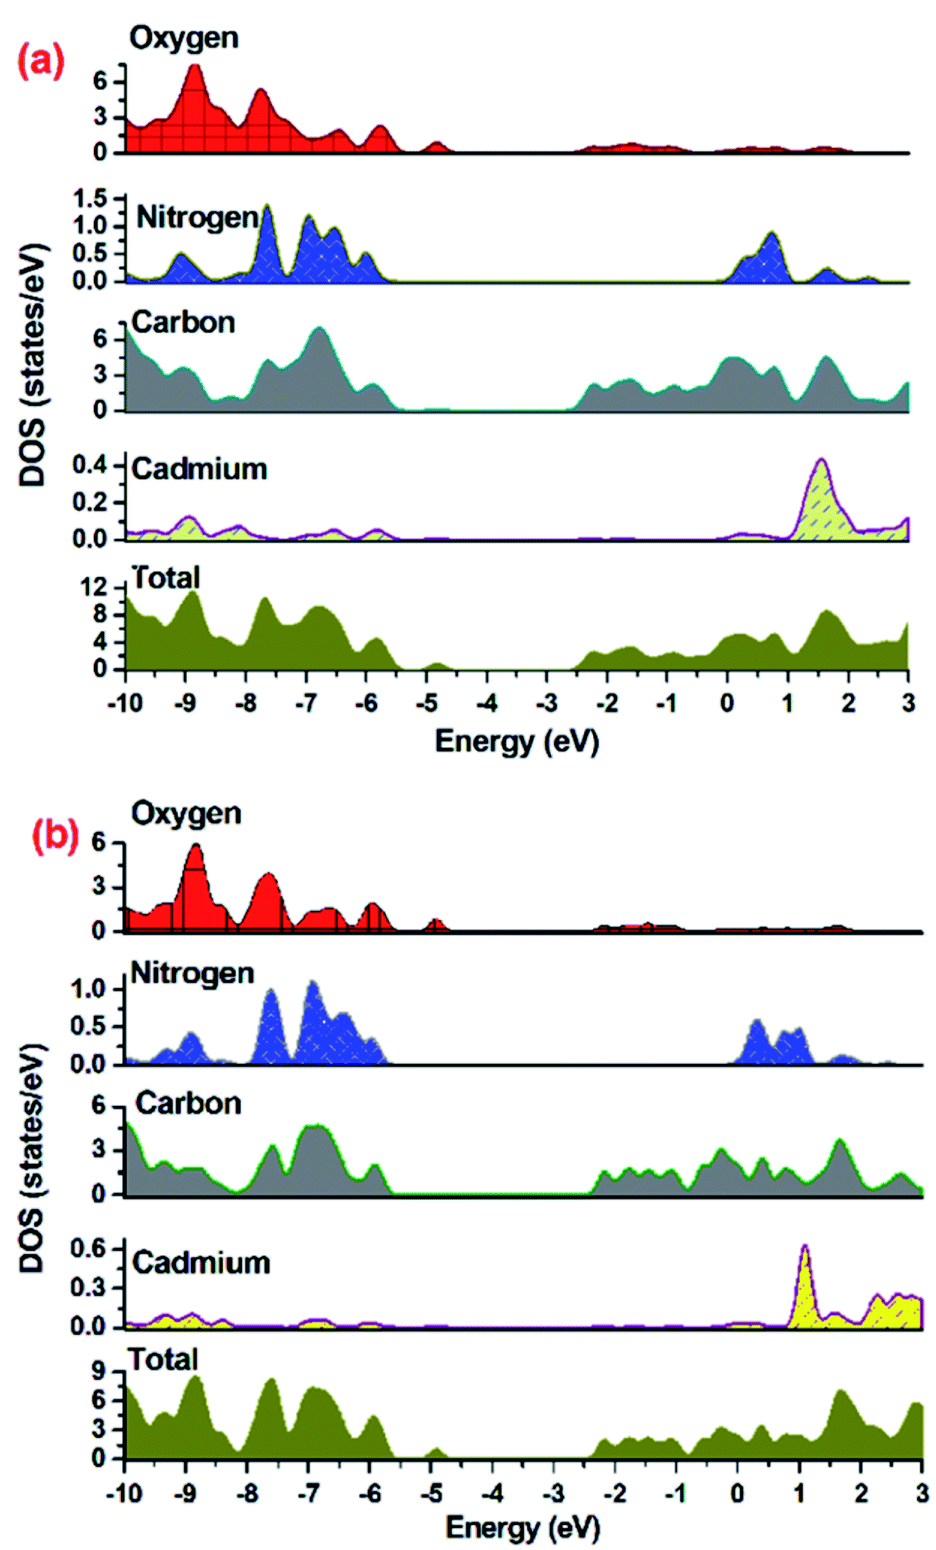
To establish mechanism for MOF 1 or 2 assisted degradation of MV in UV light, the density of states (DOS) and partial DOS (pDOS) plots have been constructed to assess the band structure of both the MOFs (Fig. 6). As indicated in Fig. 6, the aromatic carbon centers and oxygen centers of the carboxylate groups are the major contributor in valence band of the MOF with no contribution from Cd(II) centers. The conduction band of the MOF in the range of −2.7 to −2.1 eV for 1 and −2.5 to −2.0 eV for 2 are having contribution from aromatic carbons in majority and small contribution from carboxylate oxygens. Hence DOS and pDOS plots indicate that in both the MOFs, the electronic transitions taking place from one aromatic center to another aromatic center (ligand-to-ligand) with small contribution from carboxylate oxygens.
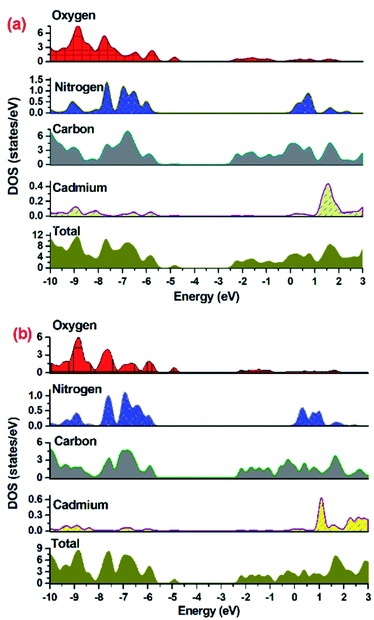 |
| | Fig. 6 Density of states (DOS) and partial DOS plots for (a) 1 and (b) 2. | |
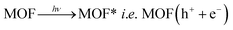
In other words, during photoexcitation, charge transfer from HOMO → LUMO generate hole at HOMO level. The electron deficient HOMO captures and electron from water molecule which in turn produces ·OH radical. These ·OH radicals are now capable of decomposing organic dye efficiently to complete the photocatalytic decomposition of MV (Scheme 2). The plausible mechanistic pathway which may be operating during the photo-decomposition of dyes in presence of MOFs can be presented as follows:24
| |
 | (1) |
| | |
MOF(h+ + e−) + H2O → MOF(e−) + HO˙ + H+
| (2) |
| | |
HO˙ + MV → oxidation products → CO2 + H2O
| (3) |
| | |
MOF(e−) + O2 → MOF(O2˙−)
| (4) |
| | |
O2˙−/HO2˙ + S → oxidation products
| (5) |
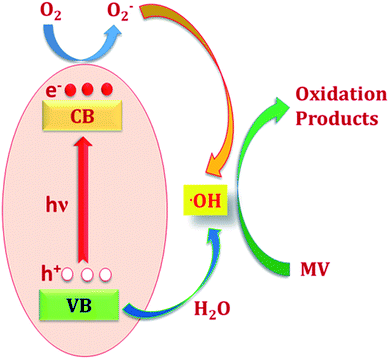 |
| | Scheme 2 The plausible photocatalytic mechanism through which MOFs photo-decompose methyl violet (MV). | |
Conclusions
In summary, two new cadmium(II) based MOFs [Cd(H2L)(bpz)]n (1) and [Cd2(H4L)(L)(bpz)2]n (2) have been synthesized using same ligand and ancillary ligand on solvothermally by varying the temperature. These MOFs though having same ligand and ancillary ligand possess different frameworks with 3-periodic network with monometallic SBU for 1 and 3-periodic network with 2-fold interpenetration feature for 2. Both the MOFs displayed good turn-off luminescence sensing against nitroaromatic compounds especially MNP. Also, the photocatalytic properties for both the MOFs demonstrated that they can be used as photocatalyst to photo-degrade aromatic dyes. It can be concluded that temperature tuned synthesis can yield MOFs with different framework which lead to differences in band gap. These structural and electronic differences induce variation in luminescence sensing as well as photocatalytic properties in these MOFs.
Experimental
Materials and method
All the reagents used for the synthesis were commercially available and employed without further purification. Powder X-ray diffraction (PXRD) was collected using Bruker ADVANCE X-ray diffractometer with Cu-Kα radiation (λ = 1.5418 Å) at 50 kV, 20 mA with a scanning rate of 6° min−1 and a step size of 0.02°. Fourier transform infrared (FT-IR) spectrum as KBr pellet was recorded using Nicolet Impact 750 FTIR in the range of 400–4000 cm−1. Thermogravimetric analysis was performed under N2 atmosphere from room temperature to 900 °C at a heating rate of 10 °C min−1. The photocatalytic activity studies were carried out using Shimadzu UV-Vis 2501PC recording spectrophotometer.
X-ray crystallography
The single crystal X-ray diffraction data were collected on a Bruker SMART APEX diffractometer that was equipped with graphite monochromated MoKα radiation (λ = 0.71073 Å) by using ω-scan technique. The structures were solved by direct method (SHLEXS-2014) and refined using the full-matrix least-squares procedure based on F2 (Shelxl-2014).25 All the hydrogen atoms were generated geometrically and refined isotropically using a riding model. All non-hydrogen atoms were refined with anisotropic displacement parameters. Crystallographic details and selected bond dimensions for MOFs 1 and 2 are listed in Tables S1 and S2,† respectively. CCDC number: 1909396 and 1909397.
Synthesis of 1
A mixture of H4L (0.05 mmol, 0.023 g), bpz (0.10 mmol, 0.020 g), Cd(NO3)2·6H2O (0.15 mmol, 0.044 g) and 12 mL of H2O was stirred for 30 min and then transferred and sealed in a 25 mL Teflon-lined reactor and heated to 180 °C for 72 h, and then cooled to room temperature at a rate of 5 °C h−1. Crystals of 1 were obtained in 71% yield based on cadmium. IR: 3421(vs); 2914(m); 1704(vs); 1602(v); 1526(m); 1388(v); 1281(m); 1045(m); 932(m); 757(m); 686(m).
Synthesis of 2
The synthesis procedure of 2 was analogous to that of 1, except that reaction temperature was decreased to 120 °C. Colorless block crystals of 2 were obtained in 47% yield based on cadmium. IR: 3445(v); 2902(m); 1702(vs); 1527(m); 1455(m); 1366(v); 1260(m); 1106(m); 1036(m); 755(m); 688(m).
Photoluminescence measurements
The photoluminescence property of 2 was investigated in aqueous suspensions at room temperature using a RF-5301PC spectrofluorophotometer. These suspensions were prepared by adding 5 mg of finely divided 2 into 3 mL of water, thereafter the suspensions were kept for overnight. Finally, the mixtures were ultrasonically agitated for 30 min before testing.
Photocatalytic method
The sample of MOFs 1 or 2 (80 mg) was dispersed in 50 mL aqueous solution of methyl violet (10 mg L−1) with stirring in dark for 30 min to ensure the establishment of adsorption–desorption equilibrium. Thereafter, the photocatalytic degradation of MV was conducted on XPA-7 type photochemical reactor having 100 W mercury lamp (mean wavelength 365 nm) with light intensity of 12.7 mW cm−2 at quartz tube positions. During photocatalytic degradation reaction, aliquots of 5.0 mL were taken out from the reaction mixture at specific time intervals and separated through centrifugation and then subsequently analysed using UV-Vis spectrophotometer. Additionally, a control experiment was conducted under the identical conditions without adding MOF based catalysts 1 or 2.
Computational details
The mechanism for the decline in the luminescent intensity of 1 and 2 in presence of NACs as well as their photocatalytic properties and to ascertain the nature of highest occupied molecular orbitals (HOMO) and lowest unoccupied molecular orbital (LUMO) of different analytes, as well as MOFs, density functional theory (DFT) calculations were performed. The geometry optimizations were performed using the B3LYP exchange-correlation functional.26 For all the atoms except Cd 6-31G** basis set was used while for Cd CEP-121G basis set was employed for geometry optimization. All the calculations were performed using Gaussian 09 programme.27 GaussSum 3.1 was used to obtain density of state (DOS) plots.28
Conflicts of interest
The authors declare no conflict of interest.
Acknowledgements
The authors acknowledge financial assistance from Sichuan University of Science and Engineering (no. 2015RC23 and 2017RCL02), the Education Committee of Sichuan Province (no. 17ZA0265, 18ZB0422 and 18ZB0425), the Department of Science and Technology of Sichuan Province (no. 2017JY0129), the Project of Zigong Science & Technology (No. 2016HG04 and 2018YYJC01), the Opening Project of Key Laboratory of Green Chemistry of Sichuan Institutes of Higher Education (No: LZJ1705) and the Student's Platform for Innovation and Entrepreneurship Training Program (201810622053). AK is grateful to Council of Scientific and Industrial Research, New Delhi for the financial support in the form of project no. 01(2899)/17/EMR-II. The authors would like to extend their sincere appreciation to the Deanship of Scientific Research at King Saud University for funding this work through research group project number RG-1440-076.
References
-
(a) A. Pal, S. Chand, J. C. Boquera, F. Lloret, J. B. Lin, S. C. Pal and M. C. Das, Inorg. Chem., 2019, 58, 6246 CrossRef CAS PubMed;
(b) J. Q. Liu, G. L. Liu, C. Y. Gu, W. C. Liu, J. W. Xu, B. H. Li and W. J. Wang, J. Mater. Chem. A, 2016, 4, 11630 RSC.
-
(a) Y. Hong, Q. Q. Zhang, Y. Y. He and B. Z. Wang, J. Mol. Struct., 2019, 1183, 1 CrossRef CAS;
(b) X. F. Xue, Y. Q. Liu, Q. Liu, X. Y. Wang and W. Li, J. Cluster Sci., 2019, 30, 777 CrossRef CAS;
(c) L. E. Kreno, K. Leong, O. K. Farha, M. Allendorf, R. P. Van Duyne and J. T. Hupp, Chem. Rev., 2012, 112, 1105 CrossRef CAS;
(d) X. Feng, J. S. Zhao, B. Liu, L. Y. Wang, J. G. Wang, S. W. Ng, G. Zhang, X. G. Shi and Y. Y. Liu, Cryst. Growth Des., 2010, 10, 1399 CrossRef CAS.
-
(a) K. Shen, J. Chen, X. Chen, J. Long, R. Q. Lu, L. Zhang, Y. Li and B. Chen, Science, 2018, 359, 206 CrossRef CAS PubMed;
(b) Y. Zhao, L. Wang, N. N. Fan, M. L. Han, G. P. Yang and L. F. Ma, Cryst. Growth Des., 2018, 18, 7114 CrossRef CAS.
-
(a) J. Lee, O. K. Farha, J. Roberts, K. A. Scheidt, S. T. Nguyen and J. T. Hupp, Chem. Soc. Rev., 2009, 38, 1450 RSC;
(b) L. L. Liu, C. X. Yu, Y. R. Li, J. J. Han, F. J. Ma and L. F. Ma, CrystEngComm, 2015, 17, 653 RSC.
-
(a) L. Hou, B. Liu, L. N. Jia, L. Wei, Y. Y. Wang and Q. Z. Shi, Cryst. Growth Des., 2013, 13, 701 CrossRef CAS;
(b) W. J. Shi, L. Y. Du, H. Y. Yang, K. Zhang, L. Hou and Y. Y. Wang, Inorg. Chem., 2017, 56, 10090 CrossRef CAS;
(c) M.-L. Han, Y.-P. Duan, D.-S. Li, G.-W. Xu, Y.-P. Wu and J. Zhao, Dalton Trans., 2014, 43, 17519–17527 RSC.
-
(a) L. Y. Du, W. J. Shi, L. Hou, Y. Y. Wang, Q. Z. Shi and Z. Zhu, Inorg. Chem., 2013, 52, 14018 CrossRef CAS PubMed;
(b) J. H. Qin, Y. Jia, H. Li, B. Zhao, D. Wu, S. Q. Zang, H. Hou and Y. Fan, Inorg. Chem., 2014, 53, 685–687 CrossRef CAS PubMed.
-
(a) G. X. Liu, H. Xu, H. Zhou, S. Nishihara and X. M. Ren, CrystEngComm, 2012, 14, 1856 RSC;
(b) J. Q. Liu, W. J. Wang, Z. D. Luo, B. H. Li and D. Q. Yuan, Inorg. Chem., 2017, 56, 10215 CrossRef CAS PubMed.
-
(a) L. Lu, W. C. Liu, J. Wang, H. R. Zhong, J. Q. Liu, A. K. Singh and A. Kumar, Inorg. Chim. Acta, 2019, 487, 257 CrossRef CAS;
(b) L. L. Liu, C. X. Yu, J. Sun, P. P. Meng, F. J. Ma, J. M. Du and L. F. Ma, Dalton Trans., 2014, 43, 2915 RSC;
(c) J. Q. Liu, G. P. Li, W. C. Liu, Q. L. Li, B. H. Li, R. W. Gable, L. Hou and S. R. Batten, ChemPlusChem, 2016, 81, 1299 CrossRef CAS.
-
(a) Y. Zhao, X. G. Yang, X. M. Lu, C. D. Yang, N. N. Fan, Z. T. Yang, L. Y. Wang and L. F. Ma, Inorg. Chem., 2019, 58, 6215 CrossRef CAS PubMed;
(b) X. Feng, C. Xu, Z. Wang, S. Tang, W. Fu, B. Ji and L. Y. Wang, Inorg. Chem., 2015, 54, 2088 CrossRef CAS PubMed;
(c) K. K. Kartha, S. S. Babu, S. Srinivasan and A. Ajayaghosh, J. Am. Chem. Soc., 2012, 134, 4834 CrossRef CAS;
(d) X. J. Liang, X. D. Chen and J. C. Zhao, Chem. Soc. Rev., 2014, 43, 473 RSC.
-
(a) D. Sun, Y. Ke and T. M. Mattox, Chem. Commun., 2005, 5447 RSC;
(b) Y. X. Sun and W. Y. Sun, Chin. Chem. Lett., 2014, 25, 823 CrossRef CAS;
(c) P. M. Forster, A. R. Burbank, C. Livage, G. Férey and A. K. Cheetham, Chem. Commun., 2004, 368 RSC;
(d) M. Dan and C. N. R. Rao, Angew. Chem., Int. Ed., 2006, 45, 281 CrossRef CAS PubMed.
-
(a) S. Tunsrichon, J. Boonmak and S. Youngme, Cryst. Growth Des., 2019, 19, 2139 CrossRef CAS;
(b) H. Wang, W. Meng, J. Wu, J. Ding, H. Hou and Y. Fan, Coord. Chem. Rev., 2016, 307, 130–146 CrossRef CAS;
(c) X. Feng, R. F. Li and L. Y. Wang, CrystEngComm, 2015, 17, 7878 RSC.
- H. He, D. Y. Zhang, F. Guo and F. Sun, Inorg. Chem., 2018, 57, 7314 CrossRef CAS PubMed.
- N. Singh, U. P. Singh and R. J. Butcher, CrystEngComm, 2017, 19, 7009 RSC.
-
(a) D. Banerjee, Z. Hu and J. Li, Dalton Trans., 2014, 43, 10668 RSC;
(b) X. X. Wang, X. Q. Wang, X. Y. Niu and T. P. Hu, CrystEngComm, 2016, 18, 7471 RSC;
(c) X. Wang, L. Zhang, J. Yang, F. Liu, F. Dai, R. Wang and D. Sun, J. Mater. Chem. A, 2015, 3, 12777 RSC;
(d) M. Ji, C. Hao, D. D. Wang, H. J. Li and J. S. Qiu, Dalton Trans., 2013, 42, 3464–3470 RSC;
(e) G. Mehlana and A. Bourne, CrystEngComm, 2017, 19, 4238–4259 RSC.
- Y. N. Gong, S. Y. Zhang, P. Xiong, Y. R. Xie, Z. Y. Du and D. C. Zhong, J. Coord. Chem., 2016, 69, 996 CrossRef CAS.
- L. L. Zhang, Z. X. Kang, X. L. Xin and D. F. Sun, CrystEngComm, 2016, 18, 193 RSC.
-
(a) J. Li, G. P. Yang, L. Hou, L. Cui, Y. P. Li, Y. Y. Wang and Q. Z. Shi, Dalton Trans., 2013, 42, 13590 RSC;
(b) Y. J. Yang, M. J. Wang and K. L. Zhang, J. Mater. Chem. C, 2016, 4, 11404 RSC;
(c) S. Zhao, X. X. Lv, L. L. Shi, B. L. Li and B. Wu, RSC Adv., 2016, 6, 56035 RSC;
(d) S. Zhao, J. G. Ding, T. R. Zheng, K. Li, B. L. Li and B. Wu, J. Lumin., 2017, 188, 356 CrossRef CAS.
-
(a) A. Lan, K. Li, H. Wu, D. H. Olson, T. J. Emge, W. Ki, M. Hong and J. Li, Angew. Chem., Int. Ed., 2009, 48, 233 CrossRef PubMed;
(b) S. Pramanik, C. Zheng, X. Zhang, T. J. Emge and J. Li, J. Am. Chem. Soc., 2011, 133, 4153 CrossRef CAS;
(c) Z. Zhang, S. Xiang, X. Rao, Q. Zheng, F. R. Fronczek, G. Qian and B. Chen, Chem. Commun., 2010, 46, 7205 RSC;
(d) C. Zhang, Y. Che, Z. Zhang, X. Yang and L. Zang, Chem. Commun., 2011, 47, 2336 RSC;
(e) L. E. Kreno, K. Leong, O. K. Farha, M. Allendorf, R. P. Van Duyne and J. T. Hupp, Chem. Rev., 2012, 112, 1105 CrossRef CAS PubMed;
(f) R.-B. Lin, S.-Y. Liu, J.-W. Ye, X.-Y. Li and J.-P. Zhang, Adv. Sci., 2016, 3, 1500434 CrossRef PubMed.
-
(a) T. K. Kim, J. H. Lee, D. Moon and H. R. Moon, Inorg. Chem., 2013, 52, 589 CrossRef CAS PubMed;
(b) Q. Zheng, F. Yang, M. Deng, Y. Ling, X. Liu, Z. Chen, Y. Wang, L. Weng and Y. Zhou, Inorg. Chem., 2013, 52, 10368 CrossRef CAS PubMed;
(c) G. Y. Wang, L. L. Yang, Y. Li, H. Song, W. J. Ruan, Z. Chang and X. H. Bu, Dalton Trans., 2013, 42, 12865 RSC;
(d) S. Pramanik, C. Zheng, X. Zhang, T. J. Emge and J. Li, J. Am. Chem. Soc., 2011, 133, 4153 CrossRef CAS PubMed.
-
(a) Q. D. Luo, Z. Zhu, C. B. Fan, Z. A. Zong, C. G. Xu, C. F. Bi and Y. H. Fan, J. Mol. Struct., 2019, 1188, 57 CrossRef CAS;
(b) Q. Sun, J. Lu, J. L. Li, L. Jiang, W. Gu, X. Liu, J. L. Tian and S. P. Yan, Appl. Organomet. Chem., 2014, 28, 259 CrossRef CAS;
(c) J. M. Hu, R. Guo, Y. G. Liu and G. H. Cui, Inorg. Chim. Acta, 2016, 450, 418 CrossRef CAS.
-
(a) A. Q. Ma, J. Wu, Y. T. Han, F. M. Chen, B. H. Li, S. G. Cai, H. Huang, A. Singh, A. Kumar and J. Q. Liu, Dalton Trans., 2018, 47, 9627 RSC;
(b) X. R. Wu, X. Shen, S. R. Fan, M. Trivedi, B. H. Li, A. Kumar and J. Q. Liu, RSC Adv., 2018, 8, 23529 RSC;
(c) S. L. Cai, L. Lu, W. P. Wu, J. Wang, Y. C. Sun, A. Q. Ma, A. Singh and A. Kumar, Inorg. Chim. Acta, 2019, 484, 291 CrossRef CAS;
(d) J. Wang, D. Zhou, G. L. Wang, L. Lu, Y. Pan, A. Singh and A. Kumar, Inorg. Chim. Acta, 2019, 492, 186 CrossRef CAS;
(e) Y. Pan, W. C. Liu, D. Liu, Q. J. Ding, J. Q. Liu, H. J. Xu, M. Trivedi and A. Kumar, Inorg. Chem. Commun., 2019, 100, 92 CrossRef CAS.
-
(a) W. T. Xu, L. Ma, F. Ke, F. M. Peng, G. S. Xu, Y. H. Shen, J. F. Zhu, L. G. Qiu and Y. P. Yuan, Dalton Trans., 2014, 43, 3792 RSC;
(b) L. L. Liu, C. X. Yu, J. M. Du, S. M. Liu, J. S. Cao and L. F. Ma, Dalton Trans., 2016, 45, 12352 RSC.
-
(a) C. C. Wang, J. R. Li, X. L. Lv, Y. Q. Zhang and G. Guo, Energy Environ. Sci., 2014, 7, 2831 RSC;
(b) H. Wang, C. Huang, Y. Han, Z. Shao, H. Hou and Y. Fan, Dalton Trans., 2016, 45, 7776–7785 RSC.
- Q. Ding, Y. Pan, Y. Luo, M. Zhou, Y. Guan, B. Li, M. Trivedi, A. Kumar and J. Q. Liu, ACS Omega, 2019, 4, 10775–10783 CrossRef CAS PubMed.
- G. M. Sheldrick, Acta Crystallogr., Sect. A: Found. Adv., 2015, 3, 71 Search PubMed.
-
(a) A. D. Becke, J. Chem. Phys., 1993, 98, 5648 CrossRef CAS;
(b) C. T. Lee, W. T. Yang and R. G. Parr, Phys. Rev. B: Condens. Matter Mater. Phys., 1998, 37, 785 CrossRef.
- M. J. Frisch, G. W. Trucks, H. B. Schlegel, G. E. Scuseria, M. A. Robb, J. R. Cheeseman, J. A. Montgomery, J. T. Vreven, K. N. Kudin, J. C. Burant, J. M. Millam, S. S. Iyengar, J. Tomasi, V. Barone, B. Mennucci, M. Cossi, G. Scalmani, N. Rega, G. A. Petersson, H. Nakatsuji, M. Hada, M. Ehara, K. Toyota, R. Fukuda, J. Hasegawa, M. Ishida, T. Nakajima, Y. Honda, O. Kitao, H. Nakai, M. Klene, X. Li, J. E. Knox, H. P. Hratchian, J. B. Cross,V. Bakken, C. Adamo, J. Jaramillo, R. Gomperts, R. E. Stratmann, O. Yazyev, A. J. Austin, R. Cammi, C. Pomelli, J. W. Ochterski, P. Y. Ayala, K. Morokuma, G. A. Voth, P. Salvador, J. J. Dannenberg, V. G. Zakrzewski, S. Dapprich, A. D. Daniels, M. C. Strain, O. Farkas, D. K. Malick, A. D. Rabuck, K. Raghavachari, J. B. Foresman, J. V. Ortiz, Q. Cui, A. G. Baboul, S. Clifford, J. Cioslowski, B. B. Stefanov, G. Liu, A. Liashenko, P. Piskorz, I. Komaromi, R. L. Martin, D. J. Fox, T. Keith, M. A. Al-Laham, C. Y. Peng, A. Nanayakkara, M. Challacombe, P. M. W. Gill, B. Johnson, W. Chen, W. M. Wong, C. Gonzalez and J. A. Pople, Gaussian, Inc., Walling ford CT, 2009.
- N. M. O'Boyle, A. L. Tenderholt and K. M. Langner, J. Comput. Chem., 2008, 29, 839–845 CrossRef.
Footnote |
| † Electronic supplementary information (ESI) available. CCDC 1909396 and 1909397. For ESI and crystallographic data in CIF or other electronic format see DOI: 10.1039/c9ra05167h |
|
| This journal is © The Royal Society of Chemistry 2019 |
Click here to see how this site uses Cookies. View our privacy policy here. 
 Open Access Article
 This Open Access Article is licensed under a Creative Commons Attribution-Non Commercial 3.0 Unported Licence
 c,
Ahmad Alowaisd,
Abdullah Alarifid,
Abhinav Kumar
c,
Ahmad Alowaisd,
Abdullah Alarifid,
Abhinav Kumar