 Open Access Article
Pressure-induced enhancement of thermoelectric power factor in pristine and hole-doped SnSe crystals
Na Suab,
B. C. Qinc,
K. J. Zhuab,
Z. Y. Liuad,
P. Shahiaf,
J. P. Suna,
B. S. Wangabe,
Y. Suid,
Y. G. Shiabe,
L. D. Zhao c and
J.-G. Cheng
 *abe
*abe
aBeijing National Laboratory for Condensed Matter Physics, Institute of Physics, Chinese Academy of Sciences, Beijing 100190, China. E-mail: jgcheng@iphy.ac.cn
bSchool of Physical Sciences, University of Chinese Academy of Sciences, Beijing 100190, China
cSchool of Materials Science and Engineering, Beihang University, Beijing 100191, China
dSchool of Physics, Harbin Institute of Technology, Harbin 15001, China
eSongshan Lake Materials Laboratory, Dongguan, Guangdong 523808, China
fDepartment of Physics, D. D. U. Gorakhpur University, Gorakhpur-273009, India
First published on 28th August 2019
Abstract
We evaluate the influence of pressure on the thermoelectric power factors PF ≡ S2σ of pristine and Na-doped SnSe crystals by measuring their electrical conductivity σ(T) and Seebeck coefficient S(T) up to ∼22 kbar with a self-clamped piston-cylinder cell. For both cases, σ(T) is enhanced while S(T) reduced with increasing pressure as expected, but their imbalanced variations lead to a monotonic enhancement of PF under pressure. For pristine SnSe, σ(290 K) increases by ∼4 times from ∼10.1 to 38 S cm−1, while S(290 K) decreases by only ∼12% from 474 to 415 μV K−1, leading to about three-fold enhancement of PF from 2.24 to 6.61 μW cm−1 K−2, which is very close to the optimal value of SnSe above the structural transition at ∼800 K at ambient pressure. In comparison, the PF of Na-doped SnSe at 290 K is enhanced moderately by ∼30% up to 20 kbar. In contrast, the PF of isostructural black phosphorus with a simple band structure was found to decrease under pressure. The comparison with black phosphorus indicates that the multi-valley valence band structure of SnSe is beneficial for the enhancement of PF by retaining a large Seebeck coefficient under pressure. Our results also provide experimental confirmation on the previous theoretical prediction that high pressure can be used to optimize the thermoelectric efficiency of SnSe.
Introduction
Thermoelectric (TE) materials have attracted considerable attention in recent years because they can directly convert waste heat into useful electrical energy.1 The conversion efficiency of TE materials is characterized by the dimensionless figure of merit, ZT ≡ S2σT/κ, where S is the Seebeck coefficient, σ is the electrical conductivity, κ is the thermal conductivity, and T is the absolute temperature. The ZT value of TE materials should be improved to ≥3 for a widespread usage economically, whereas the most efficient TE materials so far have ZT values around 2. Thus, much effort has been devoted to develop new TE materials to achieve a high ZT.2–4One important recent development is the discovery of exceptional TE performance in SnSe crystal with a high ZT value of 2.6 ± 0.3 at 923 K along the b-axis, which has been attributed to an intrinsically ultralow κ as a result of strong anharmonic bonding.5,6 At ambient condition, SnSe adopts a layered orthorhombic crystal structure with space group Pnma (no. 62), inset of Fig. 1, featured by corrugated two-atom-thick SnSe slabs within the bc plane. Upon heating, SnSe undergoes a displacive structural transition to a higher symmetry Cmcm phase at about 750–800 K. Although the TE performance of SnSe crystal is superior above 800 K in the high-T Cmcm phase, its performance in the low-T Pnma phase is marginal, e.g. ZT ∼ 0.12 at room temperature.5 Such characteristics limit its practical usage over a wide temperature range. Therefore, there have been extensive follow-up investigations on SnSe and related materials aiming to further improve their TE performances through various approaches.7–17 Among them, the most commonly used one is the chemical substitutions for Sn/Se or introducing vacancies.
Although the carrier doping approach is very effective on improving the TE properties of SnSe, to understand the underlying mechanisms is complicated by the concurrent factors such as carrier centration, lattice disorders or defects, etc. In comparison, Zhang et al.,18 by employing a computational method, proposed that the application of high pressure can intrinsically enhance the TE properties of SnSe in the low-T Pnma phase due to a significant enhancement of power factor PF ≡ S2σ. Because S and σ are two anti-correlated transport quantities that are closely related with each other, the enhancement of PF would suggest a peculiar electronic band structure that promotes imbalanced contributions to these two transport properties under pressure. In particular, the multiple electronic valence bands in SnSe have been argued to be responsible for the ultra-high PF.6 An experimental verification for this prediction can thus shed more light on the mechanism of excellent TE performance in SnSe, in addition to providing other means to optimize its performance.
To this end, we have performed a simultaneous measurement of σ(T) and S(T) on SnSe crystals under various pressures up to 22 kbar with a piston cylinder type high-pressure cell. Our results confirm the prediction by Zhang et al.,18 and reveal a three-fold enhancement of PF from ambient pressure to 22 kbar, without showing a trend of saturation under higher pressures. We also observe a moderate enhancement of PF on Na-doped SnSe crystal under pressure, whereas the PF of isostructural black phosphorus with a single band is found to decrease in the similar pressure range. The comparison with black phosphorous underlines the importance of multiple valley electronic band structure in retaining a large Seebeck coefficient so as to boost the PF of SnSe under pressure.
Experimental
Sample preparation and characterizations
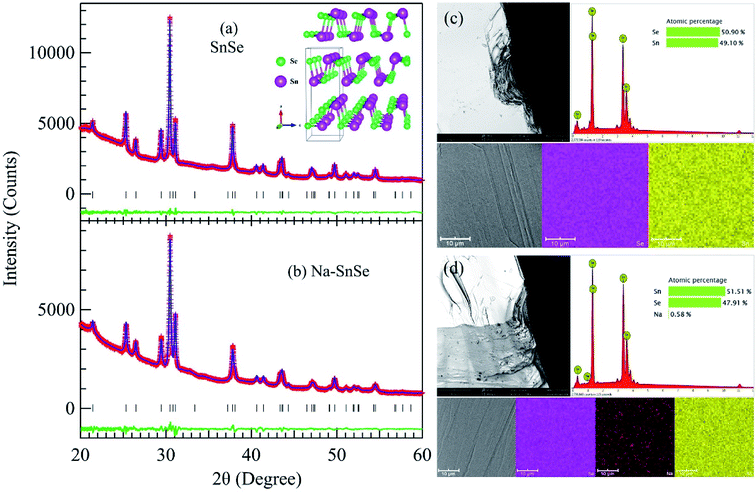
Crystals of pristine and Na-doped SnSe were prepared by the vertical Bridgman method. High-purity elemental constitutes of Sn, Se, and Na were weighted in a stoichiometric ratio of SnSe and Sn0.985Na0.015Se. The starting chemicals were loaded into carbon-coated conical silicon tubes under a glove box with nitrogen atmosphere. The tubes were evacuated and flame-sealed under pressure of ∼10−3 Pa. The outer tubes were used to prevent samples from oxidation because the inner tubes could break caused by high-temperature phase transition. The tubes were then loaded into vertical furnace, heated up to 1313 K at rate of 10 K min−1 and soaked for 10 h, subsequently cooled to 1073 K at a slow rate of 1 K h−1 and then furnace cooled to room temperature. Finally, the pristine and Na-doped SnSe crystals with diameter of ∼12 mm and length of ∼30 mm were obtained. Details about the sample preparation and characterizations can also be found elsewhere.5,6Phase purity of the studied crystals has been verified at room temperature with powder X-ray diffraction (XRD) by using Cu-Kα radiation (λ = 1.5406 Å). Fig. 1(a) and (b) displays the XRD patterns after Rietveld refinements for pristine and Na-doped SnSe, respectively. No secondary phase is detectable for both samples, signaling a high purity for the studied crystals. The refinements were performed in the orthorhombic structure defined in space group Pnma (no. 62) with Sn and Se atoms both placed at 4c (x, 1/4, z) sites. As illustrated in Fig. 1(a) and (b), the refinement converged well with small reliability factors, i.e. Rp = 1.49%, Rwp = 1.96% for SnSe, and Rp = 1.53%, Rwp = 2.06% for Na–SnSe, respectively. The obtained lattice parameters, a = 11.4913(4) Å, b = 4.1504(1) Å, c = 4.4411(2) Å, and V = 211.81(1) Å3 for SnSe, and a = 11.4983(5) Å, b = 4.1500(2) Å, c = 4.4376(3) Å, and V = 211.75(2) Å3 for Na–SnSe, are close to those reported previously.5,6 It also reveals that the influence of small Na doping on the lattice parameters of SnSe is negligible.
The morphology and the chemical composition for the studied crystals are further characterized by a Phenom scanning electron microscope (SEM) equipped with energy-dispersive X-ray spectroscopy (EDS). The results for pristine and Na-doped SnSe are summarized in Fig. 1(c) and (d), respectively. Flat surfaces with layered structure for both samples can be viewed clearly from the SEM images in Fig. 1(c) and (d). The EDS maps confirm a uniform element distribution in both samples, and the statistical EDS analyses reveal a slight off-stoichiometry for the pristine and Na-doped SnSe with Sn vacancies.
High-pressure setup for TE property measurements
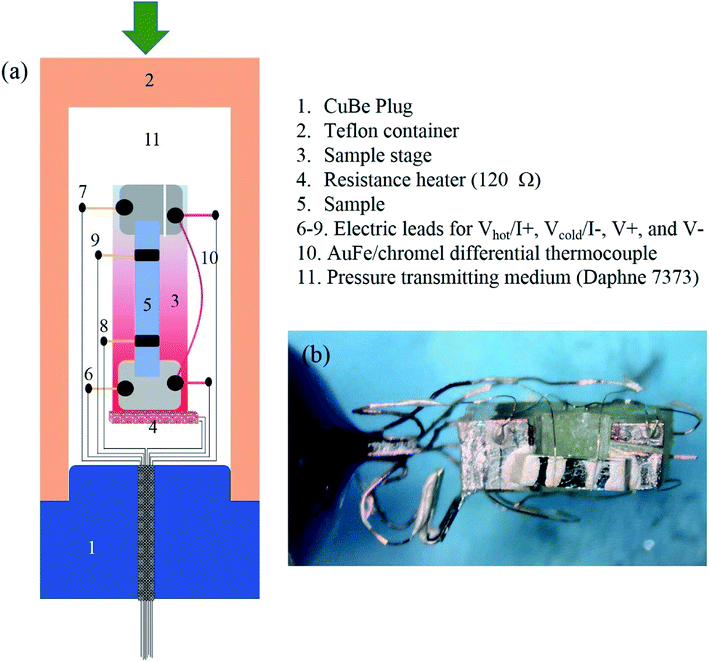
The crystals were oriented with the Laue back diffraction method and cut into a rectangular shape with the longest dimension along the orthorhombic b-axis. Temperature dependencies of Seebeck coefficient, S(T), and electrical conductivity, σ(T), under various pressures were measured simultaneous in a self-clamped piston-cylinder cell (PCC). A standard four-probe method was used to measure σ(T) with the current applied along the b-axis; while a steady-state method was employed to measure S(T) in a home-made setup.19 A schematic drawing of the setup inside the PCC is shown in Fig. 2(a), and a picture of the sample assembly inside the Teflon container is given in Fig. 2(b). The temperature gradient ΔT/T ∼ 1% for S(T) measurements was created across the sample via applying electrical current to a resistance heater (∼120 Ω) attached to one end of the sample stage. The absolute value of ΔT at each temperature was recorded with an AuFe/chromel differential thermocouple with an accuracy of 0.2%. The precision for the S(T) measurement is about 0.5 μV K−1. The electric leads to measure the voltage difference ΔV = Vhot − Vcold of Seebeck coefficient also serve as the current leads, I+ and I−, for resistivity measurements, during which no temperature gradient was created. Daphne 7373 was used as the pressure transmitting medium. The pressure inside the pressure cell was determined at room temperature by using the manganin wire resistance gauge.Results and discussion
Pressure-induced enhancement of PF in pristine SnSe
Fig. 3(a) shows the σ(T) of pristine SnSe below 300 K under various pressures up to 22.5 kbar. For our studied sample, the room-temperature σ at 1 bar is about 10 S cm−1, which is close to that reported previously.5 Upon cooling down, σ(T) increases gradually, and exhibits a metallic rather than an intrinsic semiconducting behavior. This is caused by a slight hole doping due to the presence of Sn vacancies as verified by the EDS measurements, Fig. 1(c). As shown in Fig. 3(a), the measurements of σ(T) at the first two pressures were terminated at ∼200 K because the contact resistance became too large to get reliable data at low temperatures. This issue was overcome at higher pressures when the electrical contacts are improved. As can be seen, the application of high pressure boosts the σ(T) of pristine SnSe in the whole temperature range; the room-temperature σ increases from ∼10 S cm−1 at 1 bar to ∼38 S cm−1 at 22 kbar, also shown in Fig. 5(a), which is nearly four-fold enhancement. The σ(T) at high pressures retains a metallic behavior over a wide temperature range from 300 K down to ∼50–70 K, below which a shallow downturn appears. The maximum conductivity at low temperatures can reach ∼170 S cm−1 at 22.5 kbar. According to the band-structure calculations under pressure,18,20 the essential features of most bands keep intact in the investigated pressure range, but pressure-induced reduction of band gap should be responsible for the observed enhancement of electrical conductivity.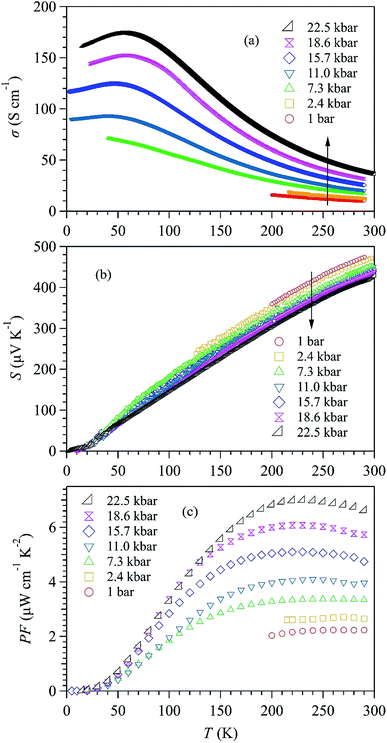 | ||
| Fig. 3 Temperature dependence of (a) electrical conductivity σ(T), (b) Seebeck coefficient S(T), and (c) power factor PF ≡ S2σ of pristine SnSe crystal under various pressures up to 22.5 kbar. | ||
The increase of σ(T) should usually be accompanied by a decrease of S(T), but the PF depends on the relative change of these two anti-correlated parameters. As shown in Fig. 3(b), for all pressures S(T) increases with temperature, consistent with the metallic behavior of σ(T) shown in Fig. 3(a). As expected, S(T) in the whole temperature range is indeed reduced gradually upon applying pressure, but the reduction is rather moderate. The S value at room temperature decreases by only ∼13% from ∼480 μV K−1 at 1 bar to ∼420 μV K−1 at 22.5 kbar, also shown in Fig. 3(b). Such a moderate change of S(T) is in sharp contrast to the strong enhancement of σ(T) shown in Fig. 3(a). The robustness of S(T) against pressure indicates that the unique multiple valley valence band structure is preserved under pressure.
The strong enhancement of σ(T) accompanied with a moderate reduction of S(T) under pressure gives rise to a strong boost of PF for pristine SnSe, as illustrated in Fig. 3(c). In addition, PF(T) exhibits a broad plateau and almost parallel enhancement over a wide temperature range between 150 and 300 K. The PF of SnSe at 290 K increases by 3 times from ∼2.24 μW cm−1 K−2 at 1 bar to 6.61 μW cm−1 K−2 at 22.5 kbar. As shown in Fig. 5(c), the PF (290 K) increases almost linearly with pressure, without showing any saturation up to 22.5 kbar. As a matter of fact, the PF (290 K) at 22.5 kbar is close to the optimal PF values in the high-T Cmcm phase at ambient pressure.5,9 Our results thus confirmed the theoretical prediction that pressure can intrinsically enhance the TE properties of SnSe over a wide temperature region in the low-T Pnma phase.18
Pressure-induced enhancement of PF in Na-doped SnSe
To check if the high-pressure approach is universal for the SnSe-based TE materials, we performed similar measurements on Na-doped SnSe up to 19.2 kbar. The results are displayed in Fig. 4(a–c). Because the carrier concentration of Na–SnSe is about two orders higher than that of the pristine sample,6 the Na-doped SnSe exhibits a much larger σ ∼ 830 S cm−1 yet a lower S ∼ 200 μV K−1 at room temperature. Similar with those of pristine SnSe, the σ(T) of Na–SnSe also increases while S(T) decreases upon applying pressure, as shown in Fig. 4(a) and (b). However, their relative changes under pressure are different from those of pristine SnSe. As illustrated in Fig. 5(a) and (b), when increasing pressure from 1 bar to 19.2 kbar on the Na-doped SnSe at room temperature, its σ(290 K) increases by ∼3 times from 830 to 2445 S cm−1, while the S decreases by ∼30% from ∼200 to 134 μV K−1. As a result, the enhancement of PF is marginal as illustrated in Fig. 4(c). In addition, the PF enhancement appears mainly in the low-pressure region near room temperature. The PF at 12.2 kbar almost overlaps with that at 19.2 kbar. As shown in Fig. 5(c), PF (290 K) increases from 33.2 μW cm−1 K−2 at 1 bar to 43.9 μW cm−1 K−2 at 19.25 kbar. In contrast to the linear increase with pressure for pristine SnSe, the PF of Na–SnSe tends to level off at higher pressures. These comparison thus underscores a peculiar pressure effect on the enhancement of PF in pristine SnSe.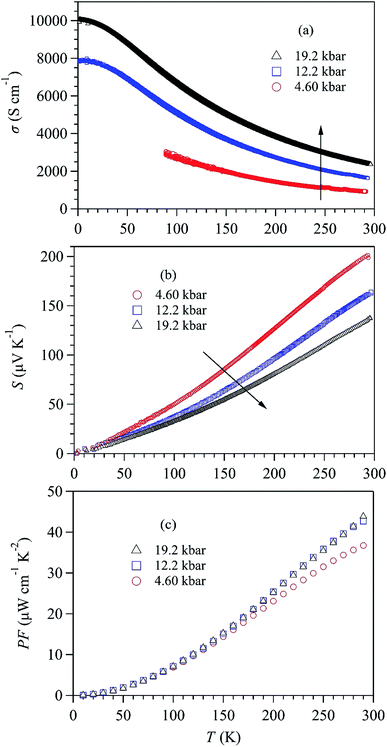 | ||
| Fig. 4 Temperature dependence of (a) electrical conductivity σ(T), (b) Seebeck coefficient S(T), and (c) power factor PF of Na-doped SnSe crystal under various pressures up to 19.2 kbar. | ||
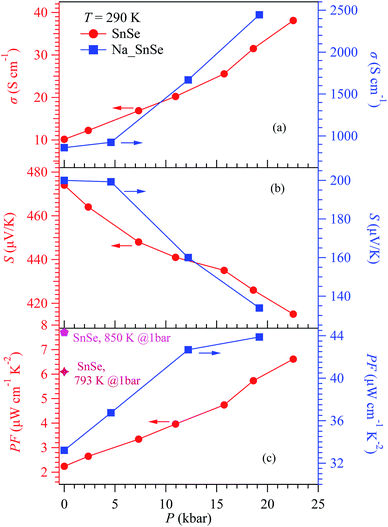 | ||
| Fig. 5 Pressure dependence of (a) conductivity σ, (b) Seebeck coefficient S, and (c) power factor PF at 290 K for pristine SnSe (left) and Na-doped SnSe (right). The PF values of SnSe at high temperatures and ambient pressure (pentagon and star symbols) in (c) are taken from ref. 5 and 9, respectively. | ||
Pressure-induced reduction of PF in black phosphorus
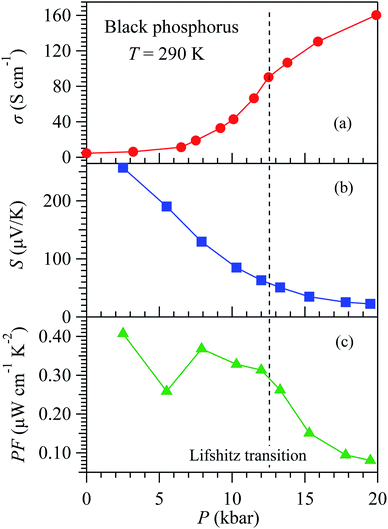
To further substantiate the underlying mechanism, a comparison with the pressure effect on black phosphorus (BP) is instructive, because it has a similar crystal structure as SnSe but much simpler band structure. Bulk BP is a narrow gap semiconductor with a direct energy gap ∼ 0.33 eV at Z point of Brillouin zone.21,22 Previous high-pressure studies have demonstrated a pressure-induced Lifshitz transition at about 12 kbar associated with the closure of the direct band gap.23 This leads to a significant enhancement of conductivity. As illustrated in Fig. 6(a), σ(290 K) of BP increases by 36 times from ∼4.4 S cm−1 at 1 bar to ∼160 S cm−1 at 20 kbar. The enhancement of conductivity in BP is much stronger than that seen in SnSe, Fig. 5(a), because the larger band gap of SnSe ∼ 0.6–0.8 eV cannot be closed by the applied pressure of ∼22 kbar.18 In the semimetal state of BP above 12 kbar, large positive magnetoresistance and Shubnikov–de Haas oscillations have been detected.23 In our recent study,24 we measured S(T) of BP under pressure and also evidenced the closure of the direct band gap at ∼10–12 kbar, manifested by the vanishing S(T) hump and the change of dS/dT near room temperature from negative to positive. As a result, the S(290 K) decreases by an order of magnitude from ∼260 μV K−1 at 1 bar to ∼23 μV K−1 at 20 kbar, as shown in Fig. 6(b). Then, the PF of BP can be calculated and is displayed in Fig. 6(c) as a function of pressure. Apparently, the PF experiences a strong reduction across the Lifshitz transition when the direct band gap is closed by pressure. It is noteworthy that the PF of BP also decreases gradually in the low-pressure region before closing the direct band gap. This fact demonstrates that the reduction of band gap in a simple semiconductor that enhances σ while reduces S simultaneously cannot guarantee a boost of PF. This is true in general because the enhancement of σ is usually overcome by the reduction of S2.Discussions
The distinct pressure effects on PF between SnSe and BP thus suggest that we cannot simply attribute the three-fold enhancement of PF in SnSe to the reduction of band gap18 or a Lifshitz transition.25 Instead, it should have a deep root on the unique band structure of SnSe. As shown by the DFT calculations18 and APRES experiments,26 SnSe in the Pnma phase has complex electronic valence bands, which are featured by multiple valence band maxima within a small energy range. The small energy gaps between these valence band maxima can be crossed by the Fermi level via hole doping. The experimental Seebeck coefficient at ambient pressure can only be reproduced by considering the multi-valley band structures.6 In contrast, a single band model cannot reproduce the experimental Seebeck coefficient even considering a large band effective mass enhancement. Thus, the unique electronic band structure with multiple valence band maxima lying close in energy is the key to realize enhanced Seebeck coefficient and PF at ambient pressure. If this feature is preserved under a moderate pressure, the Seebeck coefficient can retain a large value and thus ensure an enhanced PF under pressure.Conclusion
In summary, we have studied the pressure effect on the TE properties of pristine and holed-doped SnSe crystals. Our results reveal a three-fold enhancement of PF for pristine SnSe under a pressure to 22 kbar without showing a trend of saturation at higher pressures. We also observe a moderate enhancement of PF for Na-doped SnSe under pressure. In comparison with the monotonic reduction of PF in black phosphorus under pressure, our results underscore the importance of the unique electronic band structure of SnSe in producing the high Seebeck coefficient. The presence of multiple valence band maxima that preserves under pressure should play an important role in retaining a large Seebeck coefficient and thus an enhanced power factor by the application of high pressure.Author contributions
J. G. C. conceived and supervised this project. B. C. Q., K. J. Z., Y. G. S. and L. D. Z. prepared the single-crystal samples. N. S., Z. Y. L., P. S., J. P. S., B. S. W, and Y. S. carried out the measurements of thermoelectric properties under high pressure. N. S. and J. G. C. performed the data analysis and wrote the paper. All authors discussed the results and commented on the manuscript.Conflicts of interest
There are no conflicts to declare.Acknowledgements
This work is supported by the National Key R&D Program of China (Grant No. 2018YFA0305700, 2018YFA0305800, and 2017YFA0302901), the National Natural Science Foundation of China (Grant No. 11574377, 11834016, 11874400, 11774399), the Strategic Priority Research Program and Key Research Program of Frontier Sciences of the Chinese Academy of Sciences (Grant No. XDB07020100 and Grant No. QYZDB-SSW-SLH013) as well as the CAS Interdisciplinary Innovation Team. J. P. S. acknowledges support from the Postdoctoral Innovative Talent program. We thank Dr Laiquan Shen and Prof. Yanhui Liu for the SEM measurements.References
- J. He and T. M. Tritt, Science, 2017, 357, eaak9997 CrossRef PubMed.
- Z.-G. Chen, G. Han, L. Yang, L. Cheng and J. Zou, Prog. Nat. Sci.: Mater. Int., 2012, 22, 535 CrossRef.
- J. P. Heremans, M. S. Dresselhaus, L. E. Bell and D. T. Morelli, Nat. Nanotechnol., 2013, 8, 471 CrossRef CAS PubMed.
- K. Zhao, H. Duan, N. Raghavendra, P. Qiu, Y. Zeng, W. Zhang, J. Yang, X. Shi and L. Chen, Adv. Mater., 2017, 29, 1701148 CrossRef PubMed.
- L. D. Zhao, S. H. Lo, Y. S. Zhang, H. Sun, G. J. Tan, C. Uher, C. Wolverton, V. P. Dravid and M. G. Kanatzidis, Nature, 2014, 508, 373 CrossRef CAS PubMed.
- L. D. Zhao, et al., Science, 2016, 351, 141 CrossRef CAS PubMed.
- C. L. Chen, H. Wang, Y. Y. Chen, T. Day and G. J. Snyder, J. Mater. Chem. A, 2014, 2, 11171 RSC.
- E. K. Chere, Q. Zhang, K. Dahal, F. Cao, J. Mao and Z. F. Ren, J. Mater. Chem. A, 2016, 4, 1848 RSC.
- M. Jin, et al., ACS Appl. Mater. Interfaces, 2019, 11, 8051 CrossRef CAS PubMed.
- H. S. Kim, G. Choi, M. Y. Ha, D. H. Kim, S. H. Park, I. Chung and W. B. Lee, J. Solid State Chem., 2019, 270, 413 CrossRef CAS.
- V. Kucek, T. Plechacek, P. Janicek, P. Ruleova, L. Benes, J. Navratil and C. Drasar, J. Electron. Mater., 2016, 45, 2943 CrossRef CAS.
- J. R. Li, J. T. Xu, H. X. Wang, G. Q. Liu, X. J. Tan, H. Z. Shao, H. Y. Hu and J. Jiang, J. Mater. Sci.: Mater. Electron., 2018, 29, 18727 CrossRef CAS.
- C. C. Lin, D. Ginting, G. Kim, K. Ahn and J. S. Rhyee, Curr. Appl. Phys., 2018, 18, 1534 CrossRef.
- X. L. Shi, et al., Adv. Eng. Mater., 2019, 9, 1803242 Search PubMed.
- X. l. Shi, A. y. Wu, W. Liu, R. Moshwan, Y. Wang, Z. G. Chen and J. Zou, ACS Nano, 2018, 12, 11417 CrossRef CAS PubMed.
- P. C. Wei, et al., ACS Omega, 2019, 4, 5442 CrossRef CAS.
- B. Qin, D. Wang, W. He, Y. Zhang, H. Wu, S. J. Pennycook and L.-D. Zhao, J. Am. Chem. Soc., 2019, 141, 1141 CrossRef CAS PubMed.
- Y. S. Zhang, S. Q. Hao, L. D. Zhao, C. Wolverton and Z. Zeng, J. Mater. Chem. A, 2016, 4, 12073 RSC.
- P. Shahi, et al., Phys. Rev. X, 2018, 8, 021055 CAS.
- J. J. Yan, et al., Phys. Chem. Chem. Phys., 2016, 18, 5012 RSC.
- Y. Takao and A. Morita, Physica B+C, 1981, 105, 93 CrossRef CAS.
- Y. Takao, H. Asahina and A. Morita, J. Phys. Soc. Jpn., 1981, 50, 3362 CrossRef CAS.
- Z. J. Xiang, et al., Phys. Rev. Lett., 2015, 115, 186403 CrossRef CAS PubMed.
- X. Li, et al., Proc. Natl. Acad. Sci. U. S. A., 2018, 115, 9935 CrossRef CAS PubMed.
- T. Nishimura, et al., Phys. Rev. Lett., 2019, 122, 226601 CrossRef CAS PubMed.
- I. Pletikosić, F. Von Rohr, P. Pervan, P. K. Das, I. Vobornik, R. J. Cava and T. Valla, Phys. Rev. Lett., 2018, 120, 156403 CrossRef PubMed.
| This journal is © The Royal Society of Chemistry 2019 |

