 Open Access Article
A red-emitting Sr3La(1−x)Eux(AlO)3(BO3)4 phosphor with high thermal stability and color purity for near-UV-excited wLEDs†
Cheng Yuea,
Dachuan Zhu *a,
Qun Yana and
Yong Pub
aCollege of Material Science and Engineering, Sichuan University, Chengdu, Sichuan 610065, China. E-mail: zhudachuan@scu.edu.cn; Fax: +86 2885460830; Tel: +86 2885460830
bResearch Institute for New Materials Technology, Chongqing University of Arts and Sciences, Yongchuan, Chongqing 402160, China
First published on 22nd August 2019
Abstract
A high efficiency red-emitting Eu3+ doped Sr3La(AlO)3(BO3)4 phosphor has been calcined successfully through a traditional solid-state method, and the photoluminescence and cathode-luminescence properties of samples are investigated in detail. The result of density functional theory (DFT) calculation shows that the Sr3La(AlO)3(BO3)4 host lattice has an indirect band gap. The broad excitation ranges from 200 nm to 500 nm, especially the strongest excitation located in the near ultraviolet (near-UV) region, suggests that the phosphor can match well with not only blue LED chips but also near-UV LED chips. Besides, the phosphor can emit bright red light peaking at 596, 618, 655 and 706 nm under either near-UV or blue light excitation and the internal quantum efficiency can reach 40%. The temperature-dependent PL properties and calculation of color purity show that the phosphor has an excellent thermal stability and outstanding color stability. Ultimately, by employing Sr3La(AlO)3(BO3)4:Eu3+ phosphor as a red light component, a stable warm white light emission is obtained with Ra = 80, CIE = (0.3443, 0.2903) and CCT = 4680 K. These results indicate that red Sr3La(AlO)3(BO3)4:Eu3+ phosphor may have a great potential for wLEDs with fantastic properties.
1. Introduction
Of late, because of their high luminous efficiency, low power consumption, long lifetime and environmental friendliness, the phosphor-converted white light-emitting diodes (wLEDs) have attracted extensive research and commercial interest.1–4 Conventionally, wLEDs are fabricated by a blue InGaN LED chip (λex = 450–470 nm) covered by Ce3+ doped yellow emitting garnet (YAG:Ce3+) phosphor material. However, on account of the absence of sufficient red component, this type of wLED has a high color temperature (CCT ≈ 7750 K) and poor color rendering index (CRI ≈ 70–80) even though it has a high quantum efficiency and good thermal stability.5–7 On the other hand, the blue light emitted by the InGaN chip can also cause damage to human eyes. Thus, the investigations of near ultraviolet white LEDs (n-UV-wLEDs) phosphors with excellent luminescence properties are necessary. Recently, a feasible method to fabricate wLED has been to combine a near ultraviolet chip and red, green and blue (RGB) phosphors. As a widely used red emission phosphor, Y2O2S:Eu3+ has been used in high efficiency fluorescent lamps, cathode ray tubes, field emission displays and plasma displays, but its thermal stability and chemical stability are poor.8 In this case, in order to improve the performances of red phosphor and wLEDs, it is an urgent task to develop novel red-emitting phosphors with excellent physical and chemical stabilities, and higher efficiencies. At present, the research of red phosphor is mainly focused on different substrates doped with Mn4+ or Eu3+, and lots of red emission phosphors with fantastic luminescent properties have been synthesized. For example, Wang et al. prepared a non-rare-earth-based oxide CaMg2Al16O27:Mn4+ red phosphor, driven by a 350 mA current, the assembled w-LED device showed tunable Ra (70–85.5) and CCT (6674–3896 K).9 In addition, Guo et al. made a red-emitting Na3Sc2(PO4)3:Eu3+ phosphor with a high internal quantum efficiency of 49%.10 Huang et al. also synthesized a red Ca3Lu(AlO)3(BO3)4:Eu3+ phosphor with ultra-internal quantum efficiency of 98.5%.11 The similar studies include Na0.5Sr0.25NbO3:Eu3+,12 Gd3Zn2Nb3O14:Eu3+,13 Sr[Li2Al2O2N2]:Eu2+,14 Na2Gd(PO4)(MoO4):Eu3+ (ref. 15) and BaGeF6:Mn4+,16 etc., all of them have excellent luminescence properties.As a popular red emission activator, Eu3+ can generate strong emission at around 620 nm corresponding to 5D0 → 7F2 transition.17–20 It is worth noting that the characteristic emission of Eu3+ roots in the transitions of its intra-4f electrons, and the 4f orbit lies inside the ion and is shielded from the surrounding by the filled 5s and 5p orbits. Therefore, the matrix lattice field has little effect on the optical transition within the 4fn configuration, and the luminescence of Eu3+ ion has a good color stability. So far, researchers have synthesized a variety of Eu3+ ion-doped phosphor materials with different hosts, such as tungstate, molybdate, fluoride, aluminate, oxide and phosphate.21–26
In this work, we have calcined the red-emitting Sr3La(AlO)3(BO3)4:Eu3+ phosphor. The relatively internal quantum efficiency (IQE) and color purity can attain to 40% and 92.40% severally with a desired doping concentration of 60 mol% Eu3+ ion. Under the excitation of 394 nm, the phosphor displays a strong red emission with the strongest peak at 618 nm. Finally, by employing Sr3La(AlO)3(BO3)4:Eu3+ as the red phosphor, we generate a white LED with the CCT = 4680 K and Ra = 80, which presents a substantial advance towards its commercial application. All the results indicate that the present synthesized phosphor is a suitable red-emitting applicant for n-UV-based wLEDs.
2. Experimental section
2.1. Materials and preparation
A series of Sr3La1−x(AlO)3(BO3)4:xEu3+ (x = 0, 10, 20, 40, 60, 80, 100 mol%) phosphor samples are calcined by the traditional solid-state reaction. The raw materials SrCO3 (A. R.), La2O3 (A. R.), Al2O3 (A. R.), Eu2O3 (A. R.) and H3BO3 (A. R.) are weighed with the designed stoichiometric ratio. Of which, the excess of boric acid is 15 wt%. And then the raw materials are ground to mix adequately for 50 min. The uniform mixtures are calcined at 1050 °C for 4 h in air. Finally, the products are ground evenly into power in agate mortar for further measurements.Based on the ratio of Sr3La0.6Eu0.4(AlO)3(BO3)4![[thin space (1/6-em)]](https://www.rsc.org/images/entities/char_2009.gif) :
:![[thin space (1/6-em)]](https://www.rsc.org/images/entities/char_2009.gif) BAM (BaMg2Al16O27:Eu2+)
BAM (BaMg2Al16O27:Eu2+)![[thin space (1/6-em)]](https://www.rsc.org/images/entities/char_2009.gif) :
:![[thin space (1/6-em)]](https://www.rsc.org/images/entities/char_2009.gif) (Ca,Sr)2SiO4 = 9
(Ca,Sr)2SiO4 = 9![[thin space (1/6-em)]](https://www.rsc.org/images/entities/char_2009.gif) :
:![[thin space (1/6-em)]](https://www.rsc.org/images/entities/char_2009.gif) 1
1![[thin space (1/6-em)]](https://www.rsc.org/images/entities/char_2009.gif) :
:![[thin space (1/6-em)]](https://www.rsc.org/images/entities/char_2009.gif) 3, the three kinds of phosphors are mixed absolutely with the silicone, then the mixture is coated on the surface of a 395 nm LED chip to integrate the wLED. The wLED is drove under the current of 150 mA. The CRI, CIE chromaticity coordinates, and CCT of the wLED are measured by using the Spectrophotocolorimeter (Hongpu, Hangzhou, China).
3, the three kinds of phosphors are mixed absolutely with the silicone, then the mixture is coated on the surface of a 395 nm LED chip to integrate the wLED. The wLED is drove under the current of 150 mA. The CRI, CIE chromaticity coordinates, and CCT of the wLED are measured by using the Spectrophotocolorimeter (Hongpu, Hangzhou, China).
2.2. Measurements
XRD patterns of the phosphor samples are obtained to check the phase purity by X-ray diffractometer in the 2θ range of 10–90° with a step of 0.02° min−1 using Cu-Kα1 radiation (λ = 1.54056 Å) (XRD-6000, SHIMADZU). The band structures and corresponding density of states of Sr3La(AlO)3(BO3)4 host are calculated based on the density functional theory (DFT) with the Cambridge Serial Total Energy Package (CASTEP) code.27 The exchange–correlation functional generalized gradient approximation (GGA) of Perdew–Burke–Ernzerhof (PBE) is chosen for the theoretical basis of density function with an energy cut-off of 480 V, and the k-point mesh is set as 2 × 2 × 4. The convergence criteria are set as follows: the force on the atoms is less than 0.03 eV Å−1, the stress on the atoms is less than 0.05 GPa, the atomic displacement is less than 1 × 10⁻³ Å, and the energy change per atom is less than 1 × 10⁻⁵ eV. The microstructures of the calcined samples are observed by scanning electron microscopy (SEM, JSM7500, Japan). The diffuse reflectance spectra (DRS) are recorded on a UV-vis spectrophotometer (UV-3600) using the BaSiO4 white power as the reference. The photoluminescence (PL) and photoluminescence excitation (PLE) spectra are measured at room temperature via a fluorescence spectrophotometer (F-4600, HITACHI, Japan), where the photomultiplier tube is operated at 500 V and a 150 W Xe lamp is used as the excitation source. High temperature luminescence intensity measurements are carried out by means of an aluminum plaque with cartridge heaters; the temperature is measured by thermocouples inside the plaque and controlled with a standard TAP-02 high temperature fluorescence controller (Orient KOJI instrument Co., Ltd.). Fluorescence lifetime is acquired on a Fluorolog-3 spectrofluorometer (Horiba JobinYvon) with a SpectraLED (355 nm, S-355) as the excitation source and a picosecond photon detection module (PPD-850) as the detector. The internal quantum efficiencies (IQE) are obtained on HITACHI F7000 spectrometer with excitation wavelength of 394 nm. With the help of Fluorolog Spectrofluorometer (HORIBA) equipped with an integrating sphere coated with barium sulfate, the internal quantum efficiency of the prepared samples is evaluated.3. Results and discussion
3.1. Structure and morphology of the samples
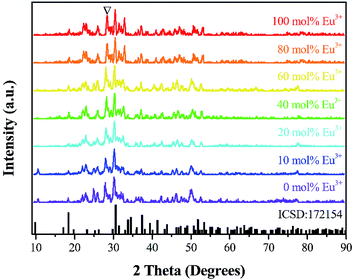
Fig. 1 exhibits the powder X-ray reflection diffraction (PXRD) patterns for Sr3La(1−x)Eux(AlO)3(BO3)4 (x = 0, 10, 20, 40, 60, 80 and 100 mol%) phosphor samples. Although the phase of Sr3La (AlO)3(BO3)4 cannot be indexed from ICSD files, it is found that the diffraction peaks of samples can match well with the reference diffraction lines based on Ca3Y(AlO)3(BO3)4 (ICSD file no. 172154). Therefore, it can be inferred that the structure of the sample is the same as that of Ca3Y(AlO)3(BO3)4. The Rietveld structure refinement employed the in GSAS of Sr3La (AlO)3(BO3)4 is shown in Fig. S1.†The obtained profile factors are Rp = 12.60% and Rwp = 9.82%. The refined lattice parameters of Sr3La (AlO)3(BO3)4 are a = 10.388 Å, c = 5.852 Å, V = 546.947 Å3, and space group P63/m.
With the help of typical crystal structure diagram of Sr3La(AlO)3(BO3)4 based on the structure refinement, it is easy to comprehend the coordination environment of cations and structure character in this matrix. As shown in Fig. 2, the Sr3La(AlO)3(BO3)4 belong to tetragonal crystal system with the space group of P63/m, and the coordinate numbers of La1 and La2 are 7 and 9, respectively. For Eu3+, its radius (∼0.96 Å) is closer to that of La1 (∼1.06 Å), so the Eu3+ prefers to replace La1 when it enters the crystal lattice of Sr3La(AlO)3(BO3)4.
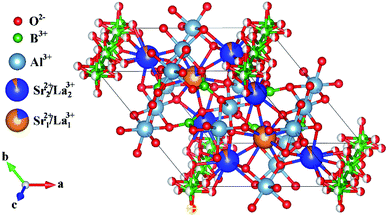 | ||
| Fig. 2 The crystal structure for Sr3La(AlO)3(BO3)4 host showing the connectivity of Sr, La, Al, B and O, and illustration of different coordination environment. | ||
The crystalline morphology of the Sr3La0.7Eu0.3(AlO)3(BO3)4 phosphor is checked by scanning electron microscopy (shown in Fig. 3a), and the accordingly energy dispersive X-ray analysis (EDX) is employed to identify the content of different elements as exhibited in Fig. 3b. In Fig. 3c, it is clearly seen from the images that the samples are composed of agminated particles with sizes ranging from 5 to 15 μm and the average size is about ∼9 μm.
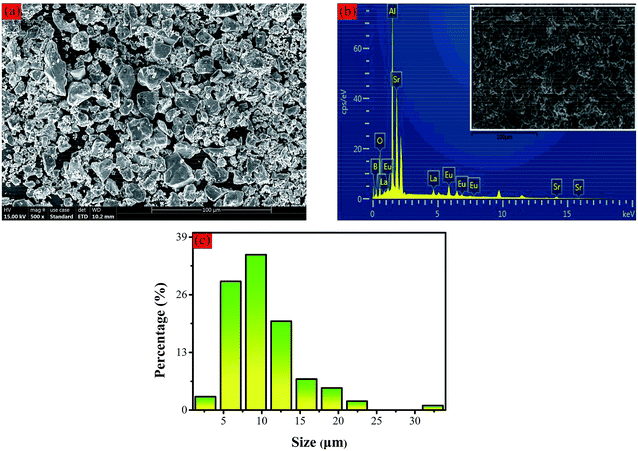 | ||
| Fig. 3 (a) SEM image of the as-prepared Sr3La0.7Eu0.3(AlO)3(BO3)4 phosphor with magnification of 500; (b) EDX; (c) distribution of size. | ||
3.2. Energy gap, electronic structure and density of state (DOS)
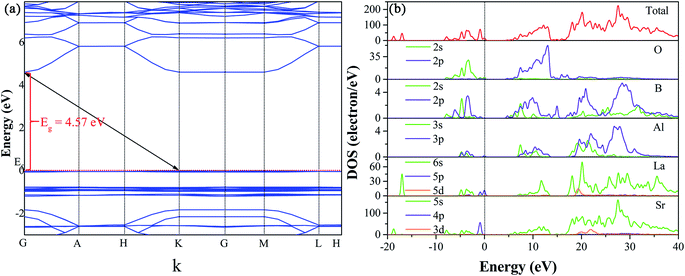
To get insight into the electronic properties of Sr3La(AlO)3(BO3)4 host matrix, the band structure and density of states (DOS) are computed and plotted in Fig. 4 after optimizing the Sr3La(AlO)3(BO3)4 structure. In Fig. 4a, the band gap between conduction bands minimum and valence bands maximum is about 4.57 eV, and they are located at G and K point in Brillouin zone severally, indicating that this host presents an indirect band gap. Therefore, the structure of Sr3La(AlO)3(BO3)4 is influential to luminescence since the transition probability of the indirect band gap is lower than that of the direct band gap due to the phonons involved in the transition process. In addition, the valence band of Sr3La(AlO)3(BO3)4 is remarkably flat, which reveals the very low mobility of the holes. By contrast, the dispersion of electronic states forming the conduction band is pronounced. With the help of density of states (DOS) and atomic partial density of states (PDOS) in Fig. 4b, we can acquire more information. The valence bands are dominated by the 2s orbit of O, 5p orbit of La and 4p of Sr, while the conduction bands comprise the 2p orbit of O, 2s and 2p orbits of B, 6s of La and 5s of Sr.In order to analyze the absorption spectroscopy, the diffuse reflection spectrum (DRS) of Sr3La(AlO)3(BO3)4 host and Sr3La0.4Eu0.6(AlO)3(BO3)4 phosphor are measured, as shown in Fig. 5a. Obviously, compared with the Sr3La(AlO)3(BO3)4 host, the diffuse reflectance spectrum of Sr3La0.4Eu0.6(AlO)3(BO3)4 shows an intense broad absorption band in the 200–300 nm range deriving from the Eu3+ → O2− charge transfer band (CTB). In addition, a battery of relatively sharp peaks at 362 nm, 380 nm, 395 nm, 416 nm, 465 nm, 532 nm and 591 nm can be ascribed to 4f–4f transitions of Eu3+ ions (7F0 → 5D4, 7F0 → 5L7, 7F0 → 5L6, 7F0 → 5D3, 7F0 → 5D2, 7F1 → 5D1 and 7F1 → 5D0, respectively). To further discuss the energy levels, the energy gap can be calculated according to the following function:28
| [F(R∞)hν]n = c(hν − Eg) | (1) |
 | (2) |
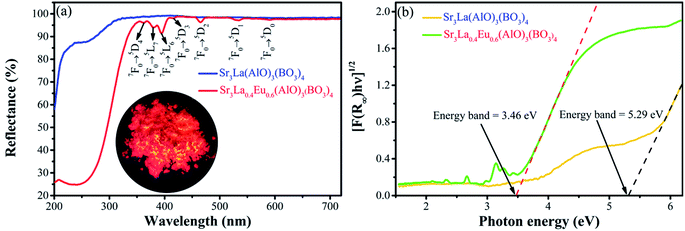 | ||
| Fig. 5 (a) DRS of Sr3La(AlO)3(BO3)4 host and Sr3La0.4Eu0.6(AlO)3(BO3)4; (b) absorption spectrum of Sr3La(AlO)3(BO3)4 host and Sr3La0.4Eu0.6(AlO)3(BO3)4 as calculated by the Kubelka–Munk formula. | ||
3.3. Photoluminescence properties
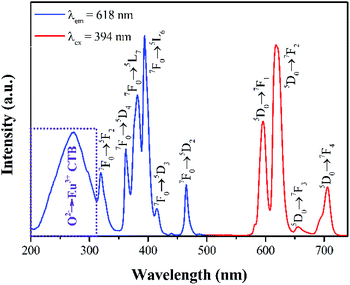
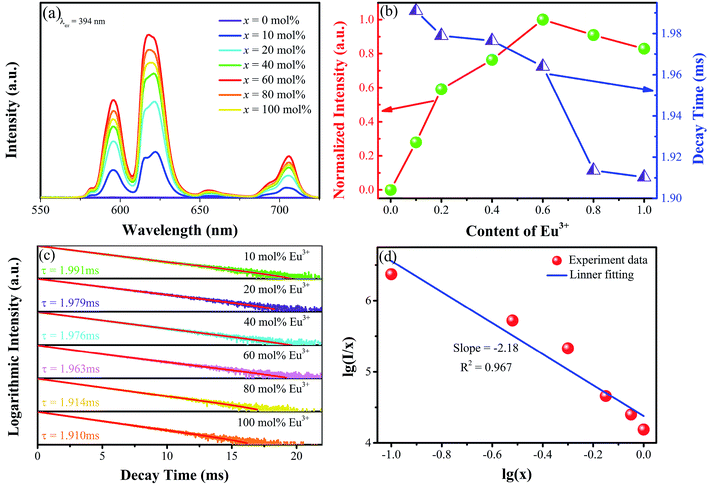
The room-temperature photoluminescence excitation spectra (λem = 618 nm) and emission (λex = 356 nm, 365 nm, 377 nm, 404 nm, 449 nm, 488 nm) of Sr3La0.4Eu0.6(AlO)3(BO3)4 calcined at 1050 °C are shown in Fig. 6. The PLE spectrum of Sr3La0.4Eu0.6(AlO)3(BO3)4 phosphor consists of a broad band in the 250–300 nm region peaking at about 272 nm and several intense sharp lines in the 300–470 nm region, indicating that these phosphors can be effectively excited by UV LED chip (350–400 nm). The PLE spectra exhibit several peaks at 319 nm, 362 nm, 382 nm, 394 nm, 414 nm and 465 nm, which can be attributed to the 7F0 → 5F2, 7F0 → 5D4, 7F0 → 5L7, 7F0 → 5L6, 7F0 → 5D3, 7F0 → 5D2 transitions of Eu3+ ions separately. This result corresponds well to that of DRS. The broad band is attributed to the charge transfer band (CTB) transition from the fully filled 2p orbits of O2− ions to the partially filled 4f orbits of Eu3+.8,17,18,31 Besides, the PL spectrum shows a red emission with the peaks at 596 nm, 618 nm, 655 nm and 706 nm, which result from the transition of 5D0 → 7F1, 5D0 → 7F2, 5D0 → 7F3, 5D0 → 7F4.To obtain the best doping content of Eu3+, the emission spectra of Sr3La(1−x)Eux(AlO)3(BO3)4 have been investigated. As shown in Fig. 7a, under the excitation of 394 nm, the emission intensity keeps increasing until the value of x = 60 mol%, beyond which the concentration quenching occurs and the emission intensity begins to decrease. Therefore, the optimal doped concentration is about 60 mol%, it is also displayed by the corresponding tendency chart in Fig. 7b. In general, when the concentration of activator ions increases, the distance between the activators decreases, leading to the enhancement in energy transfer between the activators. If the ions concentration continues to increase, it will cause fluorescence quenching.
The photoluminescence decay curves of the samples also reveal the dependence of photoluminescence properties on the activator concentration and can provide important information of the concentration quenching in the energy transfer process. The fluorescence decay lifetime measurements for Eu3+ emission (λex = 394 nm, λem = 618 nm) with Eu3+ concentration increasing are shown in Fig. 7c and the corresponding tendency is shown in Fig. 7b. All the fluorescence intensities show the trend of fast decay first and then slow decrease. And the Eu3+ decay curves of Sr3La1−xEux(AlO)3(BO3)4 (x = 10, 20, 40, 60, 80, 100 mol%) samples can be well fitted with a second-order exponential decay equation (defects in the samples might act as the channels of non-radiative relaxation) as:32,33
 | (3) |
| τ* = (A1τ12 + A2τ22)/(A1τ1 + A2τ2) | (4) |
| Concentration of Eu3+ (mol%) | τ1 (ms) | τ2 (ms) | A1 | A2 | τ* (ms) |
|---|---|---|---|---|---|
| 10 | 2.63 | 1.93 | 790 | 8872 | 1.991 |
| 20 | 2.96 | 3.79 | 9644 | 117 | 1.979 |
| 40 | 1.68 | 2.12 | 3100 | 6550 | 1.976 |
| 60 | 1.65 | 2.27 | 4808 | 4882 | 1.964 |
| 80 | 1.88 | 2.64 | 9276 | 488 | 1.914 |
| 100 | 2.58 | 1.86 | 707 | 9053 | 1.910 |
In order to further investigate the quenching mechanism, it is necessary to calculate the critical transfer distance (Rc). According to Blasse's theory, the critical distance Rc can be calculated approximately by this equation:34
 | (5) |
 | (6) |
The relationship between lg(I/x) and lg(x) has been plotted as shown in Fig. 7d. The slope of line is about −2.18, and the calculated θ ≈ 6, meaning that the concentration quenching mechanism between the closer Eu3+ ions in the Sr3La1−xEux(AlO)3(BO3)4 is dominated by dipole–dipole interaction.
Furthermore, the luminescence color of Sr3La1−xEux(AlO)3(BO3)4 has been characterized using CIE 1931 chromaticity diagram. The CIE coordinate value of the Sr3La0.4Eu0.6(AlO)3(BO3)4 phosphor is calculated to be (0.6524, 0.3473), situated in the red region and at the extreme corner of the CIE diagram as shown in Fig. 8.
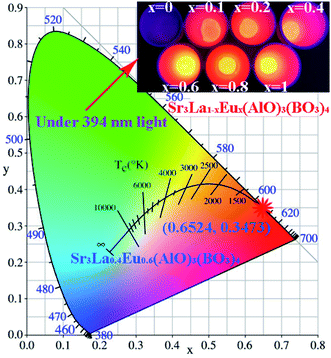 | ||
| Fig. 8 CIE (x, y) coordinate diagram showing chromaticity points of Eu3+ luminescence in Sr3La0.4Eu0.6(AlO)3(BO3)4; insets are the corresponding luminescent photos under 394 nm UV lamp illumination. | ||
To get a deep insight into the chromatic behaviors of the obtained red emission, its color purity is calculated with the help of the following formula:38,39
 | (7) |
In the expression, the (x, y), (xi, yi) and (xd, yd) refer to the CIE coordinates of the synthesized compounds, white illumination and dominant wavelength, respectively. In this present work, (x, y) = (0.6524, 0.3466), (xi, yi) = (0.310, 0.316) and (xd, yd) = (0.679, 0.317). As a result, the color purity of the achieved red emission is demonstrated to be about 92.40%, which is superior to some previous developed red-emitting phosphors, such as Na3Sc2(PO4)3:Eu3+ (87%)10 and Na2Gd(PO4)(MoO4):Eu3+ (92%).15
3.4. Quantum efficiency
The internal quantum efficiency (IQE) of Sr3La1−xEux(AlO)3(BO3)4 phosphors are calculated by using the following equations:40
 | (8) |
In which LS stands for the emission spectrum of the phosphor, and ER represents the spectrum of excitation light without phosphor in integrating sphere. The IQE of Sr3La0.4Eu0.6(AlO)3(BO3)4 is calculated to be about 40%, as shown in Fig. 9. And the IQEs of Sr3La1−xEux(AlO)3(BO3)4 are displayed in Table 2.
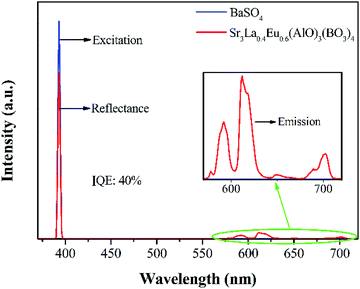 | ||
| Fig. 9 Room-temperature excitation of BaSiO4 and reflection and emission of Sr3La0.4Eu0.6(AlO)3(BO3)4Eu3+. | ||
| Sample no. | Concentration of Eu3+ (mol%) | IQE (%) |
|---|---|---|
| 1 | 10 | 27 |
| 2 | 20 | 33 |
| 3 | 40 | 38 |
| 4 | 60 | 40 |
| 5 | 80 | 37 |
| 6 | 100 | 33 |
3.5. Thermal stability
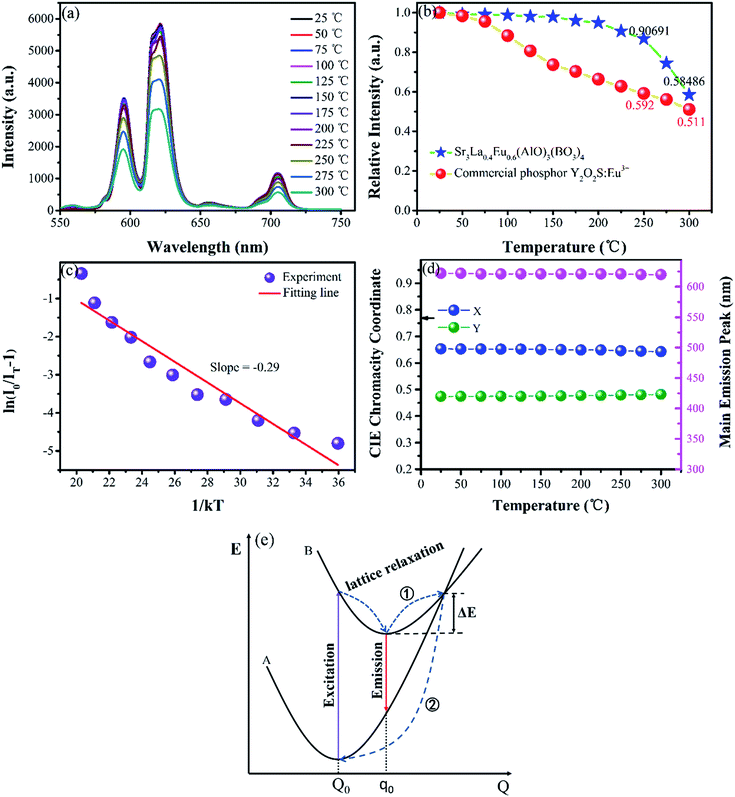
Thermal stability is another important performance factor for phosphors because LED chips will produce a large amount of heat in operation. To further verify the thermal stability characteristic of Sr3La(AlO)3(BO3)4:Eu3+, thermal quenching of the typical Sr3La0.4Eu0.6(AlO)3(BO3)4 sample is investigated in detail. The temperature-dependent emission spectra and emission intensity are also given in Fig. 10a. With temperature increasing, the peak positions and band shape of this phosphor do not vary, whereas the emission intensity changes obviously. In order to better compare the thermal stability, Fig. 10b exhibits the emission intensities of Sr3La0.4Eu0.6(AlO)3(BO3)4 and commercial Y2O3S:Eu3+ phosphors depend on temperature. Apparently, as the temperature increases, the emission intensities of these two kinds of phosphors have a similar trend to decrease. Specifically, at 225 °C, the emission intensity of Sr3La0.4Eu0.6(AlO)3(BO3)4 can still remain at ∼91% of the initial value (at ∼25 °C), while that of the Y2O3S:Eu3+ reduces to ∼59%. When the temperature further rises to 300 °C, the emission intensity of Sr3La0.4Eu0.6(AlO)3(BO3)4 decreases to 59% of the initial value, while that of the Y2O3S:Eu3+ decreases to 51%. The fact suggests that the Sr3La(AlO)3(BO3)4:Eu3+ phosphor has a better thermal stability. Usually, the activation energy can be calculated using the Arrhenius equation:41
 | (9) |
The thermal quenching can be explained by configurational coordinate diagram. In Fig. 10e, the symbols of A and B represent the ground state and excited state of Eu3+ separately. As the temperature increases, the lattice vibration of the matrix increases, and the electrons in the excited state can be thermally activated to reach the intersection of the ground state and the excited state coordinate curve (process ①), causing the excited state electrons to transit to the ground state non-radioactively and pass through the lattice relaxation to reach the equilibrium state of the ground state (process ②). As a result, the two processes are enhanced as the temperature continues to rise, and the luminescence intensity becomes weaker at higher temperatures.
Encapsulation experiment is actualized to evaluate the potential application possibility for Sr3La(AlO)3(BO3)4:Eu3+. By employing the Sr3La(AlO)3(BO3)4:Eu3+ phosphor as a red component, the white light can be generated with Ra = 80, CCT = 4680 K and CIE of (0.3443, 0.2903) under the driven current of 150 mA. The corresponding electroluminescence (EL) spectrum of the fabricated white LED is shown in Fig. 11. The obtained warm white light has a high color index, indicating that the Sr3La(AlO)3(BO3)4:Eu3+ phosphor has a great potential to be applied in w-LED.
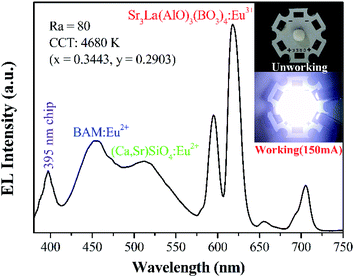 | ||
| Fig. 11 EL spectrum of the fabricated white LED lamp by 150 mA current. The insets are the photos of LED when not working and working. | ||
4. Conclusion
In summary, a series of highly efficient Eu3+-activated Sr3La(AlO)3(BO3)4 phosphors are successfully prepared by the solid-state reaction method. The resultant phosphor could be efficiently excited by the commercial NUV chip and emitted brightly visible red emission with a high color purity of approximately 92.40%. The optimal doping concentration of Eu3+ ions in the Sr3La (AlO)3(BO3)4 host material is determined to be as high as 60 mol% and the dipole–dipole interaction contributes to the concentration quenching. Furthermore, the internal quantum efficiency of the Sr3La0.4Eu0.6(AlO)3(BO3)4 phosphor is found to be 40%. The temperature-dependent PL emission spectra revealed that the studied phosphor possessed excellent thermal stability with an activation energy of 0.29 eV. By employing Sr3La(AlO)3(BO3)4:Eu3+ as a red light component, a stable wLED with proper CCT (4680 K) and CRI (Ra = 80) values is obtained. The above results indicate that red phosphor Sr3La(AlO)3(BO3)4:Eu3+ may be a promising candidate for fabricating near ultraviolet converted white-light LEDs.Conflicts of interest
There are no conflicts of interest to declare.Acknowledgements
This work was supported by the Science and Technology Research Program of Chongqing Municipal Education Commission (Grant No. KJQN201801332) and The Fundamental Research Funds for Central Universities.References
- L. J. Yin, Y. L. Liang, S. H. Zhang, M. Wang, L. Li, W. J. Xie, H. Zhong, X. Jian, X. Xu, X. Wang and L. J. Deng, Chem. Commun., 2018, 54, 3480–3483 RSC.
- H. Daicho, Y. Shinomiya, K. Enomoto, A. Nakano, H. Sawa, S. Matsuishi and H. Hosono, Chem. Commun., 2018, 54, 884–887 RSC.
- L. Wang, R. J. Xie, Y. Li, X. Wang, C. G. Ma, D. Luo, T. Takeda, Y. T. Tsai, R. S. Liu and N. Hirosaki, Light: Sci. Appl., 2016, 5, e16155 CrossRef CAS.
- F. Yang, Y. Liu, X. Tian, G. Dong and Q. Yu, J. Solid State Chem., 2015, 225, 19–23 CrossRef CAS.
- C. Feldmann, T. Jüstel, C. R. Ronda and P. J. Schmidt, Adv. Funct. Mater., 2003, 13, 511–516 CrossRef CAS.
- R.-J. Xie, N. Hirosaki, T. Suehiro, F.-F. Xu and M. Mitomo, Chem. Mater., 2006, 28, 5578–5583 CrossRef.
- C. Zhao, D.-c. Zhu, W. Gao, M.-j. Tu, L.-l. Luo, T. Han and X.-l. Jing, Chem. Eng. J., 2014, 254, 486–490 CrossRef CAS.
- J. Qiao, L. Wang, Y. Liu, P. Huang, Q. Shi, Y. Tian and C. e. Cui, J. Alloys Compd., 2016, 686, 601–607 CrossRef CAS.
- B. Wang, H. Lin, J. Xu, H. Chen and Y. Wang, ACS Appl. Mater. Interfaces, 2014, 6, 22905–22913 CrossRef CAS PubMed.
- H. Guo, X. Huang and Y. Zeng, J. Alloys Compd., 2018, 741, 300–306 CrossRef CAS.
- X. Huang, S. Wang, B. Li, Q. Sun and H. Guo, Opt. Lett., 2018, 43, 1307–1310 CrossRef CAS PubMed.
- Y. Shi, B. Quan, Q. Ning, S. Cao, J. Shi and C. Dong, Mater. Res. Bull., 2018, 101, 363–370 CrossRef CAS.
- T. S. Sreena, P. P. Rao, A. K. V. Raj and T. R. A. Thara, J. Alloys Compd., 2018, 751, 148–158 CrossRef CAS.
- X. Huang, Sci. Bull., 2019, 64, 879–880 CrossRef.
- X. Huang, H. Guo and B. Li, J. Alloys Compd., 2017, 720, 29–38 CrossRef CAS.
- Q. Zhou, Y. Zhou, Y. Liu, L. Luo, Z. Wang, J. Peng, J. Yan and M. Wu, J. Mater. Chem. C, 2015, 3, 3055–3059 RSC.
- J. Zhao, C. Guo, T. Li, X. Su, N. Zhang and J. Chen, Dyes Pigm., 2016, 132, 159–166 CrossRef CAS.
- P. Du and J. S. Yu, J. Lumin., 2016, 179, 451–456 CrossRef CAS.
- P. Du, X. Huang and J. S. Yu, Chem. Eng. J., 2018, 337, 91–100 CrossRef CAS.
- S. Wang, Y. Xu, T. Chen, W. Jiang, J. Liu, X. Zhang, W. Jiang and L. Wang, J. Alloys Compd., 2019, 789, 381–391 CrossRef CAS.
- R. Cao, C. Liao, F. Xiao, G. Zheng, W. Hu, Y. Guo and Y. Ye, Dyes Pigm., 2018, 149, 574–580 CrossRef CAS.
- N. D. Quoc Anh, H.-Y. Lee, T. Thanh Phuong, N. H. Khanh Nhan, T. H. Quang Minh and T. Huu Ly, J. Chin. Inst. Eng., 2017, 40, 228–234 CrossRef.
- N. Dhananjaya, C. Shivakumara, R. Saraf and H. Nagabhushana, Mater. Res. Bull., 2016, 75, 100–109 CrossRef CAS.
- F. M. Emen, R. Altinkaya, V. E. Kafadar, G. Avsar, T. Yeşilkaynak and N. Kulcu, J. Alloys Compd., 2016, 681, 260–267 CrossRef CAS.
- H. Pan, X. Lin, J. Zhang, L. Guan, H. Su and F. Teng, Mater. Lett., 2015, 155, 106–108 CrossRef CAS.
- X. Huang, B. Li, H. Guo and D. Chen, Dyes Pigm., 2017, 143, 86–94 CrossRef CAS.
- S. J. Clark, M. D. Segall, C. J. Pickard, P. J. Hasnip, M. I. J. Probert, K. Refson and M. C. Payne, Z. Kristallogr. - Cryst. Mater., 2005, 220, 567–570 CAS.
- B. Wang, Z. Wang, Y. Liu, T. Yang, Z. Huang and M. Fang, J. Alloys Compd., 2019, 776, 554–559 CrossRef CAS.
- D. Deng, H. Yu, Y. Li, Y. Hua, G. Jia, S. Zhao, H. Wang, L. Huang, Y. Li, C. Li and S. Xu, J. Mater. Chem. C, 2013, 1, 3194–3199 RSC.
- X. Wang, Z. Zhao, Q. Wu, Y. Li and Y. Wang, Inorg. Chem., 2016, 55, 11072–11077 CrossRef CAS.
- X. Zhang and D. Miao, Knowl. Based Syst., 2016, 91, 219–240 CrossRef.
- J. Wang, H. Zhang, B. Lei, Z. Xia, H. Dong, Y. Liu, M. Zheng and Y. Xiao, J. Mater. Chem. C, 2015, 3, 4445–4451 RSC.
- Z. Chen, Y. Pan, L. Xi, R. Pang, S. Huang and G. Liu, Inorg. Chem., 2016, 55, 11249–11257 CrossRef CAS PubMed.
- G. Blasse, Phys. Lett. A, 1968, 28, 444–445 CrossRef CAS.
- Y. Yu, Q. S. Wu and R. K. Li, J. Solid State Chem., 2006, 179, 429–432 CrossRef CAS.
- D. L. Dexter, J. Chem. Phys., 1953, 21, 836–850 CrossRef CAS.
- L. G. V. Uitert, J. Electrochem. Soc., 1967, 114, 1048–1053 CrossRef.
- P. Du, Y. Guo, S. H. Lee and J. S. Yu, RSC Adv., 2017, 7, 3170–3178 RSC.
- J. Zheng, Q. Cheng, S. Wu, Z. Guo, Y. Zhuang, Y. Lu, Y. Li and C. Chen, J. Mater. Chem. C, 2015, 3, 11219–11227 RSC.
- E. Song, Y. Zhou, X.-B. Yang, Z. Liao, W. Zhao, T. Deng, L. Wang, Y. Ma, S. Ye and Q. Zhang, ACS Photonics, 2017, 4, 2556–2565 CrossRef CAS.
- S. Bhushan and M. V. Chukichev, J. Mater. Sci. Lett., 1988, 7, 319–321 CrossRef CAS.
Footnote |
| † Electronic supplementary information (ESI) available. See DOI: 10.1039/c9ra05017e |
| This journal is © The Royal Society of Chemistry 2019 |

