 Open Access Article
Significantly improved dielectric properties of multiwall carbon nanotube-BaTiO3/PVDF polymer composites by tuning the particle size of the ceramic filler
Kanyapak Silakaewa and
Prasit Thongbai *bc
*bc
aMaterials Science and Nanotechnology Program, Faculty of Science, Khon Kaen University, Khon Kaen 40002, Thailand
bDepartment of Physics, Faculty of Science, Khon Kaen University, Khon Kaen 40002, Thailand. E-mail: pthongbai@kku.ac.th; Fax: +66 43 202374; Tel: +66 84 4190266
cInstitute of Nanomaterials Research and Innovation for Energy (IN-RIE), NANOTEC-KKU RNN on Nanomaterials Research and Innovation for Energy, Khon Kaen University, Khon Kaen, 40002, Thailand
First published on 29th July 2019
Abstract
The effects of different BaTiO3 sizes (≈100 nm (nBT) and 0.5–1.0 μm (μBT)) on the dielectric and electrical properties of multiwall carbon nanotube (CNT)-BT/poly(vinylidene fluoride) (PVDF) composites are investigated. The fabricated three-phase composites using 20 vol% BT with various CNT volume fractions (fCNT) are systematically characterized. The dielectric permittivity (ε′) of the CNT-nBT/PVDF and CNT-μBT/PVDF composites rapidly increases when fCNT > 0.015 and fCNT > 0.017, respectively. The former is accompanied by the dramatic increase in the loss tangent (tan![[thin space (1/6-em)]](https://www.rsc.org/images/entities/char_2009.gif) δ) and conductivity (σ), but surprisingly, not for the latter. At 103 Hz, the low tan
δ) and conductivity (σ), but surprisingly, not for the latter. At 103 Hz, the low tan![[thin space (1/6-em)]](https://www.rsc.org/images/entities/char_2009.gif) δ and σ values of the CNT-μBT/PVDF composite are about 0.06 and 6.82 × 10⁻⁹ S cm−1, while its ε′ value is greatly enhanced (≈154.6). The variation of the dielectric permittivity with fCNT for both composite systems follows the percolation model with percolation thresholds of fc = 0.018 and fc = 0.02, respectively. With further increasing fCNT to 0.02, ε′ is greatly increased to 253.8, while tan
δ and σ values of the CNT-μBT/PVDF composite are about 0.06 and 6.82 × 10⁻⁹ S cm−1, while its ε′ value is greatly enhanced (≈154.6). The variation of the dielectric permittivity with fCNT for both composite systems follows the percolation model with percolation thresholds of fc = 0.018 and fc = 0.02, respectively. With further increasing fCNT to 0.02, ε′ is greatly increased to 253.8, while tan![[thin space (1/6-em)]](https://www.rsc.org/images/entities/char_2009.gif) δ ≤ 0.1. Without μBT particles, the ε′ and tan
δ ≤ 0.1. Without μBT particles, the ε′ and tan![[thin space (1/6-em)]](https://www.rsc.org/images/entities/char_2009.gif) δ values of the CNT/PVDF composite with fCNT = 0.02 are as high as ≈240 and >103, respectively. Greatly enhanced dielectric properties are described in detail.
δ values of the CNT/PVDF composite with fCNT = 0.02 are as high as ≈240 and >103, respectively. Greatly enhanced dielectric properties are described in detail.
1. Introduction
Polymer-based materials with high dielectric permittivity are being considered as one of the materials with most potential for modern technological applications such as piezoelectric generators, energy storage devices, embedded components, gate dielectrics, and electromechanical transducers.1–4 This is because excellent mechanical properties, good processability, lightweight and low density, and high permittivity, as well as high breakdown strength, can be achieved in polymer-based materials. Furthermore, the processing for the fabrication of polymer composites is easy.1,2,5–7Poly(vinylidene fluoride) (PVDF) polymer is usually used as a dielectric polymer for fabricating polymer composites owing to its excellent electrical and dielectric properties with large dielectric permittivity (ε′ ≈ 10) and low loss tangent (tan![[thin space (1/6-em)]](https://www.rsc.org/images/entities/char_2009.gif) δ < 0.02).1,4,8–13 Furthermore, highly reliable, low cost, high breakdown, and hence, large energy density are achieved in PVDF. Nevertheless, it is a low dielectric-permittivity material when compared to dielectric oxides. As a result, a low dielectric permittivity in polymer composites was usually achieved even when filling with high-permittivity materials.14–21
δ < 0.02).1,4,8–13 Furthermore, highly reliable, low cost, high breakdown, and hence, large energy density are achieved in PVDF. Nevertheless, it is a low dielectric-permittivity material when compared to dielectric oxides. As a result, a low dielectric permittivity in polymer composites was usually achieved even when filling with high-permittivity materials.14–21
An easy approach for enhancing the dielectric permittivity of polymer composites is to incorporate polymer matrix with high-permittivity oxide particles. Many high-permittivity oxide particles (e.g., CaCu3Ti4O12 and related oxides,16,18,20,22 BaTiO3,14,17,19 and FeTiNbO6![[thin space (1/6-em)]](https://www.rsc.org/images/entities/char_2009.gif) 23 have been widely selected as fillers. Unfortunately, a significantly enhanced dielectric permittivity (ε′ > 50) can often be obtained by using very large loading of these fillers (ffiller ≥ 50 vol%). Consequently, poor flexibility and processability owing to a large loading of fillers become serious problems in ceramic–polymer composite system. In addition, large clusters of ceramic particles in a polymer matrix gave rise to leakage of current pathways.19 The loss tangent usually increases as ceramic particles were increased due to poor distribution of fillers and aggregation of filler particles.
23 have been widely selected as fillers. Unfortunately, a significantly enhanced dielectric permittivity (ε′ > 50) can often be obtained by using very large loading of these fillers (ffiller ≥ 50 vol%). Consequently, poor flexibility and processability owing to a large loading of fillers become serious problems in ceramic–polymer composite system. In addition, large clusters of ceramic particles in a polymer matrix gave rise to leakage of current pathways.19 The loss tangent usually increases as ceramic particles were increased due to poor distribution of fillers and aggregation of filler particles.
A new method to enhance dielectric permittivity with suppressing a great increase in the dielectric loss has been accomplished by fabricating conductor-ceramic oxide nanoparticles/PVDF three-phase composites such as Ag–BaTiO3/PVDF8 and carbon nanotube (CNT)-BaTiO3/PVDF nanocomposites.15,24 In these three-phase nanocomposite systems, BaTiO3 nanoparticles (nBT) with sizes of ≈100 nm have been widely used. A significant increase in the dielectric permittivity with low loss tangent was accomplished by increasing ffiller. Notably, the (8.2 vol%) Ag–(48.6 vol%) nBT/PVDF composite exhibited greatly increased dielectric permittivity of ≈160 (at room temperature (RT) and 103 Hz) with low loss tangent (tan![[thin space (1/6-em)]](https://www.rsc.org/images/entities/char_2009.gif) δ ≈ 0.11).8 It was also found that the dielectric permittivity increased to 613 by increasing the percentage ratio of Ag/nBT from 28.6/71.4 to 61.0/39.0 wt%.25 Unfortunately, the loss tangent also increased to 0.29. A large increase in dielectric permittivity and low dielectric loss can be accomplished by using a low volume fraction of Ag. However, to obtain a large value of the dielectric permittivity, the total loading of Ag–BaTiO3 fillers was very large (fAg+nBT ≥ 50 vol%). Such a large loading of filler would degrade the flexibility of a PVDF matrix.
δ ≈ 0.11).8 It was also found that the dielectric permittivity increased to 613 by increasing the percentage ratio of Ag/nBT from 28.6/71.4 to 61.0/39.0 wt%.25 Unfortunately, the loss tangent also increased to 0.29. A large increase in dielectric permittivity and low dielectric loss can be accomplished by using a low volume fraction of Ag. However, to obtain a large value of the dielectric permittivity, the total loading of Ag–BaTiO3 fillers was very large (fAg+nBT ≥ 50 vol%). Such a large loading of filler would degrade the flexibility of a PVDF matrix.
On the other hand, a high dielectric permittivity (ε′ = 151 at 102 Hz) and low loss tangent with minimum value of 0.08 (less than 0.6 in the range of 102 to 107 Hz) were obtained in the three-phase PVDF matrix composite using 1.0 vol% of CNT (fCNT = 0.01) and 15 vol% of nBT (fnBT = 0.15) with particle size of ≈100 nm as fillers.15 With further increasing fCNT = 0.02 (fixed fnBT = 0.15), both of the dielectric permittivity and dielectric loss greatly increased (ε′ = 507.9 at 104 Hz and tan![[thin space (1/6-em)]](https://www.rsc.org/images/entities/char_2009.gif) δ < 3.0 in the range of 102 to 107 Hz).24 Although the loss tangent of the three-phase composite is much lower than that of the two-phase (fCNT = 0.02) CNT/PVDF composite, it is a large value for applications. Nevertheless, if the loss tangent can be reduced to lower than 0.1, the CNT-BT/PVDF composite system might be one of the most interesting polymer composites because this composite system should have good flexibility owing to the total low-volume fraction of CNT and nBT fillers.
δ < 3.0 in the range of 102 to 107 Hz).24 Although the loss tangent of the three-phase composite is much lower than that of the two-phase (fCNT = 0.02) CNT/PVDF composite, it is a large value for applications. Nevertheless, if the loss tangent can be reduced to lower than 0.1, the CNT-BT/PVDF composite system might be one of the most interesting polymer composites because this composite system should have good flexibility owing to the total low-volume fraction of CNT and nBT fillers.
Dang et al.14 reported a strong increase in a low-frequency dielectric permittivity of BT/PVDF composites when the particle size of BT was decreased from 500 to 100 nm. Unfortunately, this was accompanied by a great increase in a low-frequency loss tangent due to the existence of a low-frequency dielectric relaxation peak. At 103 Hz, the loss tangent of the (100 nm) nBT/PVDF composite with fnBT = 0.6 was about 0.6. Then, it continuously decreased with increasing particle size of BT from 100 nm to 500 nm (0.5 μm). Thus, nBT with a size of ≈100 nm may be unsuitable for use as a filler in a polymer composite, while a large size of BT (≫1 μm) is usually undesirable for applications, especially when fabricated in the form of a thin film.
It was shown that the largest dielectric permittivity of about 5000 was obtained in the BT ceramic with the grain size of ≈1 μm or slightly less than to be 0.5 μm. Then, the dielectric permittivity decreased largely with decreasing the grain size,26,27 which was resulted from the decrease in the amount of a tetragonal phase in BT. When the grain size was reduced to be <0.12 μm (120 nm), a tetragonal phase was changed to a cubic phase, hence a low value of the dielectric permittivity.15 S. M. Aygün et al.28 have clearly demonstrated that the dielectric permittivity of Ba1−xSrxTiO3 thin films with crystalline size of ≈600 nm (or 0.6 μm) was much higher than that of the thin films with crystalline size of ≈100 nm.
The objective of this research is to show the effect of BT sizes on the dielectric properties of the CNT-BT/PVDF composite system. The dielectric and electrical properties of CNT-BT/PVDF composites with different sizes of 20 vol% BT (≈100 nm and 0.5–1.0 μm) are studied. The influences of CNT volume fractions on the dielectric and electrical properties are also investigated. Interestingly, significantly enhanced dielectric response with suppressing dielectric loss and conductivity can be accomplished.
2. Experimental details
2.1 Fabrication of polymer composites
Poly(vinylidene fluoride) (PVDF, Mw ∼ 534![[thin space (1/6-em)]](https://www.rsc.org/images/entities/char_2009.gif) 000), multi-wall carbon nanotubes (CNTs, 6–9 nm OD, 5 micron long), BaTiO3 nanoparticles (nBT, <100 nm, ≥99% purity) and sub-micron/micron BaTiO3 particles (μBT, 0.5–1.0 μm, 99.5% purity) were purchased from Sigma Aldrich. First, (20 vol%) nBT and (20 vol%) μBT were fixed for all CNT-BT/PVDF three-phase composites. Second, CNT-nBT/PVDF and CNT-μBT/PVDF composites with volume fractions of CNT (fCNT) in the range of 0–0.02 were designed. Third, the starting raw materials were mixed by the wet ball-milling for 6 h in C2H5OH. Then, the mixture of powders was heated in an oven at 80 °C to evaporate C2H5OH media. Finally, the mixed powders of CNT-nBT/PVDF and CNT-μBT/PVDF were hot-pressed into pellets with 14 mm in diameter and ∼0.7–1.4 mm in thickness at 200 °C for 0.5 h. The pressure used for hot-pressing was ≈255 MPa.
000), multi-wall carbon nanotubes (CNTs, 6–9 nm OD, 5 micron long), BaTiO3 nanoparticles (nBT, <100 nm, ≥99% purity) and sub-micron/micron BaTiO3 particles (μBT, 0.5–1.0 μm, 99.5% purity) were purchased from Sigma Aldrich. First, (20 vol%) nBT and (20 vol%) μBT were fixed for all CNT-BT/PVDF three-phase composites. Second, CNT-nBT/PVDF and CNT-μBT/PVDF composites with volume fractions of CNT (fCNT) in the range of 0–0.02 were designed. Third, the starting raw materials were mixed by the wet ball-milling for 6 h in C2H5OH. Then, the mixture of powders was heated in an oven at 80 °C to evaporate C2H5OH media. Finally, the mixed powders of CNT-nBT/PVDF and CNT-μBT/PVDF were hot-pressed into pellets with 14 mm in diameter and ∼0.7–1.4 mm in thickness at 200 °C for 0.5 h. The pressure used for hot-pressing was ≈255 MPa.
2.2 Characterization techniques and dielectric measurement
The microstructure and morphologies of nBT and μBT, as well as morphology of CNTs, were revealed by a transmission electron microscopy (TEM; FEI, TECNAI G2 20). Scanning electron microscopy (SEM; LEO, 1450VP) was used to show the microstructure of the composites. The phase compositions of nBT and μBT powders as well as CNT-BT/PVDF three-phase polymer composites were characterized by X-ray diffraction (XRD, PANalytical, EMPYREAN). Fourier transformed infrared spectroscopy (FTIR, Bruker, TENSOR 27) was used to identify PVDF phases. For dielectric measurement, an electrode was fabricated by painting a silver paste on both sides of composite samples. The samples were dried overnight to completely evaporate the solvent in the silver paint. The electrode area was ∼7.12 × 10⁻⁵ m2. The parallel capacitance (Cp) and dissipation factor (D, tan![[thin space (1/6-em)]](https://www.rsc.org/images/entities/char_2009.gif) δ) were corrected in the frequency range of 102 to 106 Hz with an AC oscillation voltage of 500 mV using KEYSIGHT E4990A Impedance Analyzer at RT.
δ) were corrected in the frequency range of 102 to 106 Hz with an AC oscillation voltage of 500 mV using KEYSIGHT E4990A Impedance Analyzer at RT.
3. Results and discussion
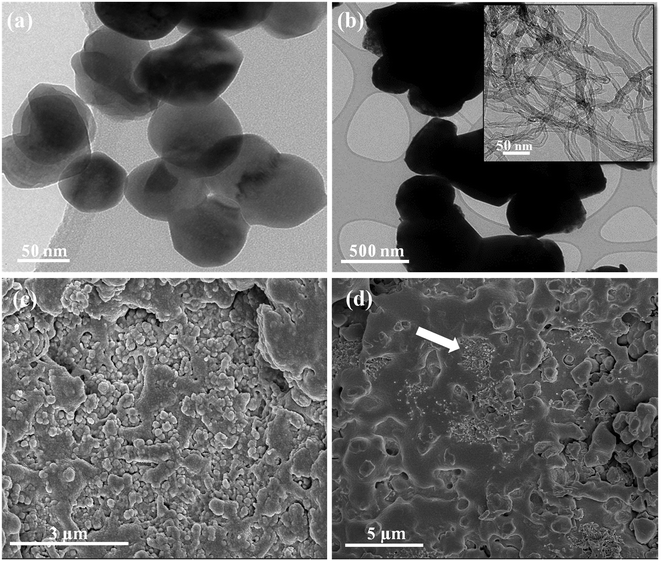
Fig. 1(a) and (b) show the morphologies of nBT and μBT particles, which are used as a ceramic filler. The particle sizes of the nBT and μBT particles are about 50–100 nm and 0.5–1.0 μm, respectively. The nBT particles are spherical, while the μBT particles are non-spherical. The morphology of CNT is shown in the inset of Fig. 1(b). The outer diameter of CNT is about 6–9 nm. The fractured cross-section of the CNT-nBT/PVDF and CNT-μBT/PVDF composites with fCNT = 0.02 is illustrated in Fig. 1(c) and (d). CNTs are observed in the SEM images, as indicated by an arrow. Small clusters of nBT particles are observed, which are usually found in the literature.16 The formation of nBT clusters is attributed to the high surface energy of nBT particles. While μBT particles are randomly distributed and surrounded by a PVDF matrix. In both cases, a continuous phase of the PVDF polymer is formed, surrounding the fillers. This result indicates a 0–3 type composite structure for the CNT-nBT/PVDF and CNT-μBT/PVDF composites.The XRD patterns of nBT and μBT powders are shown in Fig. 2(a). The main phase of BT is confirmed by the XRD patterns. Usually, when the grain size of BT is reduced to 0.3 μm, the tetragonal phase becomes to decrease slightly. Eventually, the tetragonal phase will disappear as the grain size of BT decreases to ≈0.1 μm (or 100 nm), remaining only the cubic phase. These two phases in the nBT and μBT powders are identified by considering at about 2θ ≈ 45°.14 The difference in XRD patterns is observed in the nBT and μBT powders, indicating the different phases. Double peaks of a tetragonal phase are detected in the XRD pattern of μBT, while only one peak was observed in the nBT. These results confirm the presence of tetragonal and cubic phases in the μBT and nBT powders, respectively. Accordingly, the ε′ values of nBT and μBT particles must be different. The ε′ value of the nBT particle is lower than that of the μBT particle because of its nonpolar cubic phase. Fig. 2(b) displays the XRD diffraction patterns of the CNT-nBT/PVDF and CNT-μBT/PVDF composites with fCNT = 0.02 and fBT = 0.2. Their XRD patterns are similar to those of the nBT and μBT powders.
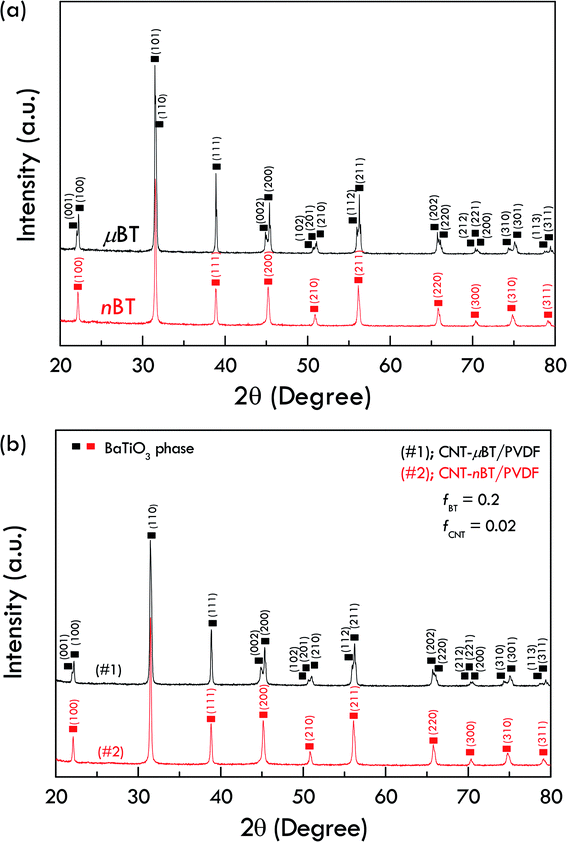 | ||
| Fig. 2 XRD patterns of (a) nBT and μBT particles and (b) CNT-nBT/PVDF and CNT-μBT/PVDF composites with fCNT = 0.02. | ||
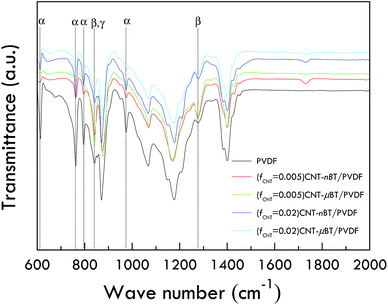
The XRD patterns of a PVDF polymer matrix cannot be observed due to the relatively high intensity of BT polycrystalline ceramics. Thus, phase structures in PVDF cannot be confirmed by the XRD technique. The phase structures of PVDF must be confirmed. As shown in Fig. 3, the FTIR spectra confirm the existence of α, γ and β-PVDF phases. The spectra of α and β-phase is easy to observe, while γ and β-phases are difficult to separate at the wavenumber of about 840 cm−1.19
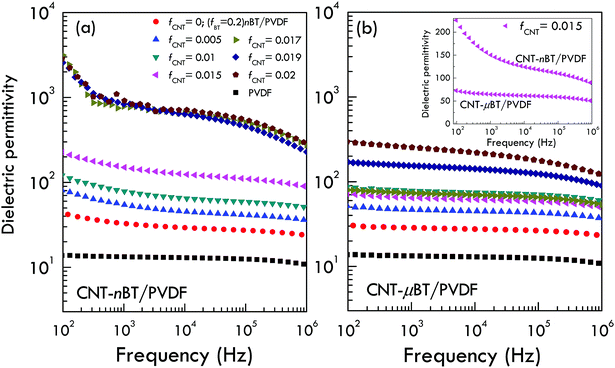
The influences of CNT loading on the dielectric properties of the CNT-nBT/PVDF and CNT-μBT/PVDF composites in the frequency range of 102 to 106 Hz are shown in Fig. 4. For both composite systems, the dielectric permittivity increases with increasing CNT loading. According to the previous report,24 the formation of micro-capacitors, in which CNT behaves as electrodes separated by a dielectric layer of PVDF and/or BT particle, was described as one of the reasons for the observed enhanced dielectric permittivity with suppressing dielectric loss. However, other important factors should be considered as well such as the interparticle distance between adjacent BT particles and between CNTs. The overall results show that the dielectric permittivity of the CNT-μBT/PVDF composites is more stable with the frequency than that of the CNT-nBT/PVDF composites for all fCNT. As clearly seen in the inset of Fig. 4(b), the low-frequency dielectric permittivity for the CNT-nBT/PVDF composite with fCNT = 0.015 is strongly dependent on frequency; while it is nearly independent on the frequency for the CNT-μBT/PVDF composite. The large low-frequency dependence of the dielectric permittivity of the CNT-nBT/PVDF composites is likely due to the interfacial polarization.14,19
The dielectric loss tangent as a function of the frequency at room temperature for both composite systems is illustrated in Fig. 5. The low-frequency loss tangent, which is usually caused by the DC conduction of free charges, of the CNT-nBT/PVDF composites extremely increases when fCNT > 0.015, while the loss tangent of the CNT-μBT/PVDF composites slightly increased even at the low-frequency of 102 Hz. On the other hand, the loss tangent of the PVDF-based composites in a high-frequency range is caused by the dielectric relaxation of permanent dipoles in the composites.21 As shown in Fig. 6, the variations in the low-frequency AC conductivity, which can be estimated to the DC conductivity, for both composite systems are similar to changes of their low-frequency loss tangents. The DC conductivity of the CNT-nBT/PVDF composites dramatically increases by three orders of magnitude when fCNT > 0.015. On the other hand, an extreme change in the DC conductivity is not observed in the CNT-μBT/PVDF composites, as shown in the inset of Fig. 7. Thus, the increase in the loss tangent of the CNT-μBT/PVDF composites is inhibited by the suppressed formation of the DC conduction path in the PVDF matrix. It is worth noting that, at 103 Hz, the low loss tangent (0.06) and DC conductivity (6.82 × 10⁻⁹ S cm−1) are obtained in the CNT-μBT/PVDF composite with fCNT = 0.019, while its dielectric permittivity is significantly enhanced (≈155). With further increasing fCNT = 0.02, the dielectric permittivity is greatly increased to ≈254 and the loss tangent is suppressed by ≤0.1. The dielectric properties of the CNT-μBT/PVDF composites with fCNT = 0.019–0.02 can be comparable to those reported in the (8.2 vol%) Ag–(48.6 vol%) nBT/PVDF composite (ε′ ≈ 160 and tan![[thin space (1/6-em)]](https://www.rsc.org/images/entities/char_2009.gif) δ ≈ 0.11 at 1 kHz).8 Notably, the CNT-μBT/PVDF composites used only a small amount of fillers (i.e., CNT and μBT) with the total volume fraction of ≈0.22. A list of the dielectric properties of the CNT-BT/PVDF composites with different size of BT and volume fractions are summarized in Table 1. As reported in many previous works,24,29–31 the composites filled with BT nanoparticles have high loss tangent values (≫0.1) or low dielectric permittivity due to a non-polar cubic phase. In this work, although the low-frequency dielectric permittivity of the CNT-nBT/PVDF composites can be increased to the level of 103, the loss tangent is also largely enhanced. These results indicate the important effect of BT particle sizes used on the way to optimize the dielectric properties of polymer composites.
δ ≈ 0.11 at 1 kHz).8 Notably, the CNT-μBT/PVDF composites used only a small amount of fillers (i.e., CNT and μBT) with the total volume fraction of ≈0.22. A list of the dielectric properties of the CNT-BT/PVDF composites with different size of BT and volume fractions are summarized in Table 1. As reported in many previous works,24,29–31 the composites filled with BT nanoparticles have high loss tangent values (≫0.1) or low dielectric permittivity due to a non-polar cubic phase. In this work, although the low-frequency dielectric permittivity of the CNT-nBT/PVDF composites can be increased to the level of 103, the loss tangent is also largely enhanced. These results indicate the important effect of BT particle sizes used on the way to optimize the dielectric properties of polymer composites.
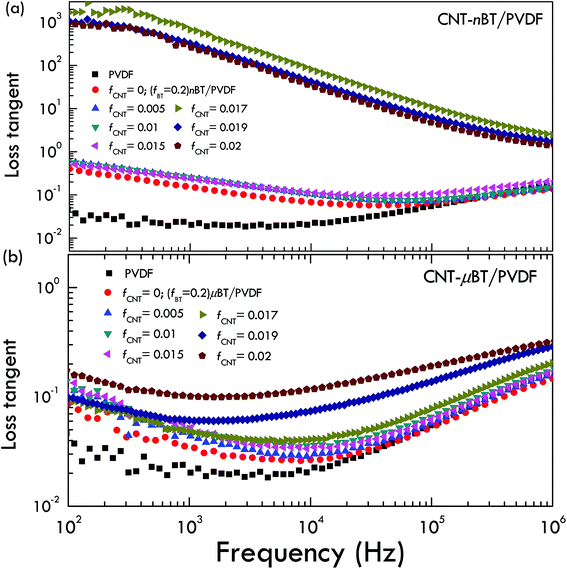 | ||
| Fig. 5 Frequency dependence of loss tangent at RT for (a) CNT-nBT/PVDF and (b) CNT-μBT/PVDF composites with different fCNT contents. | ||
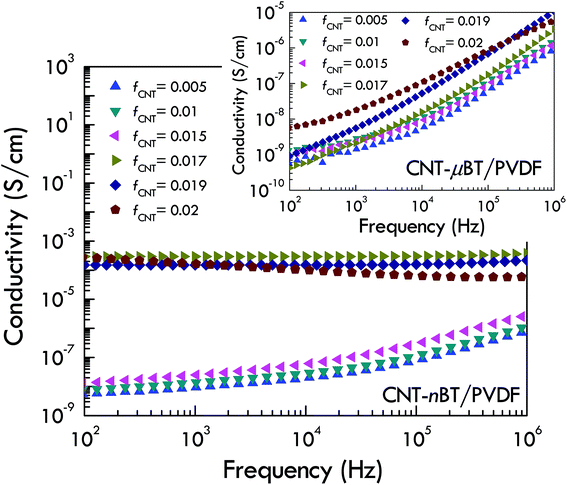 | ||
| Fig. 6 AC conductivity at RT for CNT-nBT/PVDF composites with different fCNT contents; inset shows AC conductivity of CNT-μBT/PVDF composites. | ||
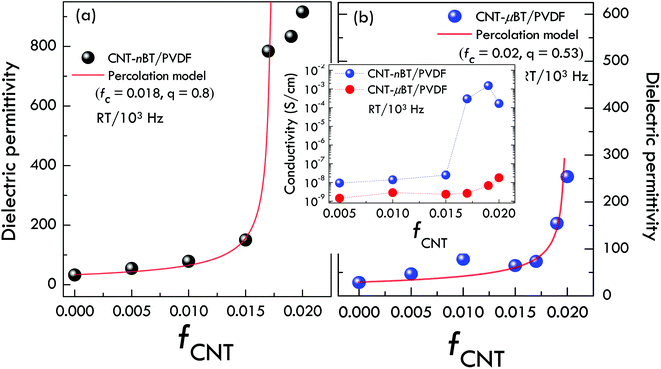 | ||
| Fig. 7 Percolation plots of the dielectric permittivity of (a) CNT-nBT/PVDF and (b) CNT-μBT/PVDF composites; inset shows AC conductivity as a function of fCNT. | ||
![[thin space (1/6-em)]](https://www.rsc.org/images/entities/char_2009.gif) δ) at RT for CNT-BT/PVDF composites in this work and reported in literature
δ) at RT for CNT-BT/PVDF composites in this work and reported in literature
| CNT-BT/PVDF composites | BT size | ε′ (1 kHz) | tan![[thin space (1/6-em)]](https://www.rsc.org/images/entities/char_2009.gif) δ (1 kHz) δ (1 kHz) |
Ref. | |
|---|---|---|---|---|---|
| fCNT (vol%) | fBT (vol%) | ||||
| 2.0 | 10–20 | 100 nm | ∼600–675 | ∼101 to 102 | 24 |
| 4.0 | 22.8 | ∼78 nm | 52.68 | ∼0.055 | 29 |
| 35 | 16.5 | 20 nm | 75 | ∼0.06 | 30 |
| 2.95 | 14.7 | <0.3 μm | ∼512 | ∼101 | 31 |
| 0.5 | 20 | 50–100 nm | 54.4 ± 7.5 | 0.246 ± 0.115 | This work |
| 1.0 | 20 | 78.4 ± 10.9 | 0.253 ± 0.123 | ||
| 1.5 | 20 | 150.1 ± 17.1 | 0.237 ± 0.102 | ||
| 1.7 | 20 | ∼0.5–1.0 μm | 73.5 ± 1.0 | 0.048 ± 0.006 | This work |
| 1.9 | 20 | 154.6 ± 24.8.0 | 0.061 ± 0.095 | ||
| 2.0 | 20 | 253.9 ± 1.8 | 0.100 ± 0.010 | ||
Fig. 7(a) and (b) show the dielectric permittivity of the CNT-nBT/PVDF and CNT-μBT/PVDF composites at 1 kHz as a function of fCNT. The dielectric permittivity of the CNT-nBT/PVDF and CNT-μBT/PVDF composites rapidly increases when fCNT > 0.015 and fCNT > 0.017, respectively. Usually, the rapid change in the dielectric properties of insulator matrix composites filled with conductive phase is associated with the percolation effect.32 Accordingly, a dramatic increase in the effective dielectric permittivity  of the composites would obey the power law:3,32
 | (1) |
 is the dielectric permittivity of the BT–PVDF matrix, fc is the percolation threshold, q is a constant value, and f = fCNT. The dependence of the dielectric permittivity on fCNT is well described by eqn (1), Fig. 7. According to the fitted curves, fc and q are obtained. fc values of the CNT-nBT/PVDF and CNT-μBT/PVDF composites are 0.018 and 0.02, respectively, while q values are about 0.8 and 0.53. Usually, the lower limit of the normal range for q is 0.8–1.32 For the CNT-μBT/PVDF composite, q ≈ 0.53 is far from the lower limit of the normal range, indicating a relatively slow-increase in the dielectric permittivity compared to the CNT-nBT/PVDF composites as fCNT was increased.
Generally, for two-dimensional conductor/polymer composites, fc is dependent on the aspect ratio of the conductive phase used as well as the distribution of fillers.32 The dielectric properties of two-phase CNT/PVDF composite system with an aspect ratio of CNT of about 550–830 have also been studied. As demonstrated in Fig. 8(a) and (b), the dielectric permittivity and the loss tangent of the CNT/PVDF composites rapidly increase in the range of fCNT = 0.005–0.01. Thus, fc can roughly be estimated to be ≈0.005–0.01. It is observed that the fc value of the CNT/PVDF composites can be increased by incorporating with nBT and μBT particles. As demonstrated in Fig. 8(b) and the inset of Fig. 7, for the composites with fCNT ≤ 0.015, the loss tangent and the conductivity of the three-phase composites slightly change with increasing fCNT compared to the CNT/PVDF composites. This result indicates that the BT particles play an essential role to block the connection of CNT or inhibit the formation of the conductive pathway in the PVDF polymer matrix. It was clearly shown that the BT particles could disperse CNT well, increasing fc.30 Furthermore, it is observed that the dielectric permittivity, loss tangent, and conductivity of the CNT-nBT/PVDF composites suddenly increase when fCNT > 0.015. The loss tangent and conductivity are increased by more than three orders of magnitude, indicating the formation of conduction pathway or percolation network. In contrast, the increase in the loss tangent and conductivity of the CNT-μBT/PVDF composites, which is usually due to the increase in conductive phase, is suppressed even at fCNT = 0.02. This result may be due to the ability of μBT to inhibit the formation of the conductive pathway. As shown in Fig. 1, the agglomeration of nBT particles was observed in the microstructure of the CNT-nBT/PVDF composites due to a high surface energy of the small-sized nBT particles. Although the distribution of CNT is difficult to observe by the SEM technique, it is likely that CNT is not dispersed well due to the agglomeration of nBT. Some parts of CNT can easily connect and form a conductive network, giving rise to the increase in conductivity and correlated loss tangent. In contrast, the suppressed conductivity and loss tangent in the CNT-μBT/PVDF composites even at fCNT = 0.02 may be due to a better distribution of CNT, which was well dispersed by the μBT particles. In this case, the increase in dielectric permittivity, which may be originated from the formation of micro-capacitors, is not accompanied by the significant increase in loss tangent and conductivity. Another important signifies to the formation of micro-capacitors is the slight frequency dependence of the dielectric permittivity, as shown in Fig. 4(b). The strong frequency dependence of the dielectric permittivity is usually associated with the long-range motion of free charges, resulting from the formation of percolation network. Therefore, it is strongly recommended that the best suitable size of BT for using in a polymer matrix composite is about 0.5 μm due to its fully tetragonal phase and the size is not too large for applications and is not too small to cause an agglomeration of nBT.
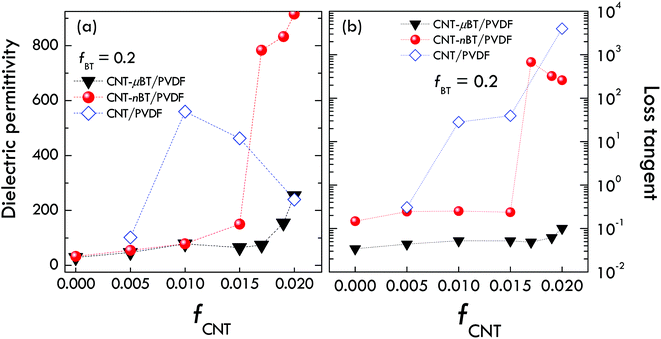 | ||
| Fig. 8 Comparison of (a) dielectric permittivity and (b) loss tangent at RT and 1 kHz for 3-phase CNT-nBT/PVDF and CNT-μBT/PVDF composites (fCNT = 0–0.02) as well as 2-phase CNT/PVDF composites. | ||
According to the micro-capacitor model, the dielectric permittivity of the CNT-nBT/PVDF composite should be lower than that of the CNT-μBT/PVDF composite due to a lower dielectric permittivity of nBT particles compared to μBT particles. In this work, this mechanism may contribute to the overall dielectric response, but it may not be the primary mechanism in the CNT-nBT/PVDF and CNT-μBT/PVDF composites because of the higher dielectric permittivity of the CNT-nBT/PVDF composite, as shown in the inset of Fig. 4. The large increase in the dielectric permittivity of the CNT-μBT/PVDF composites and its exceptional low value of the loss tangent should be primarily associated with their characteristics of interfacial polarization. As well known, the interfacial polarization in the polymer composites is dependent on several factors such as electrical conductivity and aspect ratio of the conductive filler as well as the interparticle distance between the adjacent filler particles. The difference between BT sizes causes different interparticle distances. Accordingly, the interparticle distance of the CNT-nBT/PVDF composite is shorter than that of the CNT-μBT/PVDF composite. Thus, the relative interparticle distance between CNT in the CNT-nBT/PVDF composite is shorter, giving rise to higher dielectric permittivity. On the other hand, the CNT are easily contacted together, giving rise to high conductivity and related low-frequency loss tangent due to tunneling.
For the CNT-μBT/PVDF composites, the largely increased dielectric permittivity is primarily contributed by both of a high permittivity of μBT particles and the strong interface polarization. The low loss tangent (≈0.06) is due to longer interparticle distances of the adjacent μBT particles and longer relative-interparticle distance between CNT. Thus, the CNT is difficult to form the conduction network. Electron tunneling was inhibited due to a long interparticle distance between CNT.
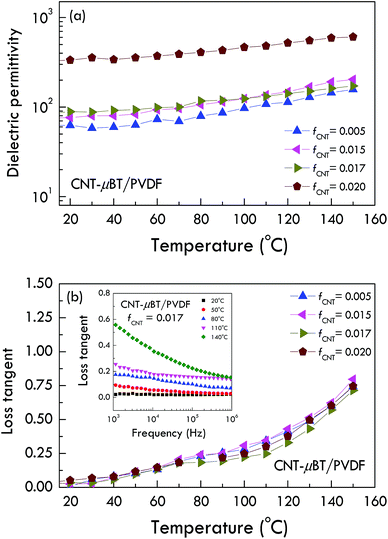
It is worth noting that the significantly improved dielectric properties were achieved in the CNT-μBT/PVDF composites, which could be used in flexible capacitor applications. One of the most important data for capacitor applications is the temperature dependence behavior of the dielectric properties. Thus, the temperature dependence of the dielectric properties of the CNT-μBT/PVDF composites was investigated. As illustrated in Fig. 9(a), interestingly, the dielectric permittivity of the CNT-μBT/PVDF composites is slightly dependent on temperature in the range of 20 to 150 °C. However, as shown in Fig. 9(b), the loss tangent also increases continuously with increasing temperature, indicating to the increase in the conductivity of the composites. As shown in the inset of Fig. 9(b), it is observed that the results are not showing any scattering, indicating to good electrode made. Therefore, the effect of electrode on the dielectric properties of the CNT-μBT/PVDF composites can be ignored. The obtained dielectric properties are mainly resulted from the inner part of the composite samples.
4. Conclusions
The dielectric and electrical properties of CNT-nBT/PVDF and CNT-μBT/PVDF composites with 20 vol% BT have been investigated to optimize the BT sizes and CNT volume fractions for obtaining a high polymer dielectric performance. The rapid changes of the dielectric behavior for both three-phase composite systems are similar, but occur when fCNT > 0.015 and > 0.017, respectively. The percolation theory can well describe the dielectric permittivity as a function of fCNT for both systems. The rapid increase in the dielectric permittivity of the CNT-nBT/PVDF composites is accompanied by the significant enhancements of the loss tangent and conductivity. Notably, the increased loss tangent and conductivity of the CNT-μBT/PVDF composites are retained to low values of ≈0.06 and 6.82 × 10⁻⁹ S cm−1, while the dielectric permittivity is significantly increased (≈155 at 103 Hz and RT) with slightly dependent on frequency. Interestingly, the greatly enhanced dielectric permittivity of ≈253.8 with suppressing tan![[thin space (1/6-em)]](https://www.rsc.org/images/entities/char_2009.gif) δ ≤ 0.1 is achieved by further increasing fCNT = 0.02. Good dielectric performance of the CNT-μBT/PVDF composites are attributed to the interfacial polarization in the composites and the tetragonal phase of μBT.
δ ≤ 0.1 is achieved by further increasing fCNT = 0.02. Good dielectric performance of the CNT-μBT/PVDF composites are attributed to the interfacial polarization in the composites and the tetragonal phase of μBT.
Conflicts of interest
There are no conflicts to declare.Acknowledgements
This work was financially supported by the Synchrotron Light Research Institute, Khon Kaen University, and the Thailand Research Fund (TRF) [Grant No. BRG6180003]. This work has been partially supported by the Research Network NANOTEC (RNN) program of the National Nanotechnology Center (NANOTEC), NSTDA, Ministry of Science and Technology and Khon Kaen University, Thailand. K. Silakaew would like to thank the Thailand Research Fund under The Royal Golden Jubilee PhD Program [Grant Number PHD/0213/2558] for her PhD scholarship.References
- Z.-M. Dang, J.-K. Yuan, J.-W. Zha, T. Zhou, S.-T. Li and G.-H. Hu, Prog. Mater. Sci., 2012, 57, 660–723 CrossRef CAS.
- P. Martins, A. C. Lopes and S. Lanceros-Mendez, Prog. Polym. Sci., 2014, 39, 683–706 CrossRef CAS.
- Z. Spitalsky, D. Tasis, K. Papagelis and C. Galiotis, Prog. Polym. Sci., 2010, 35, 357–401 CrossRef CAS.
- L. Zhu and Q. Wang, Macromolecules, 2012, 45, 2937–2954 CrossRef CAS.
- M.-Y. Tse, X. Wei, C.-M. Wong, L.-B. Huang, K.-h. Lam, J. Dai and J. Hao, RSC Adv., 2018, 8, 32972–32978 RSC.
- K. Meeporn, P. Thongbai, T. Yamwong and S. Maensiri, RSC Adv., 2017, 7, 17128–17136 RSC.
- K. Meeporn, S. Maensiri and P. Thongbai, Appl. Surf. Sci., 2016, 380, 67–72 CrossRef CAS.
- S. Luo, S. Yu, R. Sun and C.-P. Wong, ACS Appl. Mater. Interfaces, 2014, 6, 176–182 CrossRef CAS PubMed.
- N. Phromviyo, P. Thongbai and S. Maensiri, Appl. Surf. Sci., 2018, 446, 236–242 CrossRef CAS.
- N. Phromviyo, N. Chanlek, P. Thongbai and S. Maensiri, Appl. Surf. Sci., 2018, 446, 59–65 CrossRef CAS.
- P. Hu, Z. Jia, Z. Shen, P. Wang and X. Liu, Appl. Surf. Sci., 2018, 441, 824–831 CrossRef CAS.
- X. Zhang, S. Zhao, F. Wang, Y. Ma, L. Wang, D. Chen, C. Zhao and W. Yang, Appl. Surf. Sci., 2017, 403, 71–79 CrossRef CAS.
- K. Meeporn, P. Thongbai, S. Maensiri and P. Chindaprasirt, J. Mater. Sci.: Mater. Electron., 2017, 28, 11762–11768 CrossRef CAS.
- Z.-M. Dang, H.-P. Xu and H.-Y. Wang, Appl. Phys. Lett., 2007, 90, 012901 CrossRef.
- S.-H. Yao, Z.-M. Dang, M.-J. Jiang and J. Bai, Appl. Phys. Lett., 2008, 93, 182905 CrossRef.
- P. Thomas, K. T. Varughese, K. Dwarakanath and K. B. R. Varma, Compos. Sci. Technol., 2010, 70, 539–545 CrossRef CAS.
- B.-H. Fan, J.-W. Zha, D. Wang, J. Zhao and Z.-M. Dang, Appl. Phys. Lett., 2012, 100, 012903 CrossRef.
- Y.-l. Su, C. Sun, W.-q. Zhang and H. Huang, J. Mater. Sci., 2013, 48, 8147–8152 CrossRef CAS.
- K. Silakaew, W. Saijingwong, K. Meeporn, S. Maensiri and P. Thongbai, Microelectron. Eng., 2015, 146, 1–5 CrossRef CAS.
- T. Wang, Z. Wang, C. Wang and Y.-J. Xiao, Ceram. Int., 2017, 43, S239–S243 CrossRef CAS.
- Z. Wang, M. Fang, H. Li, Y. Wen, C. Wang and Y. Pu, Compos. Sci. Technol., 2015, 117, 410–416 CrossRef CAS.
- P. Kum-onsa, P. Thongbai, S. Maensiri and P. Chindaprasirt, J. Mater. Sci.: Mater. Electron., 2016, 27, 9650–9655 CrossRef CAS.
- J. Fu, Y. Hou, Q. Wei, M. Zheng, M. Zhu and H. Yan, J. Appl. Phys., 2015, 118, 235502 CrossRef.
- Z.-M. Dang, S.-H. Yao, J.-K. Yuan and J. Bai, J. Phys. Chem. C, 2010, 114, 13204–13209 CrossRef CAS.
- S. Luo, S. Yu, F. Fang, M. Lai, R. Sun and C.-P. Wong, Appl. Phys. Lett., 2014, 104, 252903 CrossRef.
- K. Uchino, E. Sadanaga and T. Hirose, J. Am. Ceram. Soc., 1989, 72, 1555–1558 CrossRef CAS.
- G. Arlt, D. Hennings and G. d. With, J. Appl. Phys., 1985, 58, 1619–1625 CrossRef CAS.
- S. M. Aygün, J. F. Ihlefeld, W. J. Borland and J.-P. Maria, J. Appl. Phys., 2011, 109, 034108 CrossRef.
- Y. Jin, N. Xia and R. A. Gerhardt, Nano Energy, 2016, 30, 407–416 CrossRef CAS.
- M. Zhao, Q. Fu, Y. Hou, L. Luo and W. Li, ACS Omega, 2019, 4, 1000–1006 CrossRef CAS.
- B. Fan, M. Zhou, C. Zhang, Y. Liu, D. He and J. Bai, Mater. Res. Express, 2019, 6, 075071 CrossRef.
- C. W. Nan, Y. Shen and J. Ma, Annu. Rev. Mater. Res., 2010, 40, 131–151 CrossRef CAS.
| This journal is © The Royal Society of Chemistry 2019 |

