
 Open Access Article
 This Open Access Article is licensed under a Creative Commons Attribution-Non Commercial 3.0 Unported Licence
Effects of dietary intake of potatoes on body weight gain, satiety-related hormones, and gut microbiota in healthy rats†
Yu Wua,
Honghai Hua,
Xiaofeng Daia,
Huilian Chec and
Hong Zhang *ab
*ab
aInstitute of Food Science and Technology, Chinese Academy of Agricultural Sciences (CAAS)/Key Laboratory of Agro-Products Processing, Ministry of Agriculture, Beijing 100193, China. E-mail: zhang.h07@hotmail.com; Fax: +86 10 6289 3899; Tel: +86 10 6281 1401
bHefei CAAS Nutridoer Co. Ltd., Hefei 238000, China
cCollege of Food Science and Nutritional Engineering, China Agricultural University, Beijing 100083, China
First published on 17th October 2019
Abstract
Potatoes, as a prominent staple food, have exerted diverse intestinal health benefits, but few studies have addressed the gut microecology modulatory effects of consuming potatoes in realistic quantities. The objective of this study was to evaluate the effects of ingesting potatoes in different doses on body weight gain (BWG), food intake, short chain fatty acids (SCFAs), fecal microbiota, gut hormones, and colon morphology of healthy rats. Male Sprague-Dawley rats of 6–8 weeks old were randomized to five groups and fed AIN-93 G or diets containing graded concentrations of potato powder (low, medium, high, and higher) for 7 weeks. Accordingly, the final body weight was significantly lower for rats fed the high and/or higher potato diets than their control counterparts (P < 0.05). Potato intervention caused a significant dose-dependent increment in full cecum, and SCFAs production. The relative abundance of “S24-7” (order Bacteroidales), Bifidobacterium, “NK3B31” (family Prevotellaceae), Parasutterella, and Ruminococcus_1 increased in high and higher potato diets. Furthermore, a Spearman's correlation analysis revealed that Parasutterella was negatively correlated with BWG, triglyceride (TG), and low-density lipoproteins (LDL). The maximum number of goblet cells, longest crypt depth, and highest level of PYY were found in the distal colon of rats fed higher potato diets. The results suggested that potato powder could provide the potential for hopeful impact on weight control.
Introduction
As a worldwide prevalent staple crop, potato tubers are not solely an energy supply, but also high in dietary fiber (resistant starch and non-starch polysaccharide) and have a wide array of health promoting phytochemicals like chlorogenic acid (belonging to polyphenol), which could contribute to weight control and proliferation of beneficial bacteria.1,2 The nutritional content claim of “high in dietary fiber” might be attributed to the high resistant starch type 2 (RSII) levels in raw potatoes, which are digestion-resistant in the small intestine but can be fermented by the cecal and colonic microbial population.3 In 2017, China ranked the highest in potato production with 99 million metric tons.4 In China, potato freeze-dried powder, which contains amounts of RSII and varieties of phytonutrients, can be regarded as an excellent raw material for producing potato staple foods with other Chinese staples like noodles, Mantou, rice and rice noodles based on the trait of Chinese diet culture.5 Potatoes have been maligned as a contributor to the increasing risks of metabolic syndrome such as obesity, diabetes, and cardiovascular disease.6 Actually, they should enjoy a “good” reputation due to their high-value protein, rich vitamin C and abundant minerals like K, P, but with no cholesterol, “fat free” and “salt free” instead of the “bad” reputation marked as being “fattening”.7 There are currently conflicting reports in the epidemiological studies regarding the relationship between potato intake and predictors of obesity including weight gain, body mass index (BMI) and waist circumference (WC). A majority of studies have recognized that intake of French fries may be associated with weight gain or increased BMI and then increase the risks of obesity.8–11 Potato filled with high calorie lipid additions rather than potato itself may be the culprit.12 Four large cohorts also revealed that a subsequent gain at the weight or waist was positively correlated with potatoes and/or potato chips,13,14 while other investigations have observed that fiber from potatoes was not significantly associated with subsequent changes in weight or WC.15 As a consequence, no convincing evidence was obtained from observational studies for supporting an association between potato consumption and obesity.Prebiotics dietary fiber and “prebiotic-like” polyphenols in potato tubers have been proven to facilitate gastrointestinal health via restoring intestinal epithelial barrier function or shaping gut microbiome, and releasing extensive bacterial-derived metabolites, like short chain fatty acids (SCFAs).16–18 In the colon, dietary polyphenols are hydrolysed to different bioavailable phenolic metabolites by microbiota like Bacteroides, Enterococcus, Lactobacillus and Bifidobacterium species.19 Then the smaller metabolites can be absorbed through the colonic epithelium via several reactions such as C-ring cleavage, demethylation, reduction and dehydroxylation.19,20 On the other hand, the binding of polyphenols to the pathogenic bacterial cell membranes disturbs the function of membrane and thus inhibits the bacterial growth.21 Collectively, phenolic compounds exert prebiotic effects due to their anti-oxidative and anti-inflammatory capabilities.17 Previous investigations have summarized that raw potato starch, potato fiber, potato anthocyanins, and potato chlorogenic acid can individually or together enrich Lactobacillus, Bifidobacterium, Ruminococcus, Prevotella, and Turicibacter in rats, pigs, dogs or human.22–25
Notoriously, a chronic intake of excessive energy and expenditure of too few calories result in positive energy balance and weight gain, thus subsequently progress to obesity, which was accompanied by some metabolic abnormalities like type 2 diabetes and hypertension.26,27 In terms of weight management of overweight or obese practitioners, the modification of lifestyle including eating weight-loss diets and increasing physical activities was prior to pharmacotherapy and bariatric surgery.27 More recently, emerging data has established a novel gut-microbiota-targeted strategy for maintaining a healthy weight even curing obesity by dietary treatments, including prebiotics and probiotics.28 Diverse intestinal microbial-derived metabolites such as SCFAs, γ-aminobutyric acid (GABA), serotonin (5-HT), and other neurotransmitters (NTs) have demonstrated the regulatory effects on the host metabolism and appetite via stimulating enteroendocrine cells (EECs) to secrete satiety-related gut hormones including glucagon-like peptide-1 (GLP-1), peptide tyrosine–tyrosine (PYY), and cholecystokinin (CCK).28
Multiple studies have reported the anti-obesity or lipid metabolism modulatory effects of entire potatoes, potato protein, potato resistant starch or potato fibers,23,29–33 but few have investigated the effects of consuming potatoes realistically based on the recommended nutrient intake in the daily diet. In this study, healthy Sprague-Dawley rats were fed with potato powders from a local Chinese cultivar in different doses for 7 weeks and the constitution of fecal microbiota was determined using MiSeq sequencing for assessing the influences of dietary potato intervention.
Materials and methods
Preparation of potato powder
Potato tubers (Solanum tuberosum L.) of Zhongshu No. 18 were obtained from Dingbian (Shaanxi, China). The tubers were cleaned with cold tap water to remove soil residue on the surface, and dried with tissue paper. Then they were peeled with a potato peeler, and cut into small strips. Next all the strips were subjected to a lyophilized process, milled to fine powder using a rotor mill, and sieved through a 70 mesh sieve. All the freeze-dried powder was eventually packed in a ziplock bag at room temperature (±23 °C). The macronutrients and micronutrients (dry matter, crude protein, crude fat, ash, total dietary fiber, and vitamins) of Zhongshu No. 18 were analyzed at Key Laboratory of Agro-Products Processing (Beijing, China) according to the Association of Analytical Chemists methods (AOAC methods).34 The determination of resistant starch content was executed by using a commercial Resistant Starch Assay Kit (K-RSTAR, Megazyme, Bray, Ireland). The contents of minerals K, P, and Mg were analyzed by ICP-MS (7700, Agilent Technologies, Santa Clara, CA, USA). The total antioxidant capacity was determined by the ABTS (2,2′-azinobis-(3-ethylbenzothiazoline-6-sulfonic acid)) method using a commercial T-AOC Assay Kit (S0119, Beyotime Biotech Inc., Shanghai, China). The total content of phenolic compounds was evaluated using Folin–Ciocalteu reagent35 and expressed as an equivalent of the gallic acid (GAE) per 100 g of dry matter (DM). The identification and quantification of antioxidant compounds (chlorogenic acid, caffeic acid, ferulic acid, and coumaric acid) were implemented by HPLC (e2695, Waters Corporation, Milford, MA, USA).Ethics statement and animals
All animal procedures were performed in accordance with the Guidelines for Care and Use of Laboratory Animals of China Agricultural University and approved by the Animal Ethics Committee of College of Food Science and Nutritional Engineering, China Agricultural University. Sixty male specific pathogen free (SPF) Sprague-Dawley rats (180–220 g) from Weitong Lihua Experimental Animal Technology Co., Ltd. (Beijing, China) with 6–8 weeks old were acclimatized to the control diet and environment for 1 week. These animals were housed in individual cages and supplied with fresh water and diets made by Beijing Huafukang Bioscience Co., Inc. (Beijing, China) ad libitum throughout the experiment. All the cages were placed in a room maintained at a constant temperature (23 ± 3 °C) and humidity (55 ± 10%) with a 12![[thin space (1/6-em)]](https://www.rsc.org/images/entities/char_2009.gif) :12 h of light:dark cycle.
:12 h of light:dark cycle.
Test diets
The total rats were randomly assigned to five different groups (n = 12 rats per group, 4 per cage): group 1, control group, AIN-93 G diet (CO); group 2, low concentration of potato group (PL); group 3, medium concentration of potato group (PM); group 4, high concentration of potato group (PH); group 5, higher concentration of potato group (PHer). According to the Dietary Guidelines for Chinese Residents,36 cereals and tubers intake amount was 300 g per day (267 g dry mass per day). Potato, as the versatile staple foodstuff, can be an alternative for 50% of Chinese daily consumption of cereals and tubers (i.e. 133.5 g). The amount can be defined as the medium concentration. The average weight of human adult in China is approximately 60 kg. The PM dose for rats was calculated from the following formula on the basis of the guidance for dosage conversion between animals and human:37
 | (1) |
Rat equivalent dose (mg kg−1) = 13720.
Therefore in this experiment, the dosage of PM was 13.72 g per kg per animal, which accounts for 13.72% of their total food intake. The PL, PH, and PHer doses for rats were prepared by 50%, 2-fold or 4-fold of PM dosage. The corresponding concentrations were 6.86, 27.44, and 54.88 g kg−1, respectively. The complete constituents of the test diets are listed in Table 1. Ash, crude protein, total dietary fiber and crude fat contents determination of diet samples was carried out according to the AOAC methods.34 Carbohydrate content (g per 100 g DW) was calculated by subtracting the sum of percent ash, crude fat, crude protein, and total dietary fiber contents from 100. Energy (E, kcal per g DW) was calculated by the formula as follows: E = [(g fat/g DW) × (9 kcal g−1)] + [(g protein/g DW) × (4 kcal g−1)] + [(g carbohydrate/g DW) × (4 kcal g−1)]. The whole experiment lasted 49 days. The food intake and the body weight of each rat were measured and recorded every 3 days.
| Source | CO (AIN-93 G) | PL | PM | PH | PHer |
|---|---|---|---|---|---|
| a CO: rats fed with an AIN-93 G diet; PL–PHer: rats separately fed with a low, medium, high or higher concentration of potato diet. | |||||
| Casein | 200 | 200 | 200 | 200 | 200 |
| Cystine | 3 | 3 | 3 | 3 | 3 |
| Potato powder | — | 68.5 | 138 | 275 | 497 |
| Cornstarch | 397 | 328.5 | 259 | 122 | 0 |
| Maltodextrin | 132 | 132 | 132 | 132 | 132 |
| Sucrose | 100 | 100 | 100 | 100 | 0 |
| Cellulose | 50 | 50 | 50 | 50 | 50 |
| Soy oil | 70 | 70 | 70 | 70 | 70 |
| TBHQ | 0.014 | 0.014 | 0.014 | 0.014 | 0.014 |
| M1003G | 35 | 35 | 35 | 35 | 35 |
| V1002 | 10 | 10 | 10 | 10 | 10 |
| Choline bitartrate | 2.5 | 2.5 | 2.5 | 2.5 | 2.5 |
| Total | 1000 | 1000 | 1000 | 1000 | 1000 |
|
|||||
| Main constituent (g per 100 g DW) | |||||
| Protein | 18.19 | 18.29 | 18.96 | 20.22 | 21.36 |
| Ash | 2.61 | 2.97 | 3.18 | 3.74 | 4.54 |
| Fat | 7.61 | 6.89 | 6.99 | 6.88 | 7.52 |
| Fiber | 3.79 | 4.25 | 4.50 | 4.75 | 5.12 |
| Carbohydrate | 67.80 | 67.60 | 66.37 | 64.41 | 61.46 |
| Energy (kcal per g DW) | 4.20 | 4.14 | 4.13 | 4.10 | 4.09 |
Blood, feces and tissue samples collection
After 7 week period of dietary treatment, the rats were weighed after overnight fasting, and then subjected to euthanasia by CO2 anaesthesia. Final blood samples from the rats eyes orbital venous plexus were collected into the 2 mL plastic centrifuge cubes before sacrifice. Then one blood sample (1 mL) was allowed for centrifugation (10 min, 3000 × g, 4 °C) to obtain the serum. Another blood sample (1 mL) was placed into tubes containing ethylene diamine tetraacetic acid dipotassium (EDTAK2, 10 μL) and then collected after centrifugation (10 min, 3000 × g, 4 °C). All the serum and plasma were stored at −80 °C until further biochemical and gut hormones analysis, respectively. After sacrifice, tissues from liver, full cecum and distal colon were immediately removed and weighed. Samples of distal colon were collected and fixed in formalin for future periodic acid–Schiff (PAS) staining. Colonic feces from each rat were collected in sterile tubes and stored at −80 °C until analysis of SCFAs and microbiota analysis.Blood biochemical and gut hormones analysis
The serum lipid profiles including total cholesterol (TC), triglyceride (TG), high-density lipoproteins (HDL), and low-density lipoproteins (LDL) were measured using an automatic biochemical analyzer (7020, Hitachi Ltd., Tokyo, Japan). The quantitative determination of PYY and GLP-1 in plasma was obtained using a specific ELISA kit, respectively (PYY: CSB-E13432r; GLP-1: CSB-E08117r, CUSABIO TECHNOLOGY LLC, Wuhan, China).Histological analysis
The distal colons of 6 rats per group were fixed in 4% paraformaldehyde. Paraffin-embedded sections of 3 μm thick were stained with PAS for observation through a microscope (ECLIPSE Ci; Nikon Corporation, Tokyo, Japan). The colon crypt depth and the number of goblet cells per crypt were measured and counted using Image-Pro Plus analysis software (version 6.0) by visualizing at 20× magnification. 15 intact colon crypts were randomly selected from three different fields of histological sections per rat, and used for determining the depth and goblet cell numbers.SCFAs determination
Gas chromatography analysis (7890 A, Agilent Technologies, Inc., Santa Clara, CA, USA) of SCFAs concentrations in colonic feces was executed as described by Trompette et al.38 with minor modifications. Duplicates of 100 mg lyophilized feces was mixed with 250 μL Milli-Q water and then acidified with 50 μL of 25% metaphosphoric acid (w:v) for 30 min on ice. Subsequently after centrifugation (15 min, 5000 × g, 4 °C), 200 μL of the supernatant of each sample was filtered through 0.22 μm membrane. Each filtrate (1 μL) was directly onto a DB-FFAP column (15 m × 320 μm × 0.25 μm) with the injector and detector temperature of 250 °C and 280 °C, respectively. Helium was served as the carrier gas. Acetate, propionate, butyrate, iso-butyrate, valerate, and iso-valerate were identified and quantified by retention times and calibration curves. Finally the results were expressed in μmol g−1 of dry weight feces. Total SCFAs was determined as the sum of the above-mentioned six acids. Additionally, iso-butyrate, valerate, and iso-valerate were regarded as the branched-chain fatty acids (BCFAs).39
Fecal microbiota analysis
The total genomic DNA from colonic feces was extracted using the E.Z.N.A.® Soil DNA Kit (OMEGA Bio-Tek, Norcross, GA, USA) following the manufacturer's protocols. The isolated DNA concentrations were determined by a Nano-Drop 2000 spectrophotometer. Bar-coded forward primer 338F (5′-ACTCCTACGGGAGGCAGCAG-3′) and reverse primer 806R (5′-GGACTACHVGGGTWTCTAAT-3′) were adopted for the V3–V4 hypervariable region of the 16S rRNA gene amplification. A total volume of 20 μL mixture was consisted of 4 μL 5 × FastPfu Buffer, 2 μL dNTPs (2.5 mM), 0.4 μL FastPfu Polymerase, 0.8 μL each primer (5 μM), and 10 ng template DNA in the PCR assays. PCR cycling was run in a GeneAmp® PCR System 9700 (Thermo Fisher Scientific Inc., Waltham, MA, USA) with reaction parameters as follows: 95 °C for 3 min (initial denaturation), followed by 27 cycles of denaturation at 95 °C for 30 s, 55 °C for 30 s (annealing), 72 °C for 45 s, and with a final extension at 72 °C for 10 min. Amplicon sequencing was conducted on the Illumina Miseq platform at Majorbio Bio-Pharm Technology Co., Ltd. (Shanghai, China). The raw sequences have been submitted to NCBI Sequence Read Archive (SRA) repository under the accession no. SRP135597. Operational taxonomic units (OTU) were generated with clustering set at 97% similarity by UPARSE (version 7.0, http://drive5.com/uparse/). The taxonomy of each 16S rRNA gene sequence was analyzed using RDP Classifier (version 2.2, http://sourceforge.net/projects/rdp-classifier/) against the SILVA (SSU128) reference database.Statistical analysis
Data were statistically analyzed by one-way ANOVA with Bonferroni's multiple comparison tests using SPSS (version 19.0, IBM, Armonk, NY, USA) and expressed as the means ± standard error (SEM). A significant difference was set at P < 0.05. Two-tailed Pearson correlation coefficients were determined to evaluate relationships between variables (body weight gain, food intake, tissue weights, lipid profiles, satiety-related hormones, and colonic SCFAs). Multiple linear stepwise regression analysis by means of β (standardized regression coefficient) and Radj2 (adjusted coefficients of multiple determinations) was employed for predicting the independent effects of food intake, tissue weights, lipid profiles, satiety-related hormones, and colonic SCFAs on body weight gain (BWG).Principal coordinate analysis (PCoA) belonging to the beta diversity analysis was adopted for evaluating the presence of groupings in the data based on unweighted UniFrac distances. Linear discriminant analysis effect size (LEfSe) was applied for elucidating the differences of microbial taxa between rats fed with the control diet and potato-enriched diets by the non-parametric factorial Kruskal–Wallis sum-rank test. Intergroup variations were evaluated by Kruskal–Wallis H test for multiple comparisons or Mann–Whitney U test for pairwise comparison followed by Bonferroni's post-hoc correction. Spearman's analysis and the partial Mantel test were used for estimating the correlations between the colonic microbial community composition and the targeted host biochemical traits (BWG, lipid profiles, satiety-related hormones, and colonic SCFAs).
Results
Nutritional characteristics of potato powder from Zhongshu No. 18
Table 2 represented the contents of macronutrients, micronutrients, and bioactive compounds in tested Zhongshu No. 18 potato powder. The results indicated that Zhongshu No. 18 had an abundance of vitamin C, K, and P, as well as a high antioxidant activity of 1327 ± 42 mg TEAC per 100 g DM. Chlorogenic acid was identified as the most common phenolics in Zhongshu No. 18.| Parameter | Unita | Concentration |
|---|---|---|
| a FM: fresh matter. DM: dry matter. ND: not detected. GAE: gallic acid equivalent. TEAC: trolox equivalent antioxidant capacity. | ||
| Macronutrients | ||
| Dry matter | g per 100 g FM | 23.43 ± 0.40 |
| Crude protein | g per 100 g DM | 10.86 ± 0.23 |
| Crude fat | g per 100 g DM | 2.03 ± 0.03 |
| Total dietary fiber | g per 100 g DM | 7.99 ± 0.31 |
| Soluble dietary fiber | g per 100 g DM | 1.06 ± 0.05 |
| Insoluble dietary fiber | g per 100 g DM | 6.94 ± 0.27 |
| Resistant starch | g per 100 g DM | 63.09 ± 0.09 |
| Ash | g per 100 g DM | 5.36 ± 0.14 |
|
||
| Micronutrients | ||
| Vitamin C | mg per 100 g DM | 61.4 ± 0.04 |
| K | mg per 100 g DM | 2391 ± 48 |
| P | mg per 100 g DM | 195.4 ± 1.4 |
| Mg | mg per 100 g DM | 107.1 ± 2.0 |
|
||
| Individual phenolic compound | ||
| Chlorogenic acid | mg per 100 g DM | 89.88 ± 6.72 |
| Caffeic acid | mg per 100 g DM | 3.64 ± 0.11 |
| Ferulic acid | mg per 100 g DM | ND |
| Coumaric acid | mg per 100 g DM | ND |
| Total phenolic compounds | mg GAE per 100 g DM | 130.1 ± 8.5 |
| Total antioxidant activity | mg TEAC per 100 g DM | 1327 ± 42 |
Effects of potato intake on body weight, body composition and food intake
Generally, a significant decrement in final body weight and/or BWG was observed in the PH- and PHer-fed rats as compared to the rats in CO diet group after 7 weeks of dietary treatment (Table 3), whereas there was no significant difference between the two potato groups. When compared with other two potato-enriched groups, CO group showed no difference. Likewise, the daily food intakes for PH- and PHer-fed rats throughout the 7 week period of experiment were considerably lower than their control counterparts (P = 0.005 and P = 0.000, respectively). Furthermore, the food intake exhibited a lower tendency in the PL and PM groups, but was not statistically significant in relation to CO group.| CO | PL | PM | PH | PHer | |
|---|---|---|---|---|---|
| a CO: rats fed with an AIN-93 G diet; PL–PHer: rats separately fed with a low, medium, high or higher concentration of potato diet.b TC: total cholesterol; TG: triglyceride; HDL: high-density lipoproteins; LDL: low-density lipoproteins. Data are shown as mean ± SEM. Means with different letters (a, b and c) indicate significant differences (Bonferroni's test, P < 0.05), where a > b > c. 1Expressed as pg mL−1; 2expressed as ng mL−1. | |||||
| Weight (g) | |||||
| Final (g) | 491.4 ± 20.9a | 492.6 ± 21.5a | 472.2 ± 8.3ab | 418.2 ± 11.9bc | 367.8 ± 15.2c |
| Gain (g) | 279.5 ± 22.0ab | 288.2 ± 21.0a | 269.6 ± 8.6ab | 221.0 ± 11.6bc | 174.2 ± 15.9c |
| Food intake (kcal per day) | 120.2 ± 7.2a | 114.7 ± 5.4a | 109.0 ± 5.1ab | 92.1 ± 4.6bc | 84.1 ± 4.3c |
|
|||||
| Tissue weight (g per 100 g body weight) | |||||
| Liver | 3.55 ± 0.21a | 3.26 ± 0.14a | 3.21 ± 0.11a | 3.18 ± 0.11a | 3.64 ± 0.18a |
| Cecum | 0.50 ± 0.03b | 0.51 ± 0.03b | 0.54 ± 0.07b | 0.71 ± 0.06b | 1.32 ± 0.11a |
| Colon crypt depth (μm) | 218.9 ± 6.0b | 228.0 ± 3.5b | 251.9 ± 4.9a | 255.6 ± 5.5a | 275.3 ± 7.0a |
| Goblet cells per crypt | 31.79 ± 0.89c | 34.83 ± 0.79bc | 35.96 ± 1.05b | 42.50 ± 0.88a | 42.76 ± 1.29a |
|
|||||
| Lipid profiles (mmol L−1) | |||||
| TC | 1.96 ± 0.18a | 2.08 ± 0.24a | 1.74 ± 0.19a | 1.51 ± 0.12a | 1.62 ± 0.08a |
| TG | 0.26 ± 0.02a | 0.15 ± 0.04abc | 0.24 ± 0.05a | 0.067 ± 0.007bc | 0.062 ± 0.012c |
| HDL | 1.28 ± 0.08a | 1.39 ± 0.13a | 1.23 ± 0.13a | 1.13 ± 0.08a | 1.21 ± 0.06a |
| LDL | 0.54 ± 0.03a | 0.43 ± 0.06ab | 0.32 ± 0.13bc | 0.22 ± 0.04c | 0.24 ± 0.05c |
|
|||||
| Gut hormones | |||||
| PYY1 | 40.65 ± 6.36b | 69.09 ± 3.91a | 66.92 ± 4.72a | 70.36 ± 3.51a | 70.89 ± 3.44a |
| GLP-12 | 4.37 ± 0.37a | 4.45 ± 0.62a | 4.85 ± 0.33a | 6.32 ± 0.12a | 6.57 ± 0.78a |
The average liver weight of rats was similar amongst all dietary groups (3.2 to 3.6 g per 100 g body weight). Compared with the CO group, potato consumption increased the weight of full cecum with contents in a dose-dependent pattern, higher consumption (PHer) significantly increased the full cecum weight by 164% (P = 0.000), nevertheless no significant differences were detected among other three potato-enriched groups.
A strong negative correlation was discovered between BWG and full cecum weight (r = −0.630, P < 0.01) (see Table S1†). On the other hand, no relevance existed between relative weight of liver and other variables (BWG, colonic SCFAs, lipid profiles, and satiety-related hormones) except for a moderate correlation with relative cecum weight (r = 0.389, P = 0.028).
Effects of potato intake on lipid profiles and satiety-related gut hormones
The impact of potato intake on serum lipid metabolism (TC, TG, HDL, and LDL) and satiety-related gut hormones (PYY and GLP-1) was investigated in the present work (Table 3). Notwithstanding these remarkable decreases in BWG of rats after PH and PHer intervention, levels of TC and HDL in serum showed a lower tendency but no significant differences between the two dietary groups and CO group (P > 0.05). But other lipid profiles variation observed in PH- and PHer-fed rats included the significant reduction in TG and LDL compared with those in CO-fed diet for 7 weeks (P < 0.01). Interestingly, following 7 weeks of feeding different diets, LDL level in PM-fed rats was also significantly decreased by 41% (P = 0.004 versus CO). In comparison with CO group, approximately 1.7-fold significant elevation was found in PYY concentration of rats fed with four potato-enriched diets after 7 weeks of dietary intervention (P < 0.01), however the differences between PL, PM, PH, and PHer groups did not achieve statistical significance. In addition, GLP-1 concentration in all dietary groups displayed a smaller non-significant increment. The uppermost GLP-1 concentration (6.57 s 0.78 ng mL−1) was obtained in PHer-fed rats in relation to CO (Bonferroni's test, P = 0.088).As described in Table S1,† the lipid profiles (TC, TG, HDL, and LDL) were all correlated positively with BWG (r = 0.613, 0.674, 0.501, and 0.622, respectively; P < 0.01). Levels of satiety-related gut hormone GLP-1 revealed strong negative correlation with BWG, TG, and LDL (r = −0.583, −0.638, and −0.472, respectively, P < 0.01) and strong positive correlation with cecum weight (r = 0.621, P < 0.01). But with regard to the other gut hormone PYY, only negative relationships with BWG, TG, and LDL were observed, respectively (r = −0.463, −0.497, and −0.635, respectively; P < 0.01).
Effects of potato intake on crypt depth and goblet cells
In our study, the histology of the intestinal crypts from a slice of the distal colon was investigated and exhibited in Fig. 1.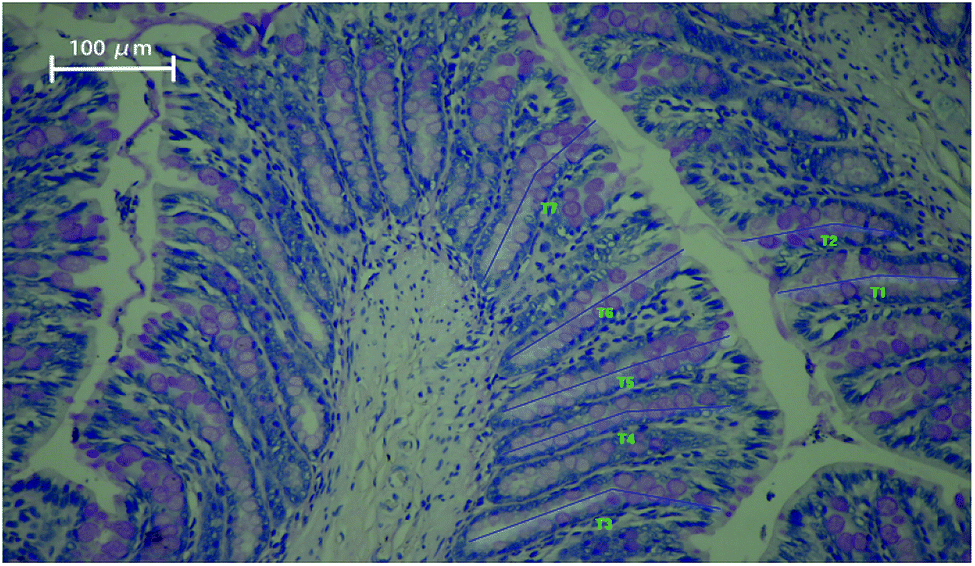 | ||
| Fig. 1 Periodic acid–Schiff staining of distal colon tissue showing intact crypts with goblet cells. The blue lines (T1–T7) represent the length of crypt depth. Magnification: ×200. | ||
The average colon crypt depth and goblet cells numbers were considerably influenced by the dietary treatment in ascending order of magnitude: CO < PL < PM < PH < PHer (P < 0.001). Supplementation with PM, PH, and PHer thickened the crypts in SD rats by 15, 17, and 26%, respectively, comparing those fed with CO diet (P = 0.000). No significant variation between the above-mentioned three potato diets was observed. The numbers of goblet cells per crypt also revealed similar results. SD rats fed with the PHer diet possessed the maximum goblet cells of 42.76 ± 1.29.
Effects of potato intake on colonic SCFAs
Overall, compared with CO group, the ingestion of potatoes led to a considerable dose-dependent elevation in the production of SCFAs in the distal colon with the exception of PL-fed rats (P < 0.001; Table 4). It is as expected that acetate was the dominant SCFAs in colon feces. Highest outputs of SCFAs were all detected in PHer-fed rats at the concentration of 72.62, 17.95, 12.60, 1.56, 1.66, and 1.96 μmol per g DW, respectively. Moreover, the rats fed with PHer diet generated a higher proportion of butyrate in colonic contents than those fed the CO group (11.6% vs. 5.3%). However, regarding the concentrations of total SCFAs, total BCFAs, acetate, valerate, and iso-valerate, PHer dietary treatment did not differ from PH (P > 0.05).| Group | CO | PL | PM | PH | PHer |
|---|---|---|---|---|---|
| a CO: rats fed with an AIN-93 G diet; PL–PHer: rats separately fed with a low, medium, high or higher concentration of potato diet.b SCFAs: short chain fatty acids; BCFAs: branched-chain fatty acids. Data are shown as mean ± SEM. Means with different letters (a, b, c and d) within columns indicate significant differences (Bonferroni's test, P < 0.05), where a > b > c > d. * μmol per g of dry weight. | |||||
| Total SCFAs* | 34.37 ± 1.87d | 47.57 ± 1.18c | 72.27 ± 4.29b | 112.8 ± 0.5a | 108.4 ± 3.1a |
| Acetate | 25.61 ± 1.46c | 34.70 ± 1.14c | 56.08 ± 3.82b | 85.43 ± 0.38a | 72.62 ± 1.60a |
| Propionate | 4.89 ± 0.35d | 7.11 ± 0.02cd | 10.06 ± 0.49bc | 13.02 ± 0.06b | 17.95 ± 1.52a |
| Butyrate | 1.83 ± 0.17c | 2.05 ± 0.02c | 2.04 ± 0.06c | 8.43 ± 0.03b | 12.60 ± 1.49a |
| Total BCFAs | 2.04 ± 0.06c | 3.72 ± 0.04b | 4.09 ± 0.04b | 5.90 ± 0.02a | 5.18 ± 0.36a |
| Iso-butyrate | 0.95 ± 0.04c | 1.38 ± 0.02b | 1.66 ± 0.05ab | 1.98 ± 0.00a | 1.56 ± 0.11b |
| Valerate | 0.33 ± 0.03c | 0.80 ± 0.03b | 0.66 ± 0.07b | 1.67 ± 0.02a | 1.66 ± 0.13a |
| Iso-valerate | 0.76 ± 0.03d | 1.54 ± 0.01c | 1.78 ± 0.05bc | 2.25 ± 0.00a | 1.96 ± 0.12ab |
Whether the sum or individual concentration of colonic SCFAs has shown strong negative interrelationship with BWG, TG, and LDL (r = −0.542 to −0.780, P < 0.01) and strong positive interrelationship with plasma GLP-1 (r = 0.652–0.771, P = 0.000) (shown in Table S1†). A strong positive correlation was explored between cecum weight and concentrations of total SCFAs, propionate, and butyrate with r values of 0.598, 0.745, and 0.807, respectively (P = 0.000), while with regard to the total BCFAs and acetate, only a moderate correlation with cecum weight was determined with r values of 0.490 and 0.473, respectively. Total SCFAs, acetate, propionate, and BCFAs concentrations were inversely proportional to TC level in serum (r = −0.463, −0.475, −0.407, and −0.372, respectively; P < 0.05), whereas in direct proportion to PYY (r = 0.493, 0.504, 0.464, and 0.611, respectively; P < 0.01). Additionally, no link was observed between any of the SCFAs with serum HDL.
According to Pearson correlation analysis, BWG was highly associated with other 13 environmental variables including food intake, cecum weight, lipid profiles (TC, TG, HDL, and LDL), satiety-related hormones (PYY and GLP-1), and colonic SCFAs (total SCFAs, acetate, propionate, butyrate, and total BCFAs). Therefore, the 13 variables and BWG were defined as the independent variables and dependent variable via a further multiple stepwise regression analysis to determine the relative importance of each variable in BWG (Table S2†). Of all influential factors on BWG, butyrate displayed a considerate independent relevance in model 1 and accounted for 52.4% of the variation (P = 0.000). With a view to combined effects, butyrate and TC were incorporated into model 2 with Radj2 of 0.666 (P < 0.01). Hence, model 2 was ultimately adopted for predicting the impacts of involved parameters on BWG.
Effects of potato intake on gut microbiota
According to the PCoA, an apparent separation of microbial communities structures between rats fed the potato-enriched diets or CO diet was illustrated (unweighted UniFrac distances; Fig. 2A), demonstrating that potato intake has an important influence over the gut microbiota. As shown in Fig. 2A, the potato-fed rats assembled a distinct cluster from the control rats, with PC1 accounting for 26.98% and PC2 occupying 7.37% of the total variance. The sequence data of rats in CO group were concentrated upon the lower-right quadrant, while the data began to shift left and finally fell into the left quadrant along with the potato supplementation. Besides, amongst the four potato-enriched groups, PHer displayed a distinction from PL and PM, but partially overlapped with PH.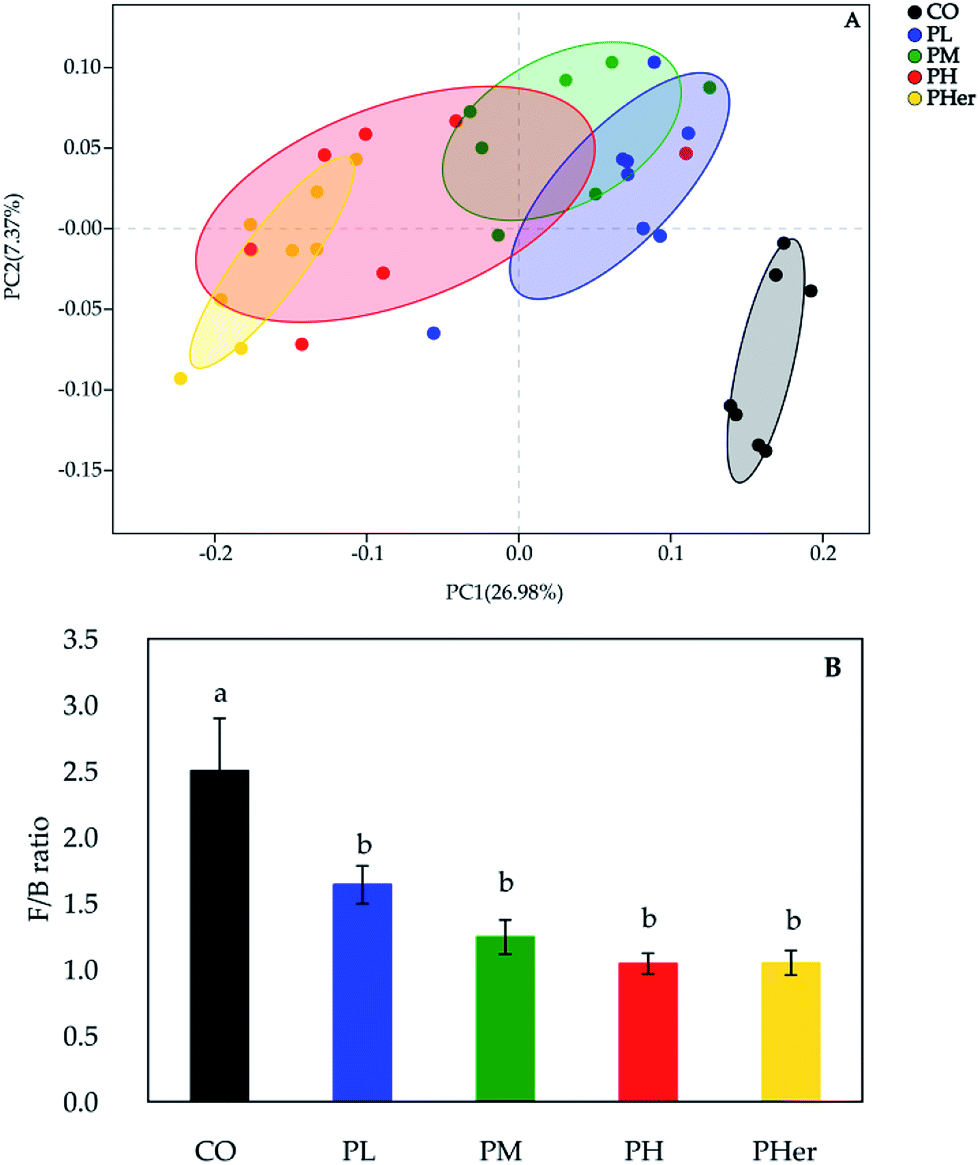 | ||
| Fig. 2 Potato intake modulated the structures of the gut microbiota. (A) Principal co-ordinate analysis (PCoA) based on unweighted UniFrac distances of microbial 16S rRNA sequences from the V3–V4 region in distal colon contents at week 7; (B) the Firmicutes/Bacteroidetes (F/B) ratio in rats after fed different diets for 7 weeks. | ||
The phyla Firmicutes, Bacteroidetes, and Actinobacteria dominated the gut microbiota and accounted for over 90% of the microbial populations in all dietary groups (Fig. 3A and Table S3†). Potato intervention caused a significant dose-dependent increment in the relative abundance of Bacteroidetes and Actinobacteria (P < 0.05). Furthermore, the relative abundance of Actinobacteria presented a sharp increase of 5.4–24.9 fold by the intake of potatoes as compared to CO group. In contrast, potato consumption resulted in a remarkable reduction in Firmicutes abundance (P = 0.005). Accordingly, the supplementation of potato decreased the ratios of Firmicutes to Bacteroidetes gradually from 2.50 to 1.04 (Bonferroni's test, P < 0.05; Fig. 2B). Nonetheless, no notable variation was recognized among the potato diets.
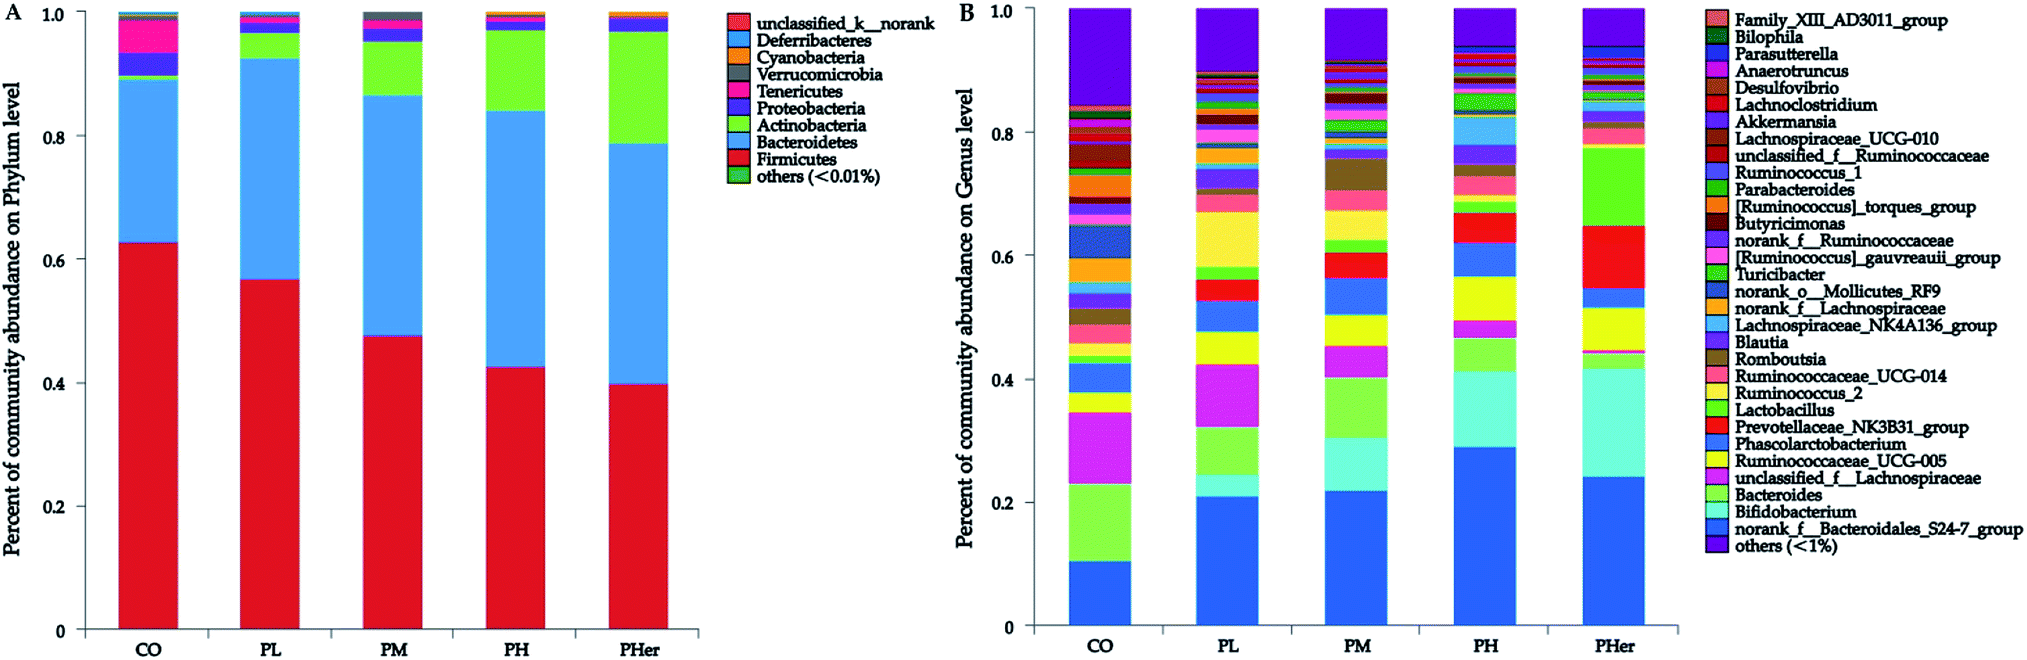 | ||
| Fig. 3 Fecal microbiota composition of Sprague-Dawley rats after 7 weeks on a control diet (CO), low (PL), medium (PM), high (PH) and higher concentration of potato group (PHer). (A) Phylum level; (B) genus level. | ||
At genus level, over 99% of the colonic microbial community was consisted of 31 genera with a relative abundance of >1% in four potato-enriched groups (Fig. 3B and Table S4†). But this was not the case in control group, of which 31 genera comprised only 84.4% of the microbiota. In PM and PH groups, the top five abundant genera were norank_f__Bacteroidales_S24-7_group (order Bacteroidales), Bacteroides, Bifidobacterium, Phascolarctobacterium, and Ruminococcaceae_UCG-005, which dominated more than half the bacteria. But in other three dietary groups they were not quite the same. Among the top five abundant genera, three ones (“S24-7”, unclassified_f__Lachnospiraceae, and Bacteroides) were detected in both group 1 and 2 (i.e. CO and PL), and yet Lactobacillus (12.4%) and Prevotellaceae_NK3B31_group (10.3%) were found typical in PHer diet. Then pairwise comparison was further executed between CO, PH, and PHer groups by Mann–Whitney U test. When compared to CO group, both high and higher ingestion of potato stimulated “S24-7”, Bifidobacterium, “NK3B31”, Parasutterella, and Ruminococcus_1 (Fig. 4). However, statistical significances were not observed between PH and PHer groups in above four genera except for Parasutterella. According to LEfSe, Turicibacter (in the family Erysipelotrichaceae) was enriched in PH group (LDA = 4.16), and higher intake of potato stimulated Lactobacillus and Oxalobacter (LDA = 4.70 and 3.62) in relative to CO group. Actually, the relative abundance of Oxalobacter was extraordinarily low in PHer group (0.0042%) and the non-significant decline of Turicibacter was also observed in PHer group (Fig. S1D†).
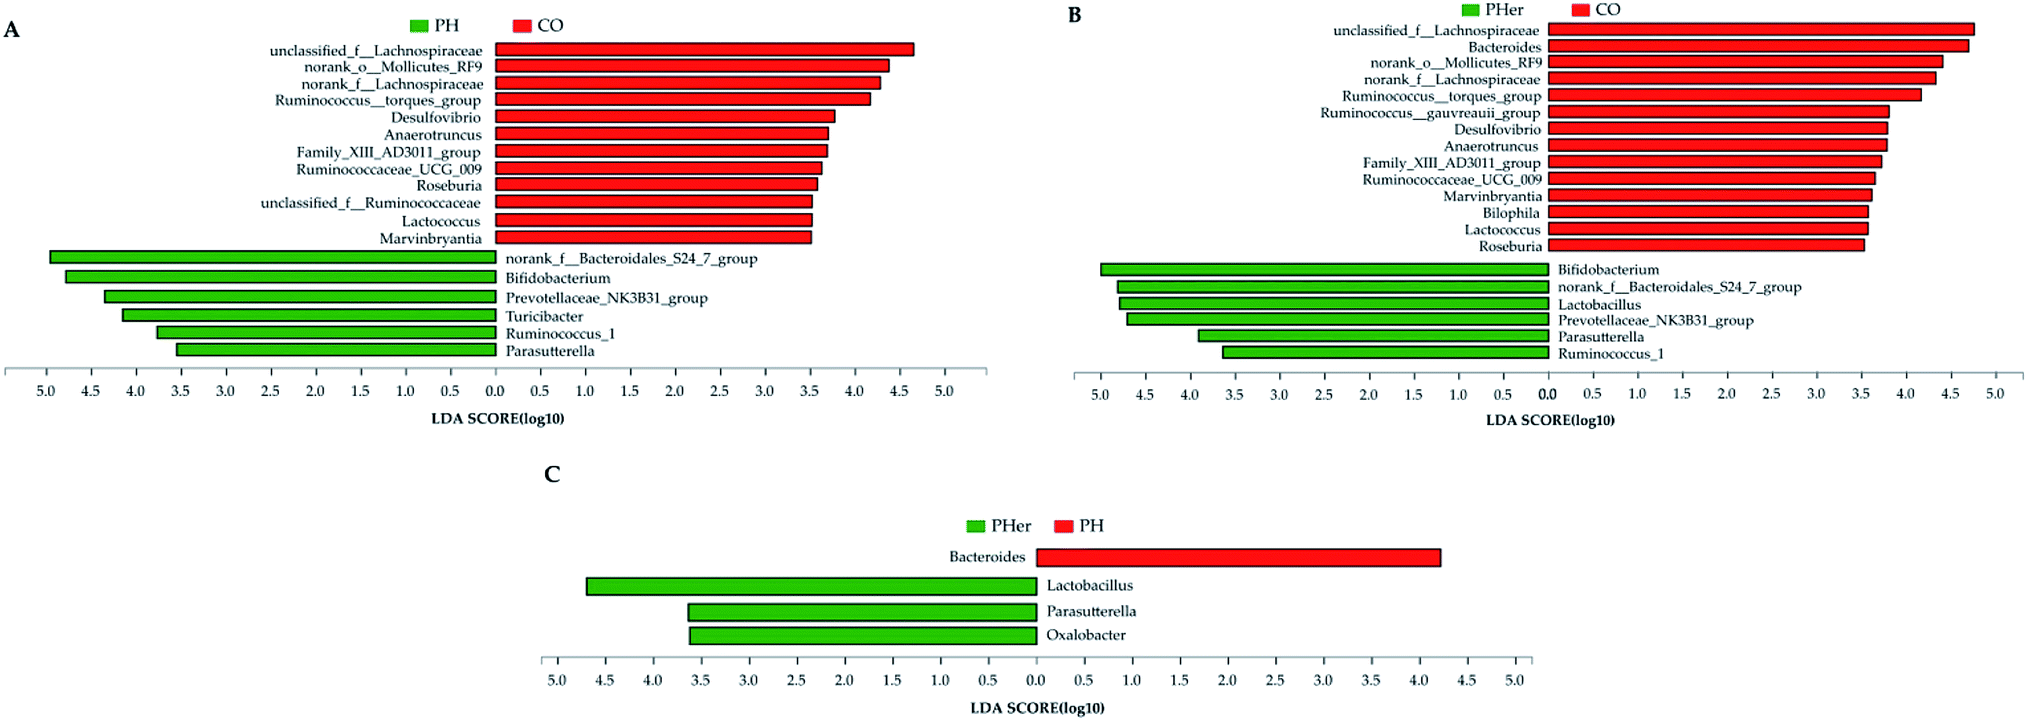 | ||
| Fig. 4 Linear discriminant analysis (LDA) scores for differentially abundant genera between rats fed with different diets: CO vs. PH (A); CO vs. PHer (B); PH vs. PHer (C). LDA effect size (3.5-fold) was set as the threshold to determine the significance. CO: rats fed with an AIN-93 G diet; PH: rats fed with a high concentration of potato diet; PHer: rats fed with a higher concentration of potato diet. | ||
Correlation between gut microbiota composition and host biochemical parameters
The 12 host biological variables including SCFAs, acetate, propionate, butyrate, BCFAs, TC, TG, HDL, LDL, PYY, GLP-1, and BWG were chosen in the partial Mantel test for assessing the vital host biochemical characteristics affecting the gut bacterial community composition. The results revealed that propionate (r = 0.502, P = 0.001), total SCFAs (r = 0.470, P = 0.001), butyrate (r = 0.394, P = 0.001), and acetate (r = 0.344, P = 0.001) were the determinant attributes to shaping microbiota structure (Table 5), while BCFAs caused a significant weak correlation (r = 0.296, P = 0.001).| Environmental characteristics | Mantel r | P-value |
|---|---|---|
| a The 12 environmental variables that used for redundancy analysis (RDA) model were selected here. The correlation (r) and significance (P) were determined based on 999 permutations between community structure (Bray–Curtis distance) and environmental variables (Euclidean distance). SCFAs: short chain fatty acids; BCFAs: branched-chain fatty acids; TC: total cholesterol; TG: triglyceride; HDL: high-density lipoproteins; LDL: low-density lipoproteins; BWG: body weight gain. **P < 0.01. *P < 0.05. | ||
| SCFAs | 0.470 | 0.001** |
| Acetate | 0.344 | 0.001** |
| Propionate | 0.502 | 0.001** |
| Butyrate | 0.394 | 0.001** |
| BCFAs | 0.296 | 0.001** |
| TC | −0.086 | 0.880 |
| TG | −0.016 | 0.544 |
| HDL | −0.047 | 0.704 |
| LDL | 0.072 | 0.170 |
| PYY | 0.078 | 0.141 |
| GLP-1 | 0.131 | 0.031* |
| BWG | 0.009 | 0.430 |
Spearman's analysis was simultaneously implemented between the top 50 genera and the above-mentioned 12 host biochemical variables (Fig. 5). On the whole, 39 genera have considerable relations with at least one environmental parameter. Parasutterella (in the family Alcaligenaceae), “NK3B31” (in the family Prevotellaceae), “UCG-005” (in the family Ruminococcaceae), and “S24-7” were all correlated positively with both the sum and individual colonic SCFAs after potato intervention. On the contrary, 16 genera were correlated negatively with colonic SCFAs. Additionally, a strong positive correlation was explored between butyrate and Parasutterella (R-value = 0.669) and four other genera (“NK3B31”, “UCG-005”, “S24-7”, and Lactobacillus) have moderate positive correlations with butyrate (R-value = 0.443, 0.377, 0.375, and 0.368, respectively). Of note, “S24-7” was the unique genus in top 50 negatively correlated with TC (R-value = −0.388, P < 0.05). As stated above, butyrate and TC were the major determinants of BWG. Thus Parasutterella and “S24-7” can be regarded as the microbial biomarkers of BWG. Actually Parasutterella was inversely proportional to BWG (R-value = −0.633, P < 0.001), but “S24-7” was not. Moreover, Parasutterella has shown a strong positive interrelationship with GLP-1 and strong negative interrelationship with TG and LDL (R-value = 0.560, −0.594, and −0.618, respectively; P < 0.01).
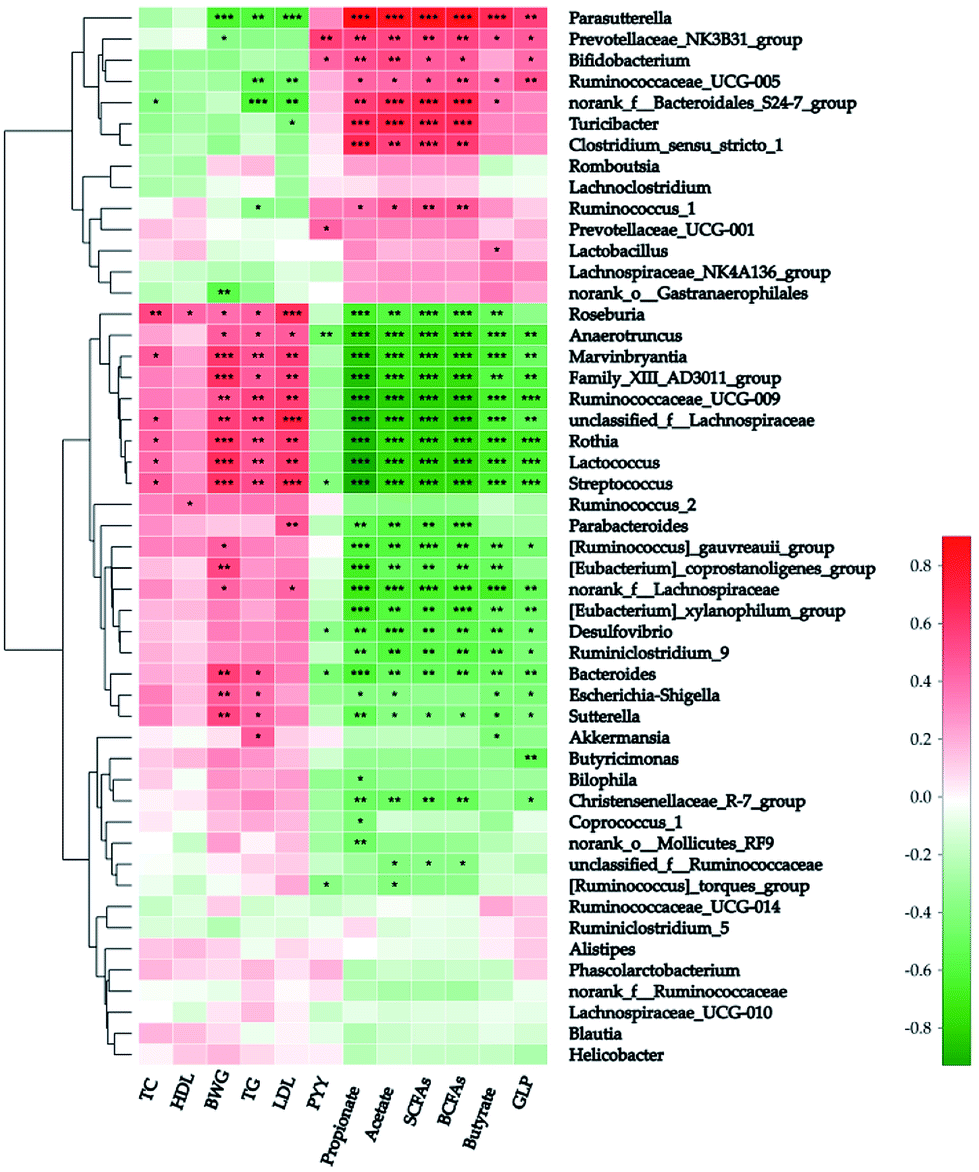 | ||
| Fig. 5 Correlation analysis between fecal microbiota and host biochemical characteristics at genus level. The red-white-green color in the right histogram stands for R-value of Spearman's correlation between the genus and host biological characteristics. SCFAs: short chain fatty acids; BCFAs: branched-chain fatty acids; HDL: high-density lipoproteins; LDL: low-density lipoproteins; TG: triglyceride; BWG: body weight gain. ***P < 0.001; **P < 0.01; *P < 0.05. | ||
Discussion
Our present work evaluated the effects of consuming different concentrations of potatoes on the growth parameters, energy intake, lipid profiles, anorectic hormones, SCFA composition, and the structure of fecal microbiota of healthy rats based on the realistic recommended consumption for Chinese residents. We found that dietary potato can significantly decrease the energy intake and BWG of PH and/or PHer-fed rats by stimulating the secretion of satiety-related gut peptides PYY and modulation of colonic microecology. Besides, the lipid metabolism was improved by intake of potatoes especially for lowering TG and LDL. It was consequently speculated that potato powder might act as a prebiotics used for weight management. Previous research has obtained similar results in cholesterol-fed rats, colored potato flakes-fed rats, raw potato starch-fed pigs, and healthy young adults with raw unmodified potato starch (resistant starch type 2) supplementation.23,25,29,40The mechanisms underlying the gut-microbiota-targeted regulation of potatoes are the combination of diverse factors due to their complex nutritional composition. Potato powder from the variety Zhongshu No. 18 used in the present study contained 10.86% protein, 1.06% soluble dietary fiber (SDF), 6.94% insoluble dietary fiber (IDF), 63.09% resistant starch, and 89.88 mg/100 g chlorogenic acid (Table 2). The potato dietary fiber was consisted of cellulose, pectin, xyloglucans, heteromannans, and heteroxylans.2 Insoluble dietary fiber can be used for preventing constipation due to its hygroscopicity, which stimulated the gut peristalsis, stool bulking and discharge.41 In our study, the dose-dependent enlargement of the full cecum size caused by dietary potato has demonstrated this. In addition, the fermentation of potato SDF and RSII in the colon generated a substantial amount of SCFAs, which were conducive to the increment in circulating anorexic hormones concentration and the reduction in energy intake. SCFAs, especially acetate, propionate, and butyrate triggered the secretion of these gut hormones by activating the free fatty acid receptor 2 and 3 (FFAR2 and FFAR3) via gut-brain neural circuit, and thereby suppressed the appetite.42,43 However, in the current study, potato intervention only significantly affected PYY levels, rather than total GLP-1 in the fasting rats, which was in agreement with earlier reports.39,44 It was hypothesized that long term intake of fermentable DF can elevate the fasting (background) PYY level via perpetual L cell stimulation and maintain the circulating PYY at an elevated level.39 This may be explained by the different phases where the stimulation of PYY and GLP-1 occurred.45 The dynamics of plasmatic PYY release was analogous to the growth kinetics of nutrients-induced intestinal bacteria. PYY (Stat) was stimulated during the bacterial stationary growth phase (Stat) and remained elevated even after overnight fasts, while GLP-1 (Exp) was activated during the prandial phase, i.e. exponential growth phase (Exp) and reached the lowest level after overnight fasts.45,46 Thus, PYY (Stat) and GLP-1 (Exp) acted as a satiety signaling to the host. As the main constituent of the potato protein, potato proteinase inhibitors may also cause a satiety response by releasing the hunger suppressant cholecystokinin (CCK) and finally exhibited an anti-obesity effect.33
Our data indicated that ingestion of potato powder with high concentration (≥27.5%) is perceived as a reliable candidate for lipid metabolism regulation. The serum TG and LDL were decreased by 75% and 57% but the serum cholesterol was not affected, which is in line with the results of an earlier work.39 Unlike potato RSIII (retrograded starch), RSII (i.e. raw potato starch) in our potato powder did not show bile acids binding ability.31 The excretion of bile acids into the feces favors the inhibition of cholesterol reabsorption and hence contributes to lowering cholesterol.29,47 The reduction in TG levels by high RS diets is due to the suppression of expression of genes involved in fatty acid synthesis.31,48 Interestingly, PHer diet presented a preferable regulatory effect of lipid metabolism due to the different composition of diets. Compared to AIN-93 G and other potato-enriched diets, PHer diet did not contain sucrose, which was found to have a positive correlation with obesity and other metabolic syndrome.49
Earlier studies have summarized some possible pathways through which SCFAs circulation exerted a beneficial impact on host.20 SCFAs, especially butyrate and propionate can promote the intestinal barrier function by inhibiting cell proliferation and inducing immune cell differentiation due to their histone deacetylase (HDAC)-inhibiting ability.50 Additionally, SCFAs can mediate intestinal gluconeogenesis (IGN) and lipid biosynthesis in the peroxisome proliferator-activated receptor gamma (PPARγ), AMPK or MAPK signaling pathways as important regulatory molecules.51 On the one hand, acetate itself may exert its anorectic benefits via hypothalamic neuronal activation and upregulate the expression of another anorexigenic hormone leptin together with propionate.42 On the other hand, as a precursor of acetyl Co-A, acetate is served as an energy supply for gut bacteria and a substrate of the cholesterol synthesis.52 The increased level of acetate in our study might therefore be undesirable. Nevertheless, as IGN substrate, propionate itself can act as a potent inhibitor of acetate conversion into cholesterol.52 Besides, IGN, which might improve metabolic benefits and regulate energy homeostasis, can also be stimulated directly by butyrate activating the expression of genes in enterocytes.42 On the whole, plenty of propionate and butyrate production in the present study could counteract the consequences of increment in acetate.
SCFAs are common end products of carbohydrate anaerobic fermentation by microbes in the distal colon. There are numerous specific colonic bacteria involved in the production of acetate, propionate, and butyrate via different pathways including acetyl–CoA pathway and the Wood–Ljungdahl pathway for producing acetate by Akkermansia, Bacteroides, Bifidobacterium, Prevotella, Ruminococcus, Blautia, Clostridium, and Streptococcus.53 Propionate is formed or converted in three pathways such as the succinate pathway by Negativicutes (Veillonellaceae), the acrylate pathway by Veillonellaceae and Lachnospiraceae, as well as the propanodiol pathway by the Lachnospiraceae family.54 Butyrate is produced by some butyrate-producing bacteria including Eubacterium, Roseburia, and Faecalibacterium belonging to Clostridium cluster XIVa and Clostridium cluster IV via the butyrate kinase pathway and the butyryl–CoA: acetate CoA-transferase pathway.55
The mechanisms underlying the two-way interaction between phenolic compound and microbiota are still unclear. The phenolic compound-microbiota-host triangle interaction effects may be the result of the transformation of phenolic compounds into highly bioavailable small-size metabolites by colonic microbiota.20 For example, 3-(3,4-dihydroxyphenyl)-propionic acid, metabolite of chlorogenic acid and caffeic acid was produced by Clostridium, Eubacterium, Bifidobacterium, Lactobacillus.20,21 Then the phenolic derivatives exert antioxidant or antiobesity effects via up-regulation of cellular antioxidant enzymes or down-regulation of uncoupled protein 3 and p38 signal pathways.56
Dietary potatoes also altered the intestinal microbiota structure of the host by reducing the F/B ratios (an obesity biomarker) and increasing Actinobacteria.57 As expected, the enrichment of Bifidobacterium and Ruminococcus, the RS-degrading bacteria, was observed in PH and PHer-fed rats. Similarly, previous studies have detected the proliferation of the two beneficial bacteria in the feces of pigs or human.18,23,25 In addition, Parasutterella, as a subclass of Proteobacteria, was enriched in PH and PHer groups (Fig. 4). It was reported that Parasutterella has a positive interrelationship with nicotinic acid (vitamin B3), which could repress the mobilization of adipose tissue and then regulate lipid metabolism.58 Particularly, Parasutterella has recently been documented to yield the IGN activator, namely succinate, as the fermentation end-product.59,60 Likewise, the beneficial bacterium was also identified in growing pigs with resistant starch (RSIV) supplementation.61 Lactobacillus, enriched in PHer group, was also positively correlated with the above-mentioned vitamin B3. A high-fat diet induced down-regulation in Parasutterella and Lactobacillus might be restored by administration of sodium butyrate.62 On the other hand, Parasutterella has also been demonstrated positively related to sugar consumption and the suppression of energy supply by disturbing propionate and butyrate synthesis.63 As a consequence, Parasutterella was inversely proportional to BWG, TG, and LDL and might be considered as the microbial biomarkers of BWG.
Based on the normalization of 16S rRNA gene sequences, Phylogenetic Investigation of Communities by Reconstruction of Unobserved States (PICRUSt) analysis was used for predicting potential metabolic function of the colonic microbiome.64 The results also signified that adipocytokine signaling pathway and fatty acid degradation were strengthened in PHer group (LDA ≥ 2.0, data not shown), similar to those reported in high resistant starch-fed pigs.23
There still existed some limitations of the present study. One limitation is that further trials are required to verify the findings to human volunteers. Another limitation of this study is that potatoes may not be the normal food for rats. The period of the rats acclimatized to the potato-enriched diets should be prolonged.
Conclusions
In conclusion, diets supplementation of potato powders reduced the Firmicutes/Bacteroidetes ratio, enriched beneficial bacteria like “S24-7”, Bifidobacterium, Parasutterella, Ruminococcus_1, Turicibacter, increased the SCFA concentration in distal colon, and stimulated the secretion of satiety-related hormone PYY, which could induce a decreased body weight gain in rats. These results could indicate that potato powder might exhibit the potential for promising effects on weight management. Additionally, the enrichment of Parasutterella can be regarded as a health index of gut microbiota and the microbial biomarker of body weight gain.Funding
This research was funded by the Special Fund for Agro-scientific Research in the Public Interest of China, grant number 201503001-2, Beijing Municipal Science and Technology Project, grant number D17110500190000, and China Agriculture Research System, grant number CARS-09.Authors' contributions
WY, CHL, and ZH conceived and designed the study; WY and CHL performed the rat experiments; HHH contributed to the analysis of microbiota data; DXF contributed to the discussion of the data; WY and ZH wrote the manuscript. All authors read and approved the final manuscript.Conflicts of interest
There are no conflicts of interest to declare.Acknowledgements
The authors would like to thank Dr Zhang Nana for her advice on the experimental design and data analysis. Potato tubers of Zhongshu No. 18 were provided by Hongbo Agriculture Development LLC in Dingbian (Shaanxi, China).References
- R. Ezekiel, N. Singh, S. Sharma and A. Kaur, Food Res. Int., 2013, 50, 487–496 CrossRef CAS.
- L. Kaur and J. Singh, Advances in Potato Chemistry and Technology, Academic Press, London, 1st edn, 2009 Search PubMed.
- D. F. Birt, T. Boylston, S. Hendrich, J.-L. Jane, J. Hollis, L. Li, J. McClelland, S. Moore, G. J. Phillips, M. Rowling, K. Schalinske, M. P. Scott and E. M. Whitley, Adv. Nutr., 2013, 4, 587–601 CrossRef CAS.
- FAOSTAT, http://faostat.fao.org, accessed 20th March, 2019.
- H. Zhang, F. Xu, Y. Wu, H.-h. Hu and X.-f. Dai, J. Integr. Agric., 2017, 16, 2924–2932 CrossRef.
- J. C. King and J. L. Slavin, Adv. Nutr., 2013, 4, 393S–401S CrossRef CAS.
- B. Burlingame, B. Mouillé and R. Charrondière, J. Food Compos. Anal., 2009, 22, 494–502 CrossRef CAS.
- S. A. French, R. W. Jeffery, J. L. Forster, P. G. McGovern, S. H. Kelder and J. E. Baxter, Int. J. Obes. Relat. Metab. Disord., 1994, 18, 145–154 CAS.
- J. A. Linde, J. Utter, R. W. Jeffery, N. E. Sherwood, N. P. Pronk and R. G. Boyle, Int. J. Behav. Nutr. Phys. Act., 2006, 26, 42 CrossRef.
- O. Receveur, K. Morou, K. Gray-Donald and A. C. Macaulay, J. Am. Diet. Assoc., 2008, 108, 362–366 CrossRef.
- A. M. Paradis, G. Godin, L. Perusse and M. C. Vohl, Int. J. Obes., 2009, 33, 1419–1426 CrossRef PubMed.
- M. E. Camire, S. Kubow and D. J. Donnelly, Crit. Rev. Food Sci. Nutr., 2009, 49, 823–840 CrossRef CAS.
- D. Mozaffarian, T. Hao, E. B. Rimm, W. C. Willett and F. B. Hu, N. Engl. J. Med., 2011, 364, 2392–2404 CrossRef CAS.
- J. Halkjaer, A. Tjonneland, K. Overvad and T. I. Sorensen, J. Am. Diet. Assoc., 2009, 109, 1356–1366 CrossRef.
- H. Du, D. L. van der A, H. C. Boshuizen, N. G. Forouhi, N. J. Wareham, J. Halkjær, A. Tjønneland, K. Overvad, M. U. Jakobsen, H. Boeing, B. Buijsse, G. Masala, D. Palli, T. I. A. Sørensen, W. H. M. Saris and E. J. M. Feskens, Am. J. Clin. Nutr., 2010, 91, 329–336 CrossRef CAS.
- V. Charepalli, L. Reddivari, S. Radhakrishnan, R. Vadde, R. Agarwal and J. K. Vanamala, J. Nutr. Biochem., 2015, 26, 1641–1649 CrossRef CAS.
- S. Bibi, D. A. Navarre, X. Sun, M. Du, B. Rasco and M.-J. Zhu, Am. J. Potato Res., 2019, 96, 170–176 CrossRef.
- Y. Sun, L. Zhou, L. Fang, Y. Su and W. Zhu, Front. Microbiol., 2015, 6, 877 Search PubMed.
- A. Tresserra-Rimbau, R. M. Lamuela-Raventos and J. J. Moreno, Biochem. Pharmacol., 2018, 156, 186–195 CrossRef CAS.
- L. Gong, W. Cao, H. Chi, J. Wang, H. Zhang, J. Liu and B. Sun, Food Res. Int., 2018, 103, 84–102 CrossRef CAS.
- F. Cardona, C. Andres-Lacueva, S. Tulipani, F. J. Tinahones and M. I. Queipo-Ortuno, J. Nutr. Biochem., 2013, 24, 1415–1422 CrossRef CAS.
- G. Paturi, T. Nyanhanda, C. A. Butts, T. D. Herath, J. A. Monro and J. Ansell, J. Food Sci., 2012, 77, H216–H223 CrossRef CAS.
- Y. Sun, Y. Su and W. Zhu, Front. Microbiol., 2016, 7, 779 Search PubMed.
- M. R. Panasevich, K. R. Kerr, R. N. Dilger, G. C. Fahey, L. Guérin-Deremaux, G. L. Lynch, D. Wils, J. S. Suchodolski, J. M. Steer, S. E. Dowd and K. S. Swanson, Br. J. Nutr., 2014, 113, 125–133 CrossRef.
- A. Venkataraman, J. R. Sieber, A. W. Schmidt, C. Waldron, K. R. Theis and T. M. Schmidt, Microbiome, 2016, 4, 33 CrossRef CAS.
- M. Bluher, Nat. Rev. Endocrinol., 2019, 15, 288–298 CrossRef PubMed.
- S. B. Heymsfield, D. L. Longo and T. A. Wadden, N. Engl. J. Med., 2017, 376, 254–266 CrossRef CAS.
- C. Torres-Fuentes, H. Schellekens, T. G. Dinan and J. F. Cryan, Lancet Gastroenterol. Hepatol., 2017, 2, 747–756 CrossRef.
- L. Robert, A. Narcy, E. Rock, C. Demigne, A. Mazur and C. Rémésy, Eur. J. Nutr., 2006, 45, 267–274 CrossRef CAS.
- L. Robert, A. Narcy, Y. Rayssiguier, A. Mazur and C. Rémésy, J. Am. Coll. Nutr., 2008, 27, 109–116 CrossRef CAS.
- E. A. de Deckere, W. J. Kloots and J. M. M. van Amelsvoort, Br. J. Nutr., 1995, 73, 287–298 CrossRef CAS.
- E. S. Lee, H. Shin, J. M. Seo, Y. D. Nam, B. H. Lee and D. H. Seo, Food Chem., 2018, 256, 367–372 CrossRef CAS.
- S. K. Ku, S. H. Sung, J. J. Choung, J.-S. Choi, Y. K. Shin and J. W. Kim, Exp. Ther. Med., 2016, 12, 354–364 CrossRef CAS.
- AOAC, Official methods of analysis of AOAC International, AOAC International, Gaithersburg, MD, USA, 17th edn, 2000 Search PubMed.
- Z. Fang, M. Zhang, Y. Sun and J. Sun, J. Agric. Food Chem., 2006, 54, 99–106 CrossRef CAS.
- Chinese Nutrition Society, Chinese Dietary reference intakes (2013), Science Press, Beijing, China, 2013 Search PubMed.
- Guidance for Industry Estimating the Maximum Safe Starting Dose in Initial Clinical Trials for Therapeutics in Adult Healthy Volunteers, https://www.fda.gov/downloads/Drugs/GuidanceComplianceRegulatoryInformation/Guidances/UCM078932.pdf, accessed 10 April, 2019 Search PubMed.
- A. Trompette, E. S. Gollwitzer, K. Yadava, A. K. Sichelstiel, N. Sprenger, C. Ngom-Bru, C. Blanchard, T. Junt, L. P. Nicod, N. L. Harris and B. J. Marsland, Nat. Med., 2014, 20, 159–166 CrossRef CAS.
- C. L. Adam, S. W. Gratz, D. I. Peinado, L. M. Thomson, K. E. Garden, P. A. Williams, A. J. Richardson and A. W. Ross, PLoS One, 2016, 11, e0155871 CrossRef.
- K.-H. Han, N. Hayashi, N. Hashimoto, K.-i. Shimada, M. Sekikawa, T. Noda and M. Fukushima, Ann. Nutr. Metab., 2008, 52, 1–7 CrossRef CAS.
- J. O'Grady, E. M. O'Connor and F. Shanahan, Aliment. Pharmacol. Ther., 2019, 49, 506–515 CrossRef.
- C. S. Byrne, E. S. Chambers, D. J. Morrison and G. Frost, Int. J. Obes., 2015, 39, 1331–1338 CrossRef CAS.
- M. van de Wouw, H. Schellekens, T. G. Dinan and J. F. Cryan, J. Nutr., 2017, 147, 727–745 CrossRef CAS PubMed.
- F. Greenway, C. E. O'Neil, L. Stewart, J. Rood, M. Keenan and R. Martin, J. Med. Food, 2007, 10, 720–724 CrossRef CAS.
- S. O. Fetissov, Nat. Rev. Endocrinol., 2016, 13, 11–25 CrossRef.
- R. E. Steinert, C. Feinle-Bisset, L. Asarian, M. Horowitz, C. Beglinger and N. Geary, Physiol. Rev., 2017, 97, 411–463 CrossRef.
- K. K. Buhman, E. J. Furumoto, S. S. Donkin and J. A. Story, J. Nutr., 1998, 128, 1199–1203 CrossRef CAS.
- P. A. Santiago-García and M. G. López, Food Funct., 2014, 5, 3311–3319 RSC.
- M. L. R. P. Lima, L. H. R. Leite, C. R. Gioda, F. O. P. Leme, C. A. Couto, C. C. Coimbra, V. H. R. Leite and T. C. A. Ferrari, J. Diabetes Res., 2016, 2016, 1–10 CrossRef.
- R. W. Johnstone, Nat. Rev. Drug Discovery, 2002, 1, 287–299 CrossRef CAS.
- P. D. Cani, S. Possemiers, T. Van de Wiele, Y. Guiot, A. Everard, O. Rottier, L. Geurts, D. Naslain, A. Neyrinck, D. M. Lambert, G. G. Muccioli and N. M. Delzenne, Gut, 2009, 58, 1091–1103 CrossRef CAS.
- G. den Besten, K. van Eunen, A. K. Groen, K. Venema, D.-J. Reijngoud and B. M. Bakker, J. Lipid Res., 2013, 54, 2325–2340 CrossRef CAS.
- S. W. Ragsdale and E. Pierce, Biochim. Biophys. Acta, 2008, 1784, 1873–1898 CrossRef CAS.
- N. Reichardt, S. H. Duncan, P. Young, A. Belenguer, C. McWilliam Leitch, K. P. Scott, H. J. Flint and P. Louis, ISME J., 2014, 8, 1323–1335 CrossRef CAS.
- P. Louis, S. H. Duncan, S. I. McCrae, J. Millar, M. S. Jackson and H. J. Flint, J. Bacteriol., 2004, 186, 2099–2106 CrossRef CAS.
- R. Visvanathan, C. Jayathilake, B. Chaminda Jayawardana and R. Liyanage, J. Sci. Food Agric., 2016, 96, 4850–4860 CrossRef CAS.
- C. De Filippo, D. Cavalieri, M. Di Paola, M. Ramazzotti, J. B. Poullet, S. Massart, S. Collini, G. Pieraccini and P. Lionetti, Proc. Natl. Acad. Sci. U.S.A., 2010, 107, 14691–14696 CrossRef.
- Y. Sun, S. Chen, R. Wei, X. Xie, C. Wang, S. Fan, X. Zhang, J. Su, J. Liu, W. Jia and X. Wang, Food Funct., 2018, 9, 3547–3556 RSC.
- T. Ju, J. Y. Kong, P. Stothard and B. P. Willing, ISME J., 2019, 13, 1520–1534 CrossRef CAS.
- F. de Vadder and G. Mithieux, J. Endocrinol., 2018, 236, R105–R108 Search PubMed.
- B. U. Metzler-Zebeli, S. Schmitz-Esser, E. Mann, D. Grüll, T. Molnar, Q. Zebeli and J. Björkroth, Appl. Environ. Microbiol., 2015, 81, 8489–8499 CrossRef CAS PubMed.
- D. Zhou, Q. Pan, F.-Z. Xin, R.-N. Zhang, C.-X. He, G.-Y. Chen, C. Liu, Y.-W. Chen and J.-G. Fan, World J. Gastroenterol., 2017, 23, 60 CrossRef CAS PubMed.
- L. Luo, M. H. Hu, Y. Li, Y. X. Chen, S. B. Zhang, J. H. Chen, Y. Y. Wang, B. Y. Lu, Z. Y. Xie and Q. F. Liao, RSC Adv., 2018, 8, 20166–20181 RSC.
- M. G. Langille, J. Zaneveld, J. G. Caporaso, D. McDonald, D. Knights, J. A. Reyes, J. C. Clemente, D. E. Burkepile, R. L. Vega Thurber, R. Knight, R. G. Beiko and C. Huttenhower, Nat. Biotechnol., 2013, 31, 814–821 CrossRef CAS.
Footnote |
| † Electronic supplementary information (ESI) available. See DOI: 10.1039/c9ra04867g |
| This journal is © The Royal Society of Chemistry 2019 |